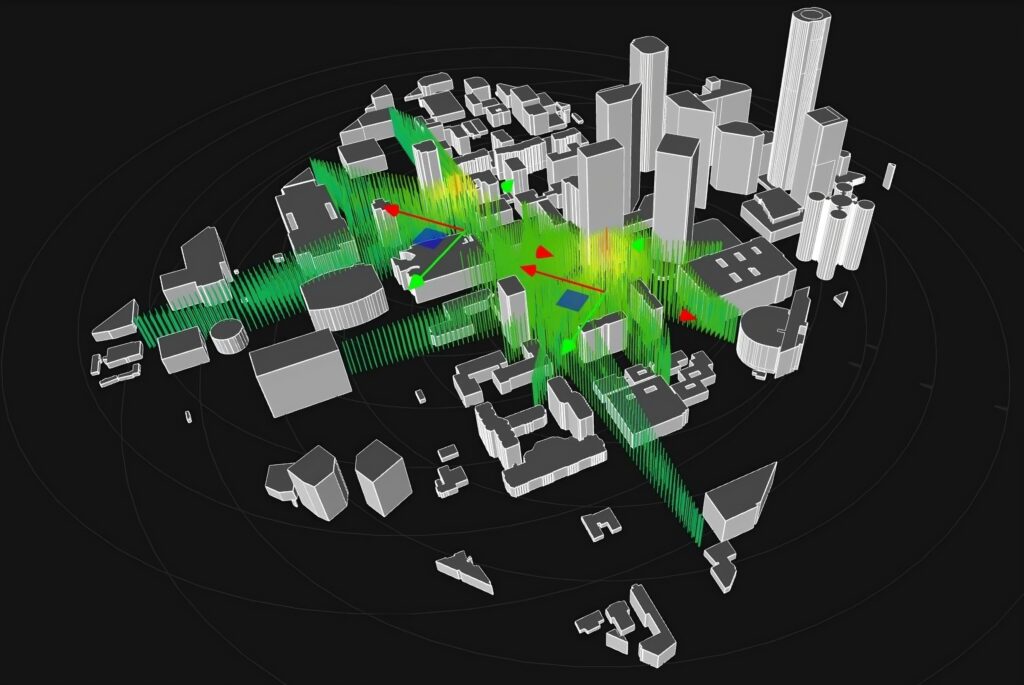
NOISENSE emerges as a dynamic tool that facilitates the visualization of otherwise visually imperceptible phenomena within spaces. Through sound simulation and virtual prototyping techniques, NOISENSE aims to go beyond the limitations of human auditory perception, thereby enabling the visualization and replication of sound atmospheres. By conceptualizing sound as a spatial field, the online app allows for the interaction of sound waves within physical environments. This approach entails overlapping physical spaces with digitally rendered counterparts generated by sound sources, thereby rendering audible phenomena visible. Moreover, by capturing individual perceptions of sound levels and their interplay, it is possible to construct comprehensive dynamic diagrams that not only depict sound propagation but also inform better design decisions. Ultimately, the overall endeavor empowers users to construct their own perceptual understanding of the world through sound, while offering a snapshot of spatial perception at a given moment in time.

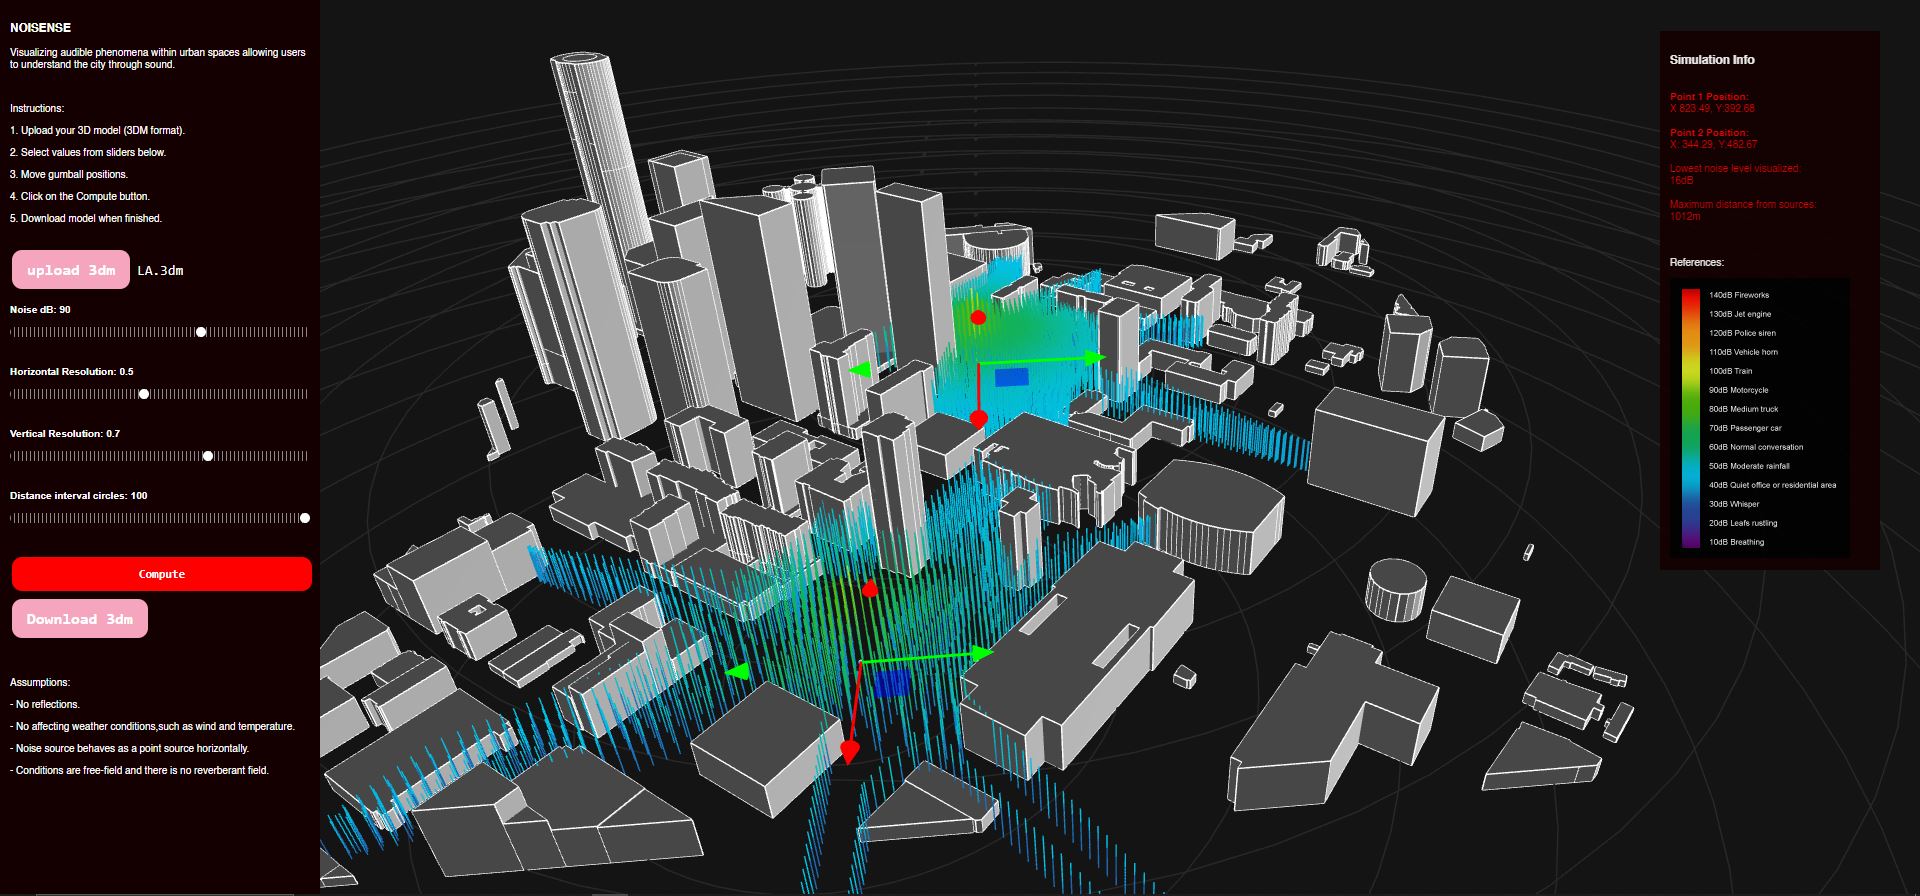
NOISENSE is a simple application designed to visually represent urban noise dynamics by juxtaposing graphical data. By overlapping physical city data, this tool facilitates a comparative analysis of two different noise source fields and their respective impacts on the urban environment.
Input
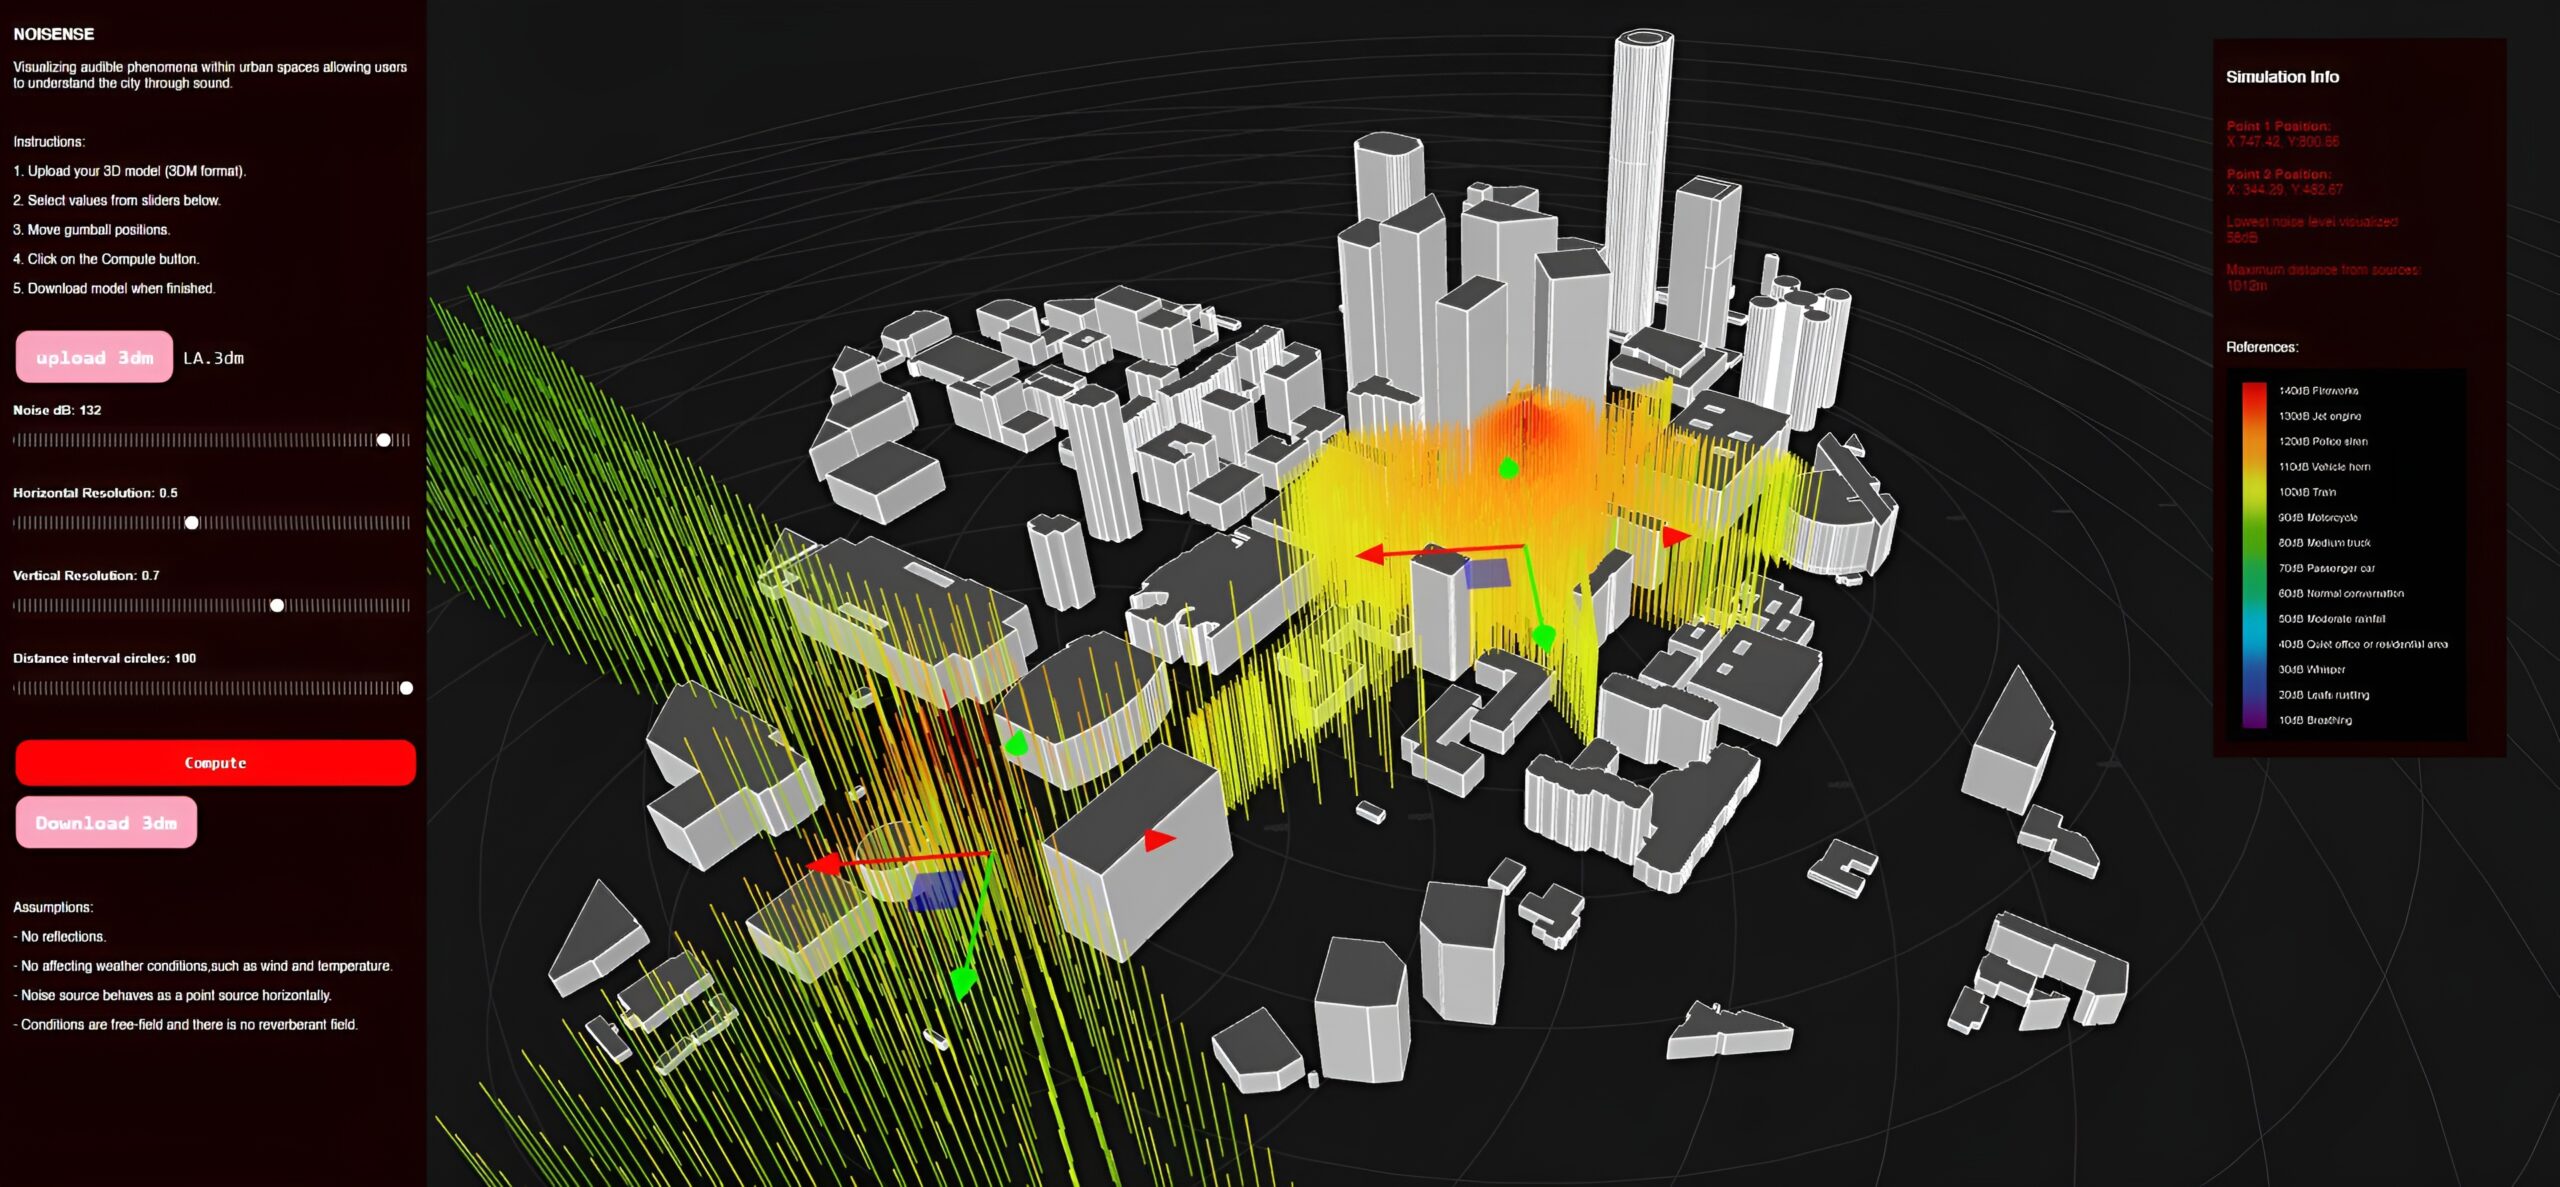
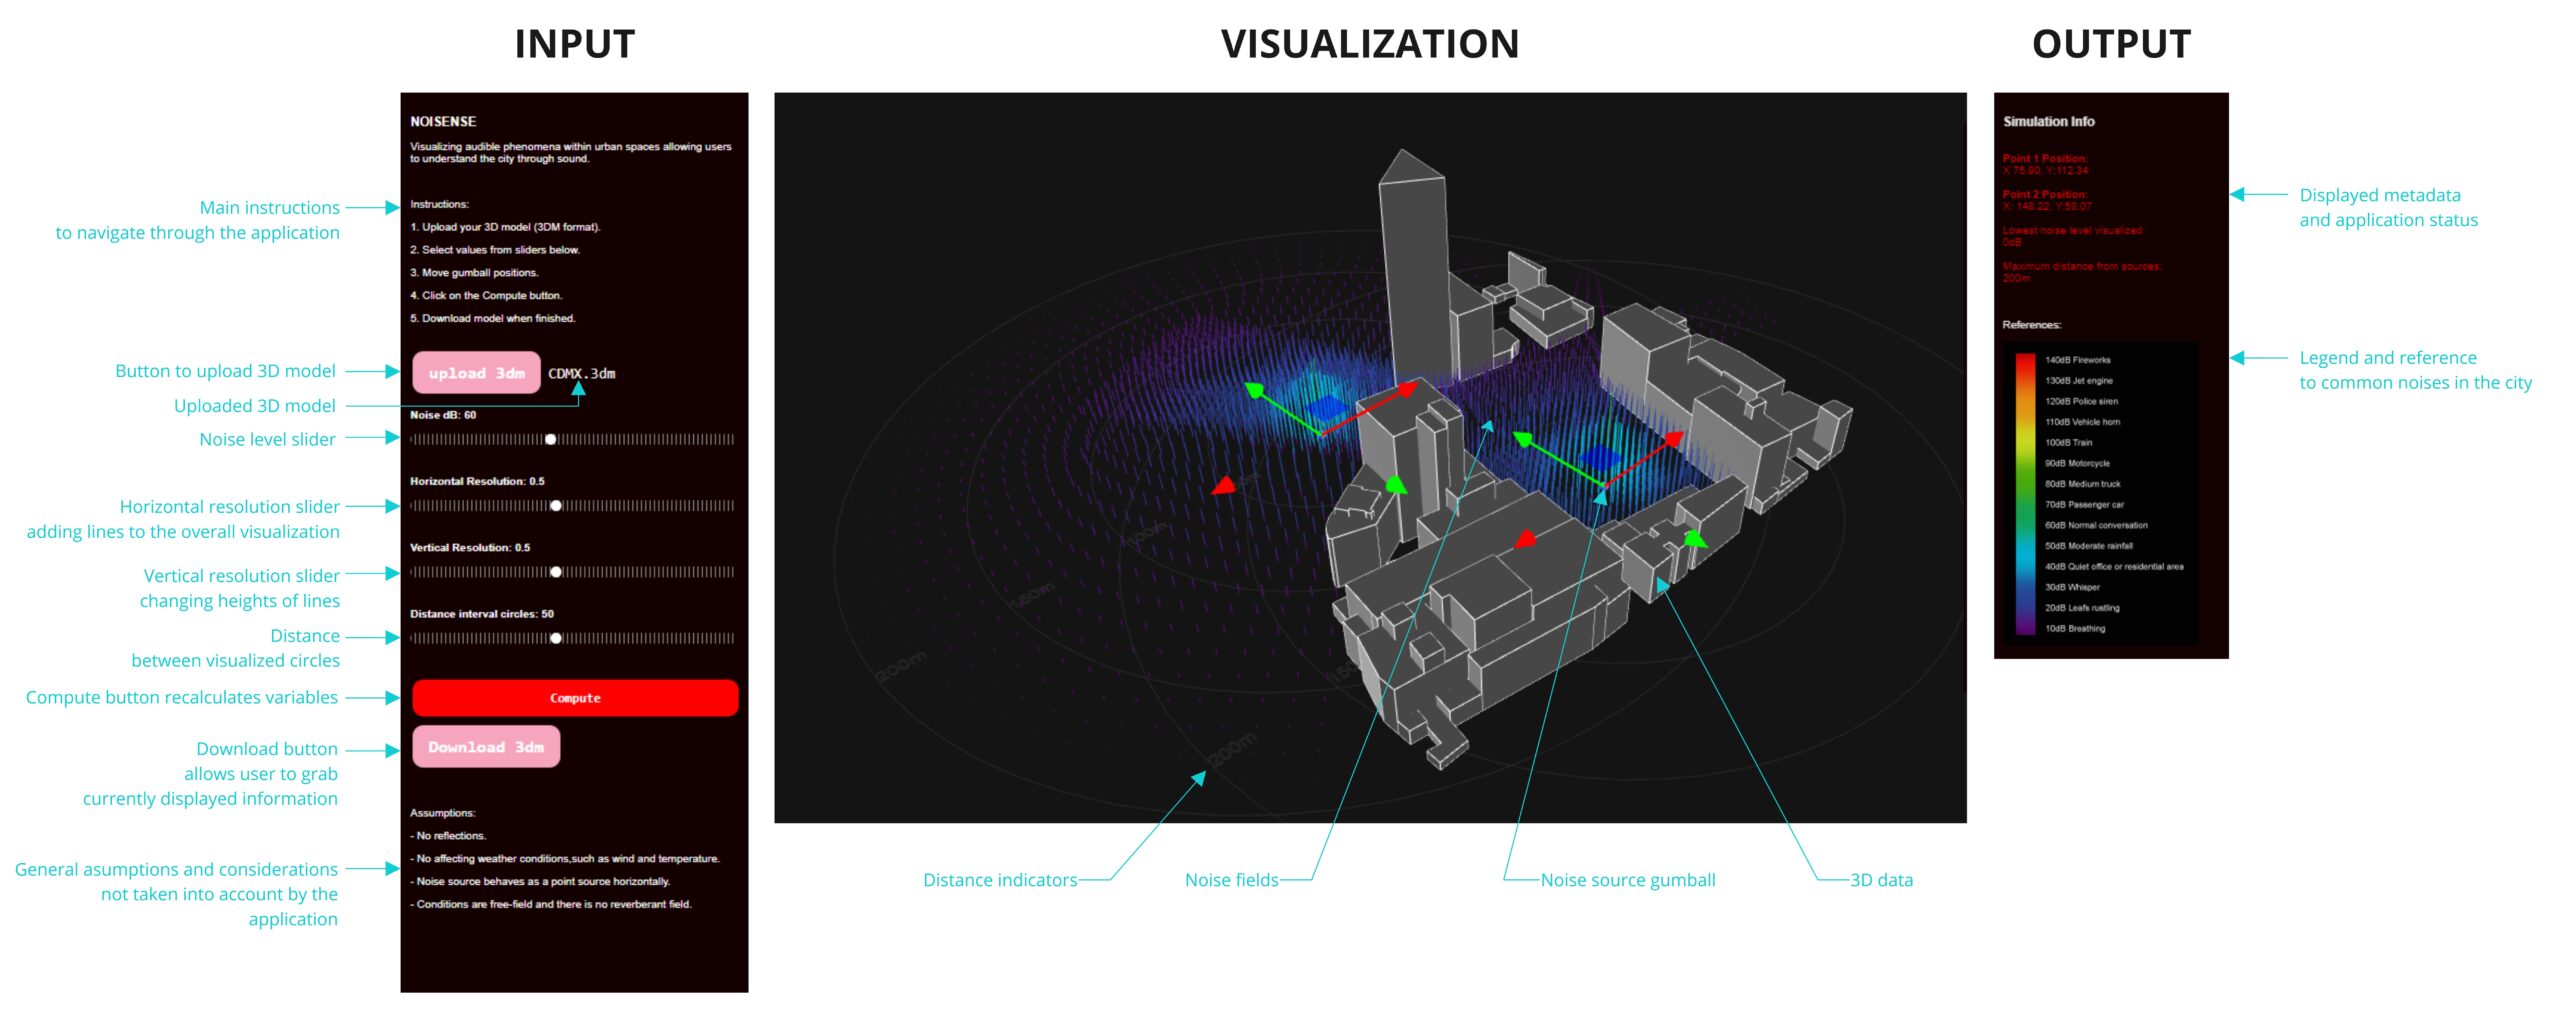
The application begins with the user loading a three-dimensional model of a city, a process that may require a brief pause for rendering the model. The user is then prompted to manipulate various parameters via intuitive sliders, which allow adjustment of noise levels measured in decibels, horizontal and vertical resolutions that determine line density and height, and spatial offset between circles that serve as a visual reference to distance. In addition, users can manipulate the position of the two noise sources before starting the computation.
Output
The resulting output is carefully designed to provide optimal visual comprehension, representing a large amount of three-dimensional data directly on the screen. Using a spectrum of colors and line lengths, the application illustrates various levels of noise intensity visually, complemented by a legend on the right-hand side of the interface that acts a noise reference to common noise levels within a city. In particular, spatial distances are delineated by the placement of circles at the specified distance intervals from the inputs. In addition, basic metadata is provided including the coordinates of each noise source, the minimum noise level displayed, and the maximum range between sources. Finally, users can download the augmented 3D model containing the computed results.


Considerations
As for the underlying simulation methodology, it is important to recognize its dependence on a mathematical formula driving the propagation of sound. While recognizing its inherent limitations, the application takes advantage of simple isovist algorithm to simulate the interaction between sound waves and urban structures, although without taking into account possible reflections or reverberations. Other assumptions are made about the predominantly horizontal behavior of noise sources within the app, while factors such as temperature and wind are not taken into account in its computational framework.

