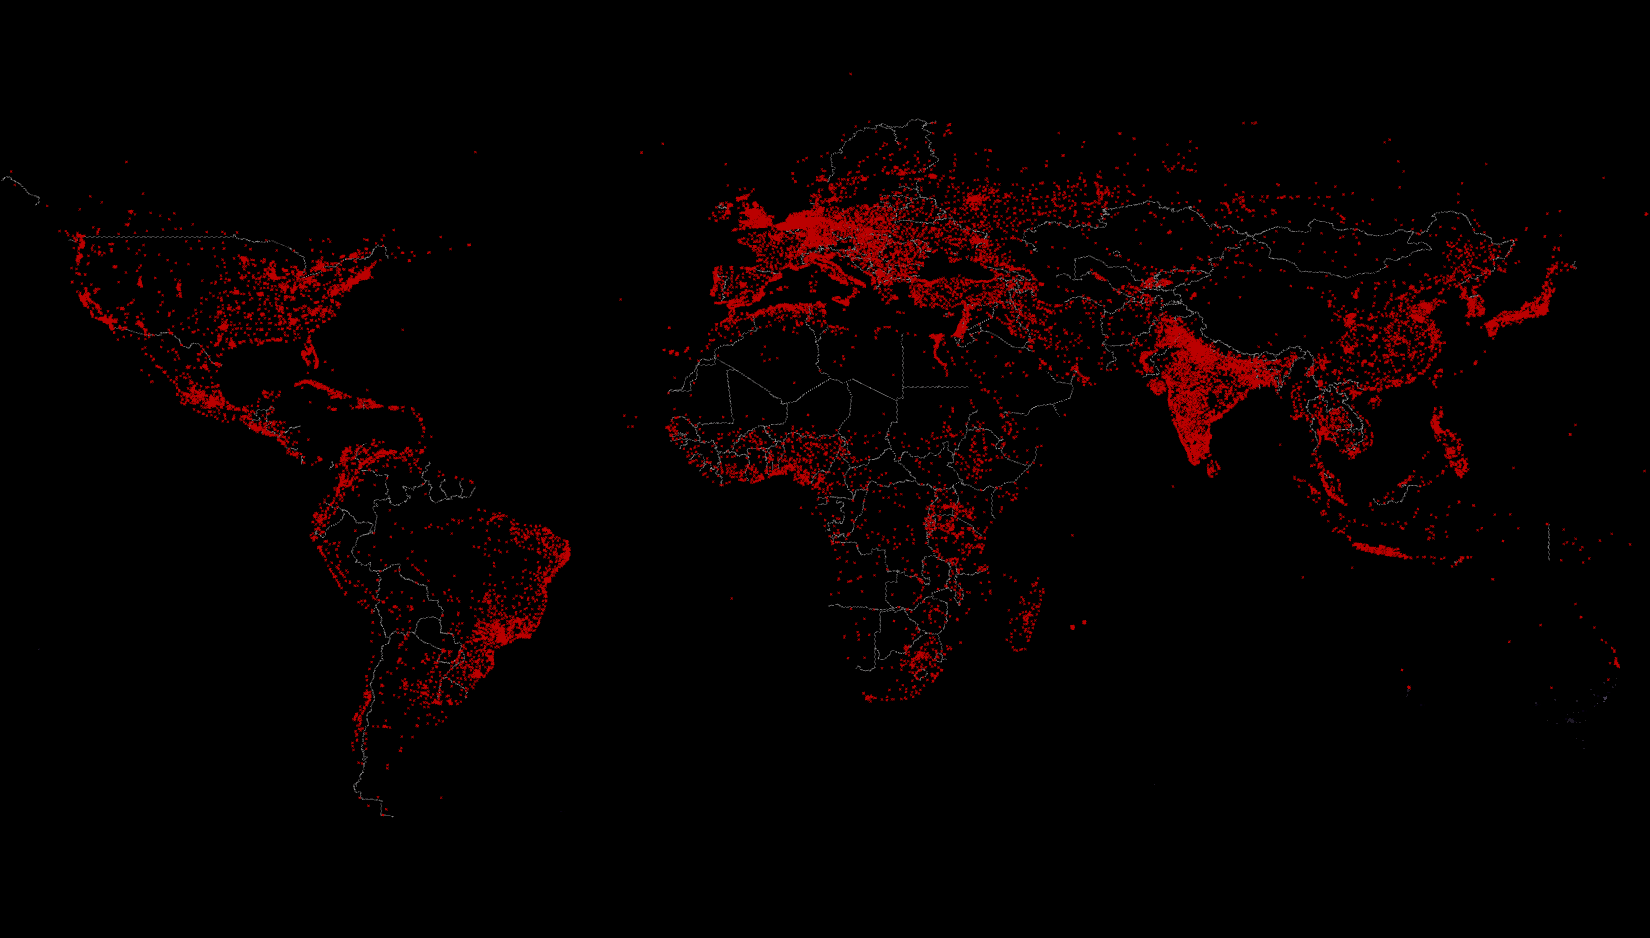
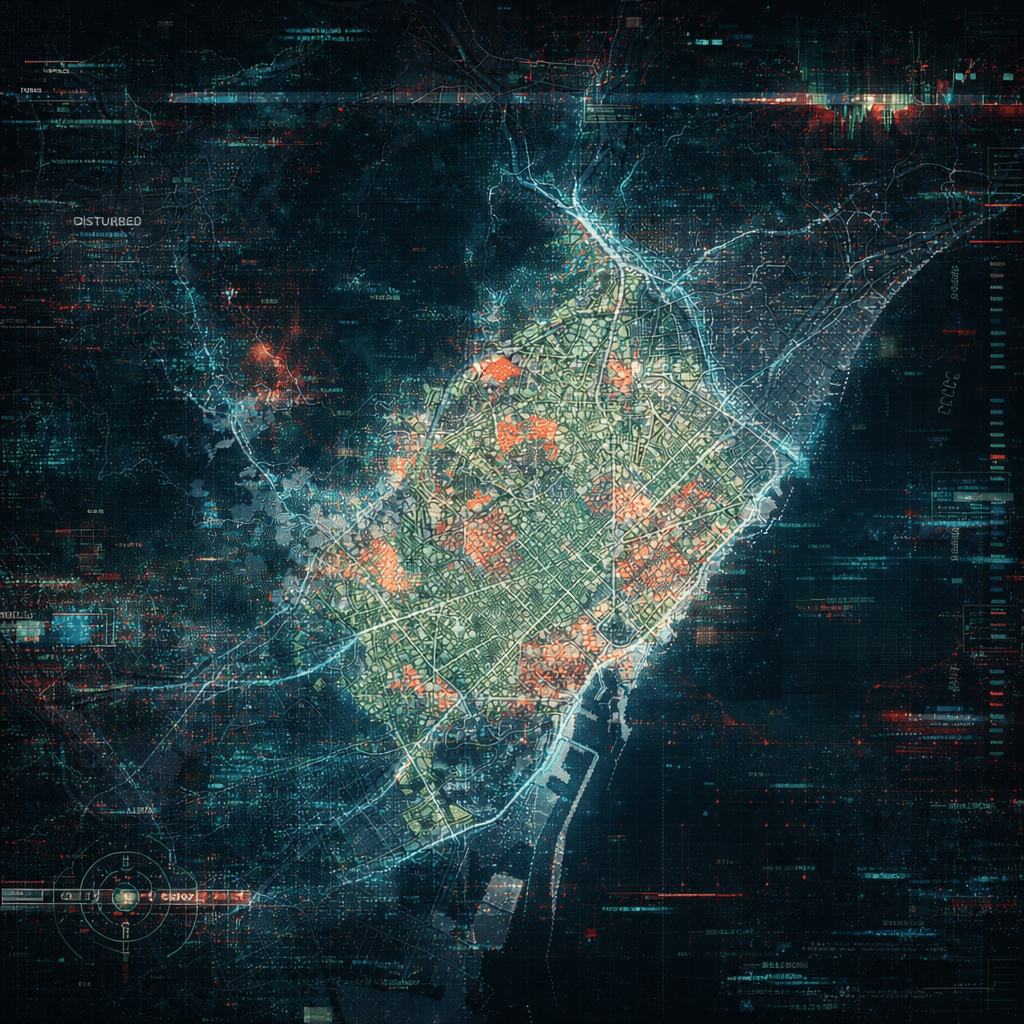
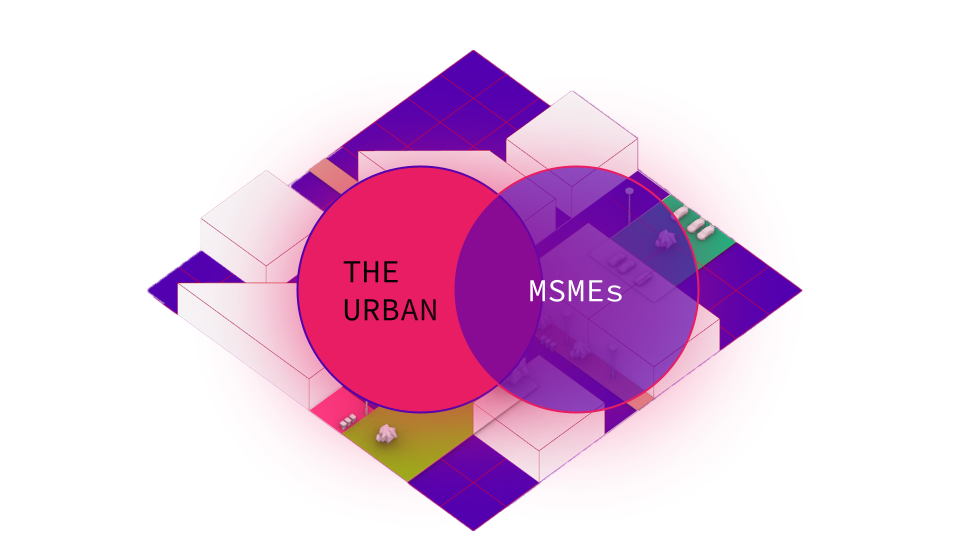
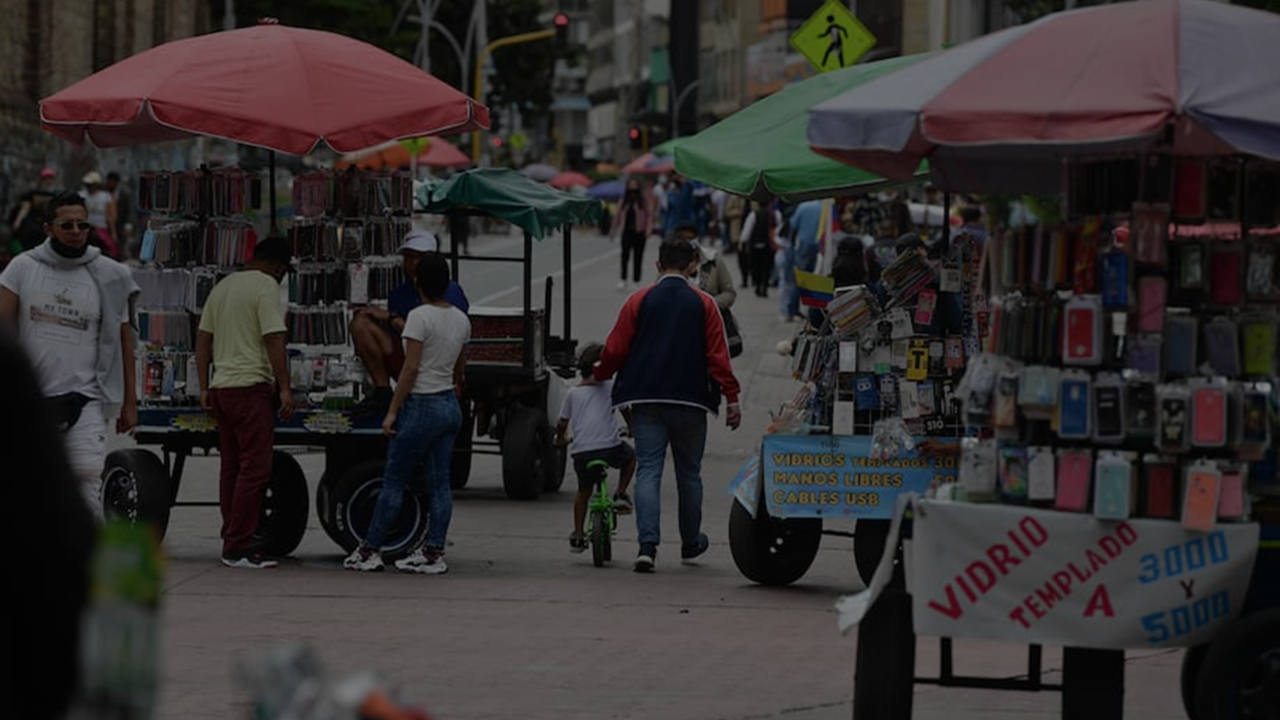
IAAC’s Master in City & Technology (1 or 2-year program) is a unique program oriented towards redefining the analysis, planning, and design of twenty-first-century cities and beyond. The program offers expertise in the design of digitally enhanced, ecological and human-centered urban environments by intersecting the disciplines of urbanism and data science. Taking place in Barcelona, the capital of urbanism, the Master in City & Technology is training the professionals that city administrations, governments, industries, and communities need, to transform the urban environment in the era of big data.


Coltura

Introduction Milan, Northern Italy’s epicenter, confronts economic and environmental challenges rooted in a shift from agriculture to manufacturing. To secure its future, Milan invests in knowledge, tourism, and place-based innovation, relying on revenue from high-income foreigners, students, and the European Union. Strategic efforts to transition to a green economy focus on renewable energy, waste reduction, … Read more

Annual and Cumulative Analysis of Pesticide Concentration in Multiple Locations: Understanding Trends and Patterns

Introduction: Understanding the presence and distribution of pollutants like pesticides is crucial. In this blog post, I’ll delve into a Python-based analysis exploring pesticide concentration trends across diverse locations. I’ll use Python’s data analysis libraries to decipher annual trends and gain an overarching understanding of pesticide presence. Interpretation and Conclusion: My Python-based analysis shed light … Read more

Coding Nature

Investigating the Impact of Open Green Spaces on Airbnb Rates with Python 1. Introduction The industry of tourism in Barcelona has seen a major hike in the past couple years. Post-covid Barcelona has also become an educational hub for students from across the globe. The increase in Inflow of people has also made platform urbanism … Read more

The CourtForge

Enlarging the great… Emanuel Ginobili is one of the most -if not the most- accomplished Argentinian basketball players. During his 16 season basketball career in the NBA, that went on from 2002 to 2018, he won 4 championships as one of the San Antonio Spurs “Big Three”, was named an All-Star twice, was selected for … Read more

Visualizing GeoSpatial Data in Python – Going from Csv to Graph

Visualizing dataframes using Geopandas and Plotly in Python introduction Python is a versatile and easy-to-learn programming language. GeoPandas extends the data manipulation capabilities of pandas to spatial data, providing a familiar and convenient environment for working with both tabular and geographical data. GeoPandas makes it easy to load, explore, and analyze geographical data. You can … Read more

Navigating GeoPandas and the Digital Wilderness

“Start the machine” …was the first operation in mind when asked to perform a task with Python script. One of the motivations to learn Python as an urban designer is to organize geospatial data with accuracy and legibility. Before we dive into the digital wilderness, of data trees and data frames, it’s important to note … Read more

From Guest to Spatial Data Analyst

Introduction Airbnb is a well know marketplace that connects people who want to rent out their property with people who are looking for accommodations, typically for short stays (Investopedia, 2023). As a powerful tool to connect people to hospitality supply around the world, and provide them quality spaces to stay, it heavily relies on the … Read more

Data Visualisation using Python

Introduction In today’s data-driven world, the ability to visualize data effectively is a key skill. This blog post introduces the fundamentals of data visualization using Python, a powerhouse in the data science toolkit. We’ll explore essential libraries like GeoPandas, Plotly and Contextily, guiding you through the process of transforming raw data into insightful, visually appealing … Read more

Note Palette

Music is visualized everyday – but is there any accuracy to its representation? Can sound be accurately represented? If so, what does it look like? How is accuracy measured? While not fully satisfied with the answers found to these questions, Python’s mido package shed light on the how sound and color may be linked through … Read more

Data Visualization Using GeoPandas in Python

1.Geospatial Mapping using GeoPandas in Python In Python, GeoPandas plays a crucial role in facilitating geospatial analysis through its powerful functions. I will illustrate the concise process of leveraging GeoPandas to create maps of Barcelona. This involves a systematic application of GeoPandas’ functions for effective geospatial data synthesis and mapping. Step 1: Loading GeoDataFrame from … Read more

Promised Land

Mesh representation of MIDI

Mapping America’s Genrescape Promised Land, Chuck Berry’s early representation of modern rock and roll, blurs racialized difference in genre origin, fueling the hybridization of genre categorizes, resulting in America’s current rich music tapestry. MIDI data correlated to synaesthetic representations of color is crystalized and in a dense three-dimensional mesh and place qualities are correlated to … Read more

Visualization of Complex Innovation Data using Python

Innovation is a buzzword these days, and everyone seems to be talking about it. However, truly understanding it is a different ball game. Take the Global Innovation Index by the World Intellectual Property Organization (WIPO), for example. It’s a massive framework that pulls data from top-tier organizations worldwide, scoring countries on 100+ indicators. It’s a … Read more

Decarbonization of Housing Stock in EU

Buildings are an intrinsic part of our lives, where we spend most of our time and unfold as human beings. However, through its different forms, the built environment is responsible for the majority of our energy consumption (around 40 %) and a primary source of greenhouse emissions GHG (around 36 %) (Anderson et al., 2015).  … Read more

A good worker has good taste in food!!

Some Japanese monk said “Eat well, work hard, and sleep well. This harmony is the basis of a good spirit.”From this maximum, I assumed the cities with a good work-life balance, have many delicious restaurants. Subject goal In this class, I make the graph from the open data by Pthon. Hypothesis There are many restaurants … Read more

Deaths from air pollution in Central Europe

Air pollution- the combination of outdoor and indoor particulate matter, and ozone– causes more than 7 million deaths each year (World Health Organisation) and it is considered to be one of the world’s largest health and environmental problems. The same data shows that 99% of the world population currently live in places with air quality … Read more

Healthcare BCN

Understanding and analysing the existing Healthcare system of Barcelona with the help of open datasets available. This further helps us to understand the robustness, need and requirement to fill the gaps in the system if any with respect to their typologies and location as per districts Step 1: Documenting the distribution of different types of … Read more

Birds and weather connectivity

This project was carried out to support research on the relationship between bird populations and natural conditions in the province of Barcelona, Catalonia. In conclusion, the most frequently observed migratory bird Cattle Egret in the province of Barcelona was identified and the rainiest time of the year is spring (month – April) when its migrating … Read more

Big Data Analytics in the Airline Industry

The case of Greece The air connections constitute critical components of the entire transportation industry in Greece. The geopolitical position of the country as well as its geographical features (mountainous landscape, islands and sea) make the air transport industry essential not only to the regional development and the growth of tourist activity, that comprises a … Read more

Correlation of real estate prices and income in USA

There are over 40,000 ZIP codes in the United States. Categorization by states and ZIP codes in order to compare data, find distinctive features and intercorrelations, and put data on map. VIsualization performed by Python, Plotly Express, Folium. In order to simplify tasks the dataset of 12 North East states is used.

Fun facts about Oscar and film industry

Every February, film lovers would be expecting where would the Oscar Awards go to. Academy Awards, known as Oscar has gone through 94 years, encouraging the workers as well as the industry developing. When we go back to the data about Oscar and the film production industry, we can find some interesting facts. I collected … Read more