
Who
- Developers
- Institutional Investors
- Realtors
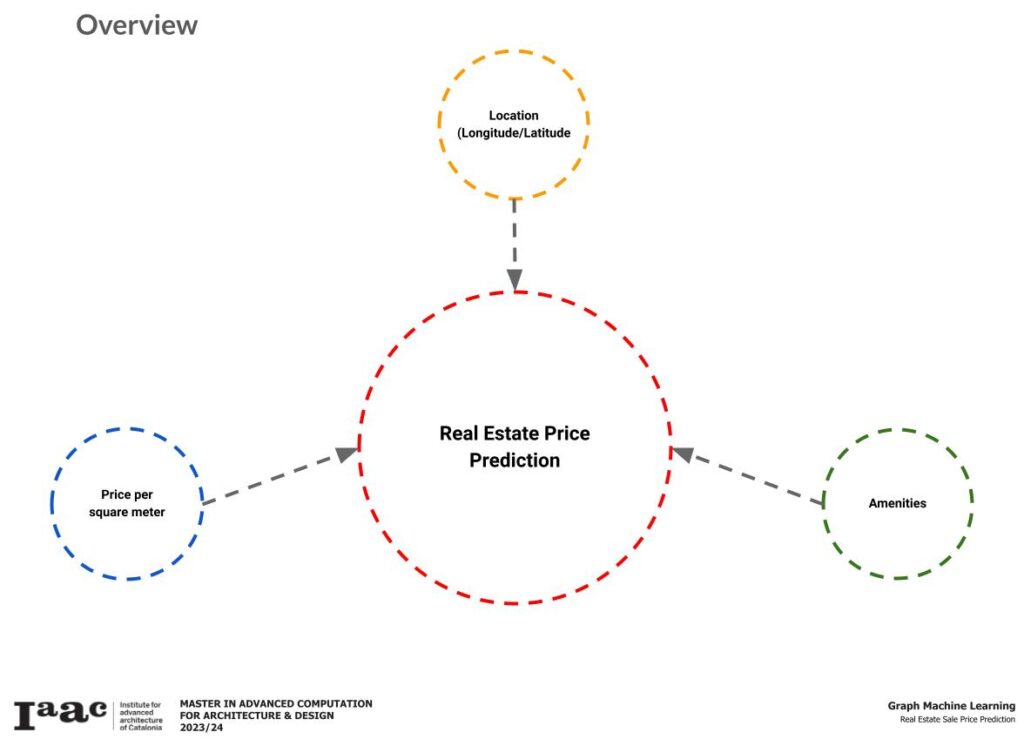
Why:
- Housing market analysis through the sale price per Meter Square
- Correlation between proximity of amenities and residential real estate prices
- Evaluating/Predicting the investment rate/risk in terms of neighborhoods
For the Amenities, we selected the following due to its overall correlation with residential real estate and we anticipate that it will give a good indication of how the properties would be priced.
- Bars
- Cafes
- Restaurants
- Schools
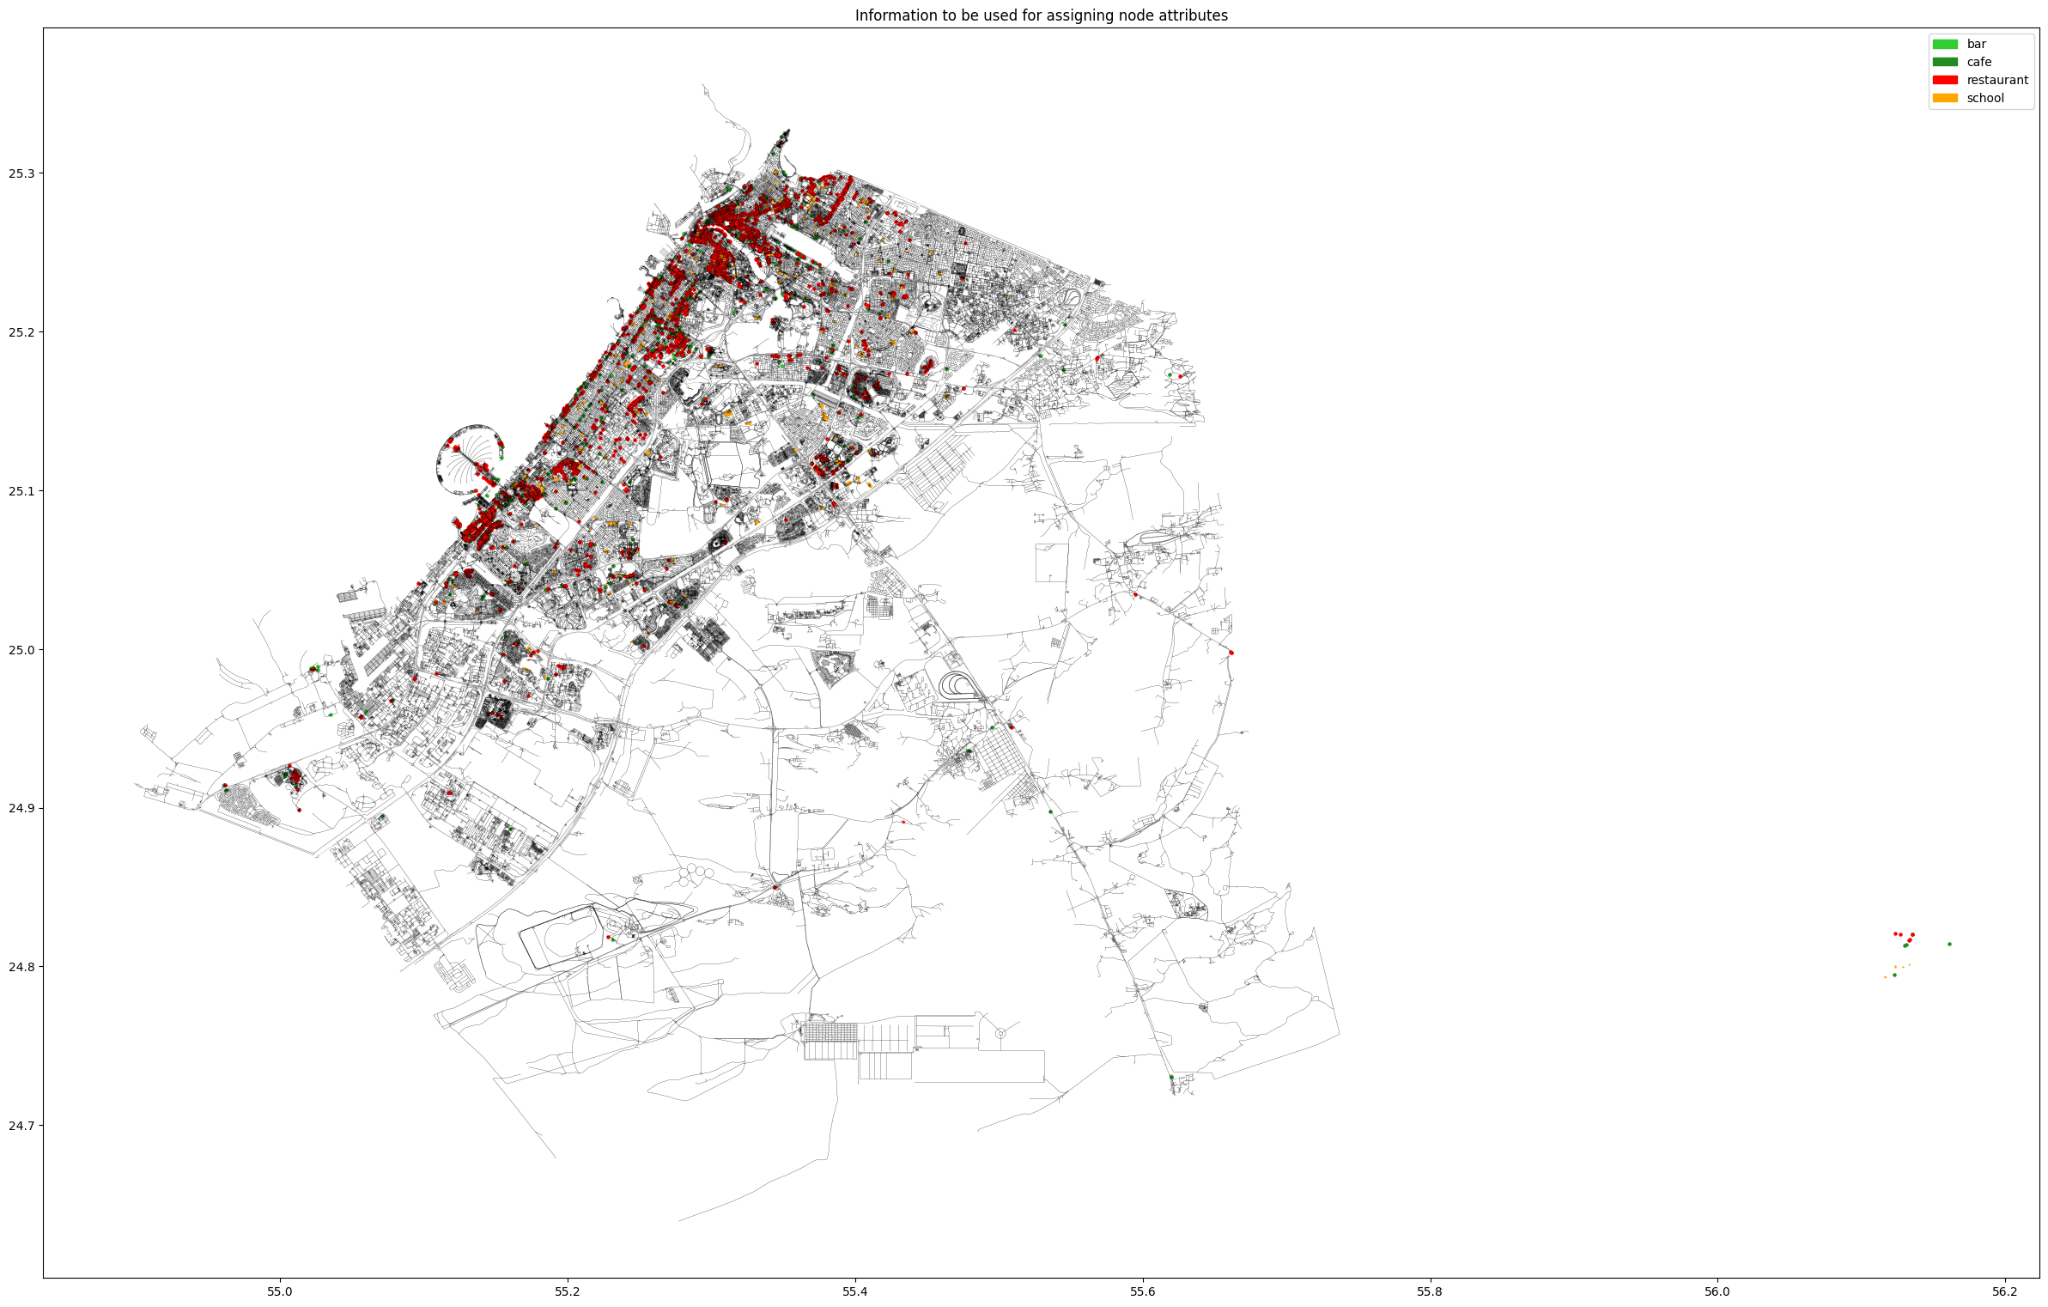
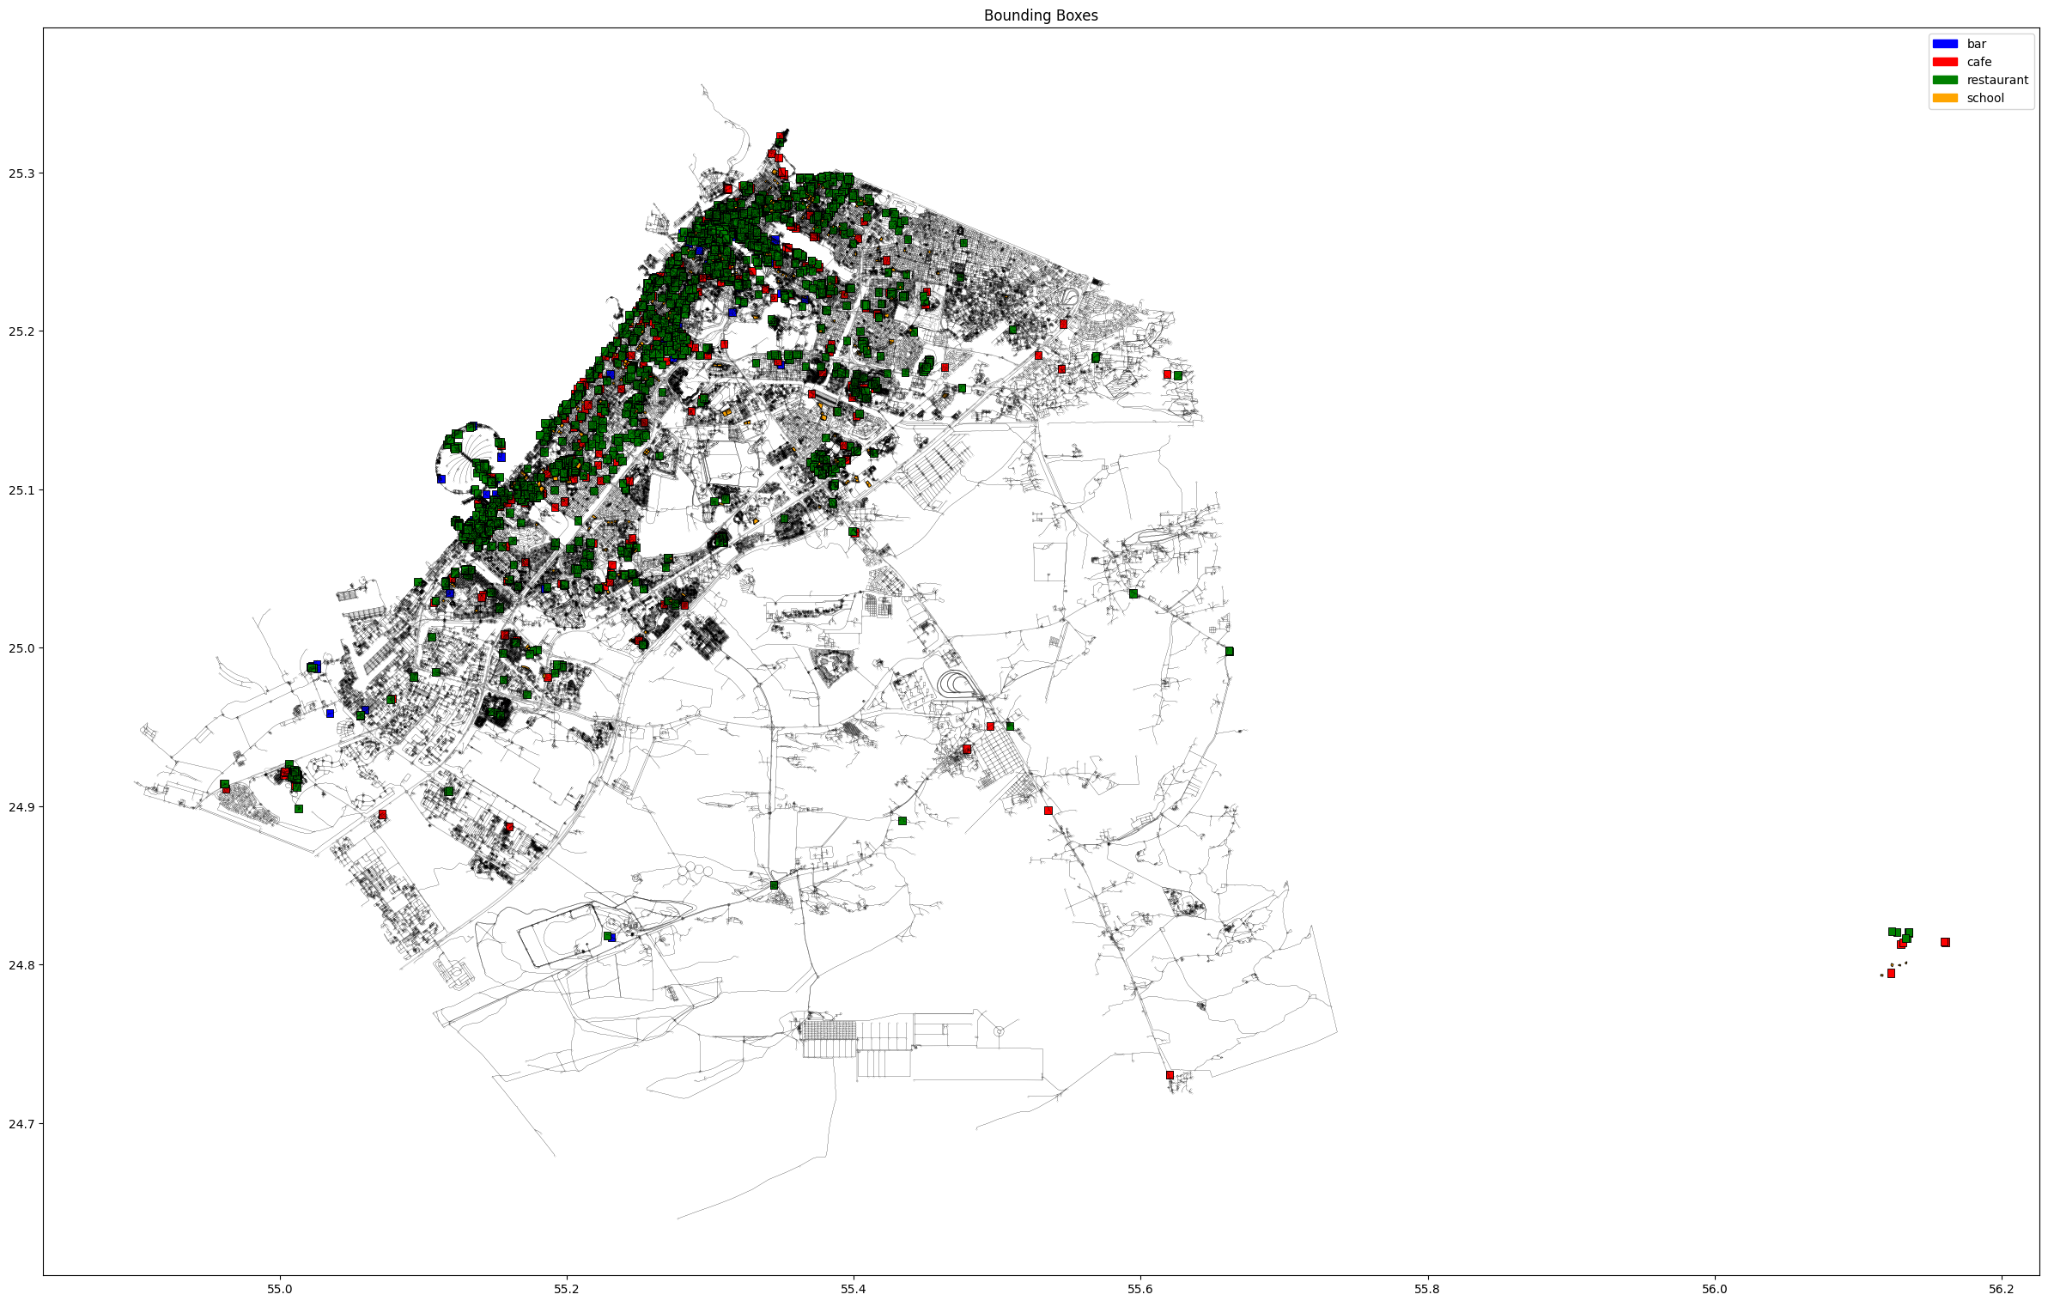
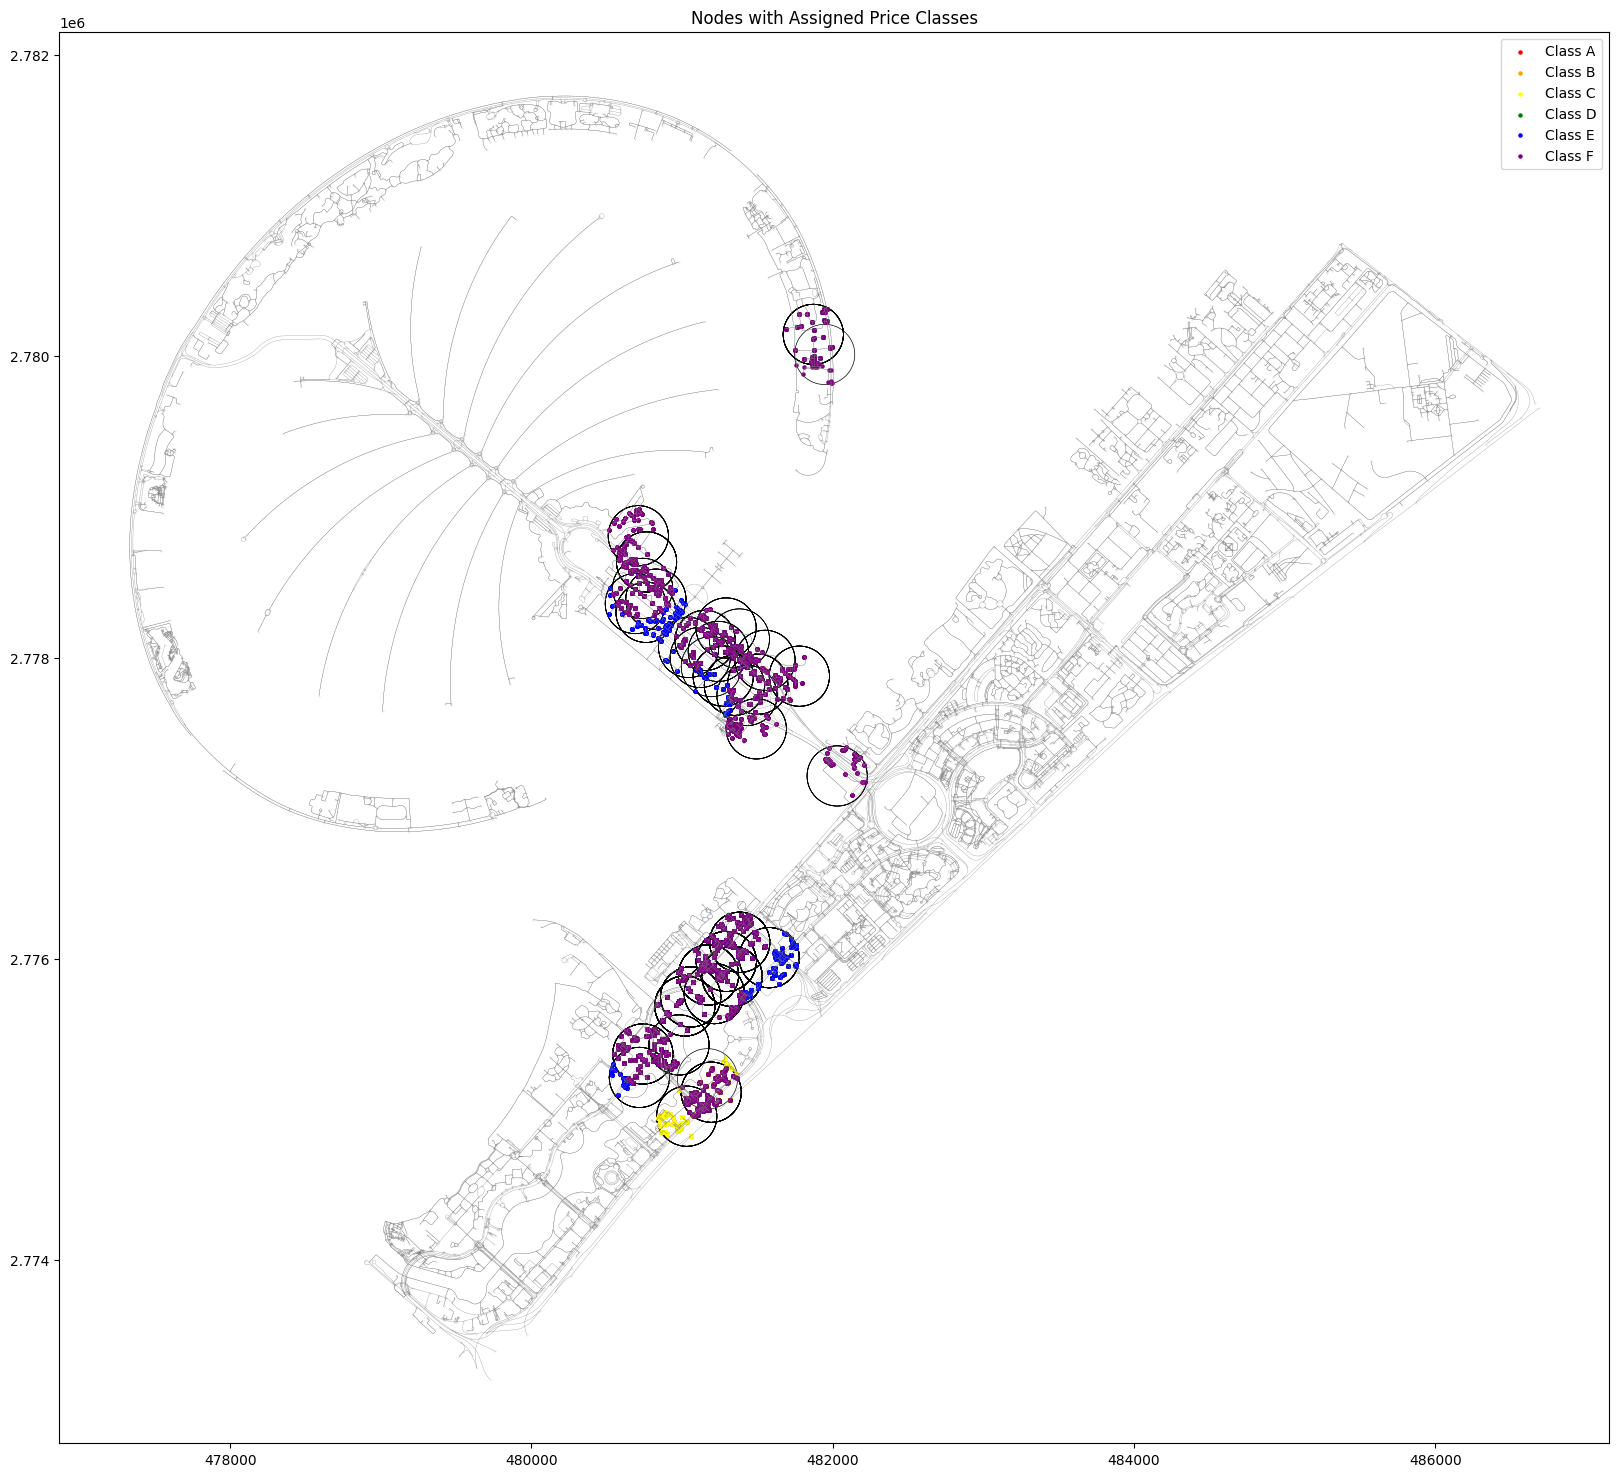
By creating bounding boxes around the amenities, with a radius of 1km, we ensure that as much of the graph nodes as possible are included
After creating a dictionary keyed by the graph point spatial index and valued by a list represents how many times this point was selected by a bar, a cafe, a restaurant and a school.
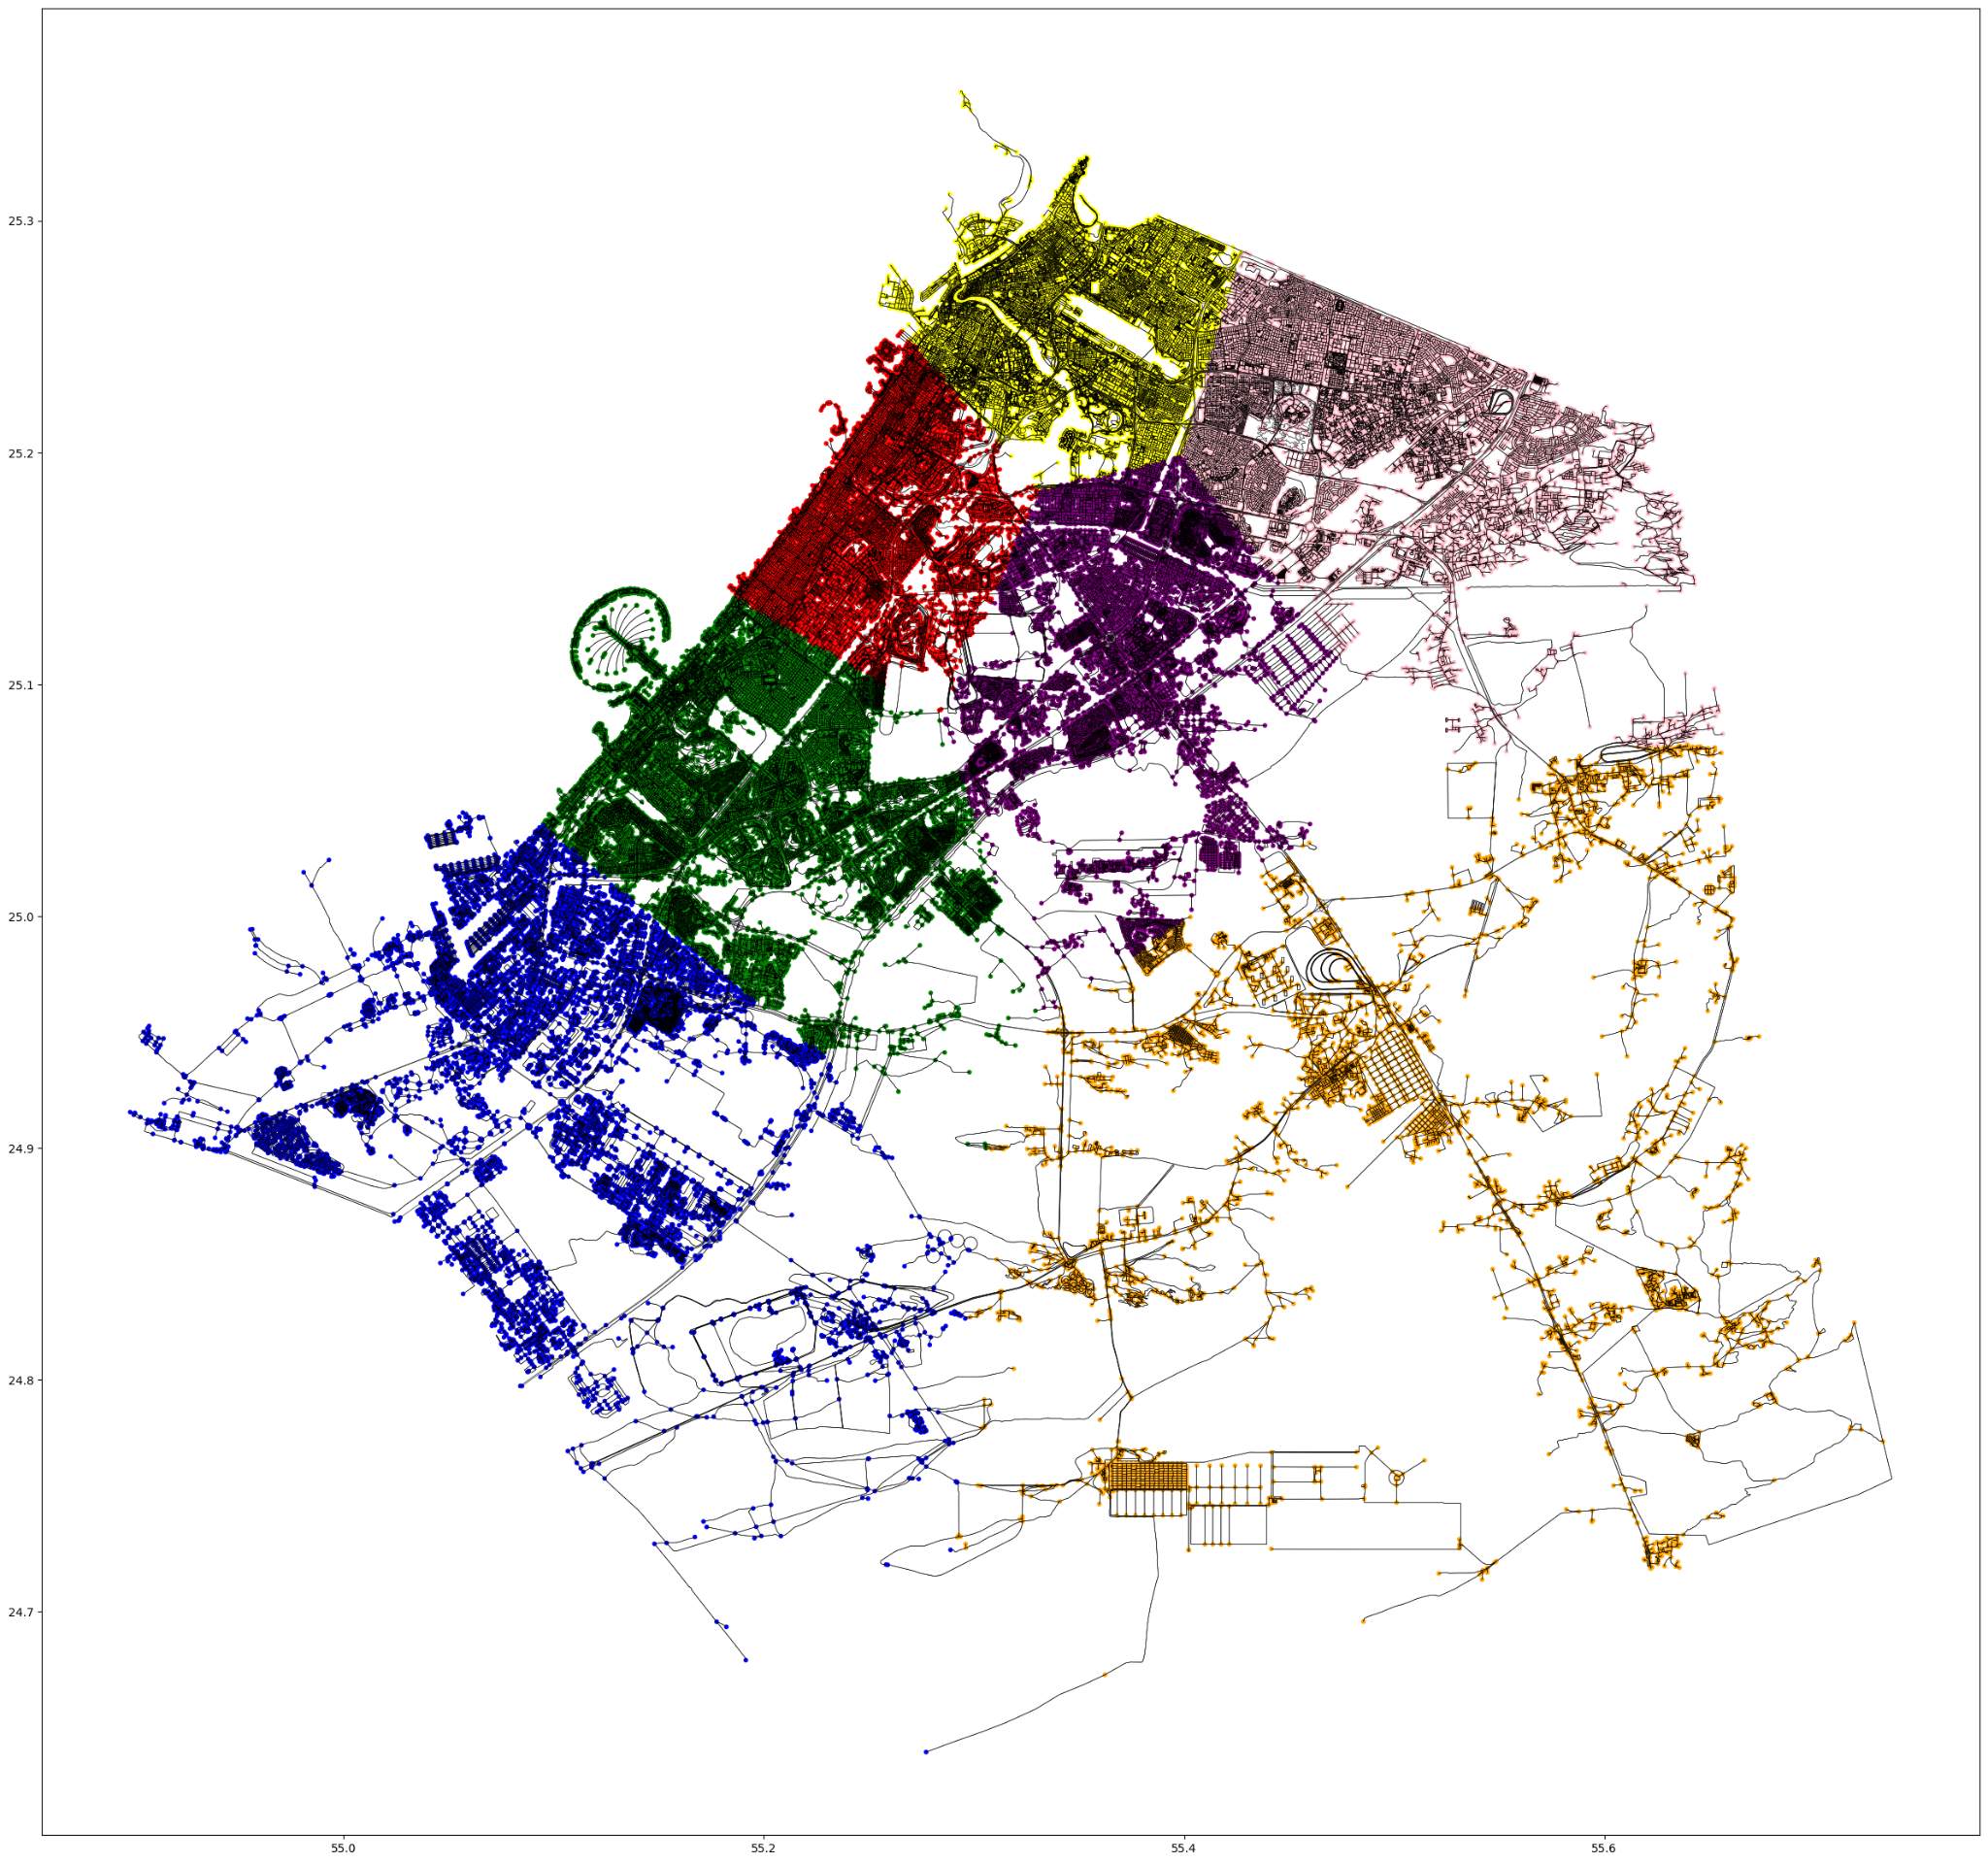
We cluster this based on proximity since it is expected that the nodes within same clusters should more or less share similar class.
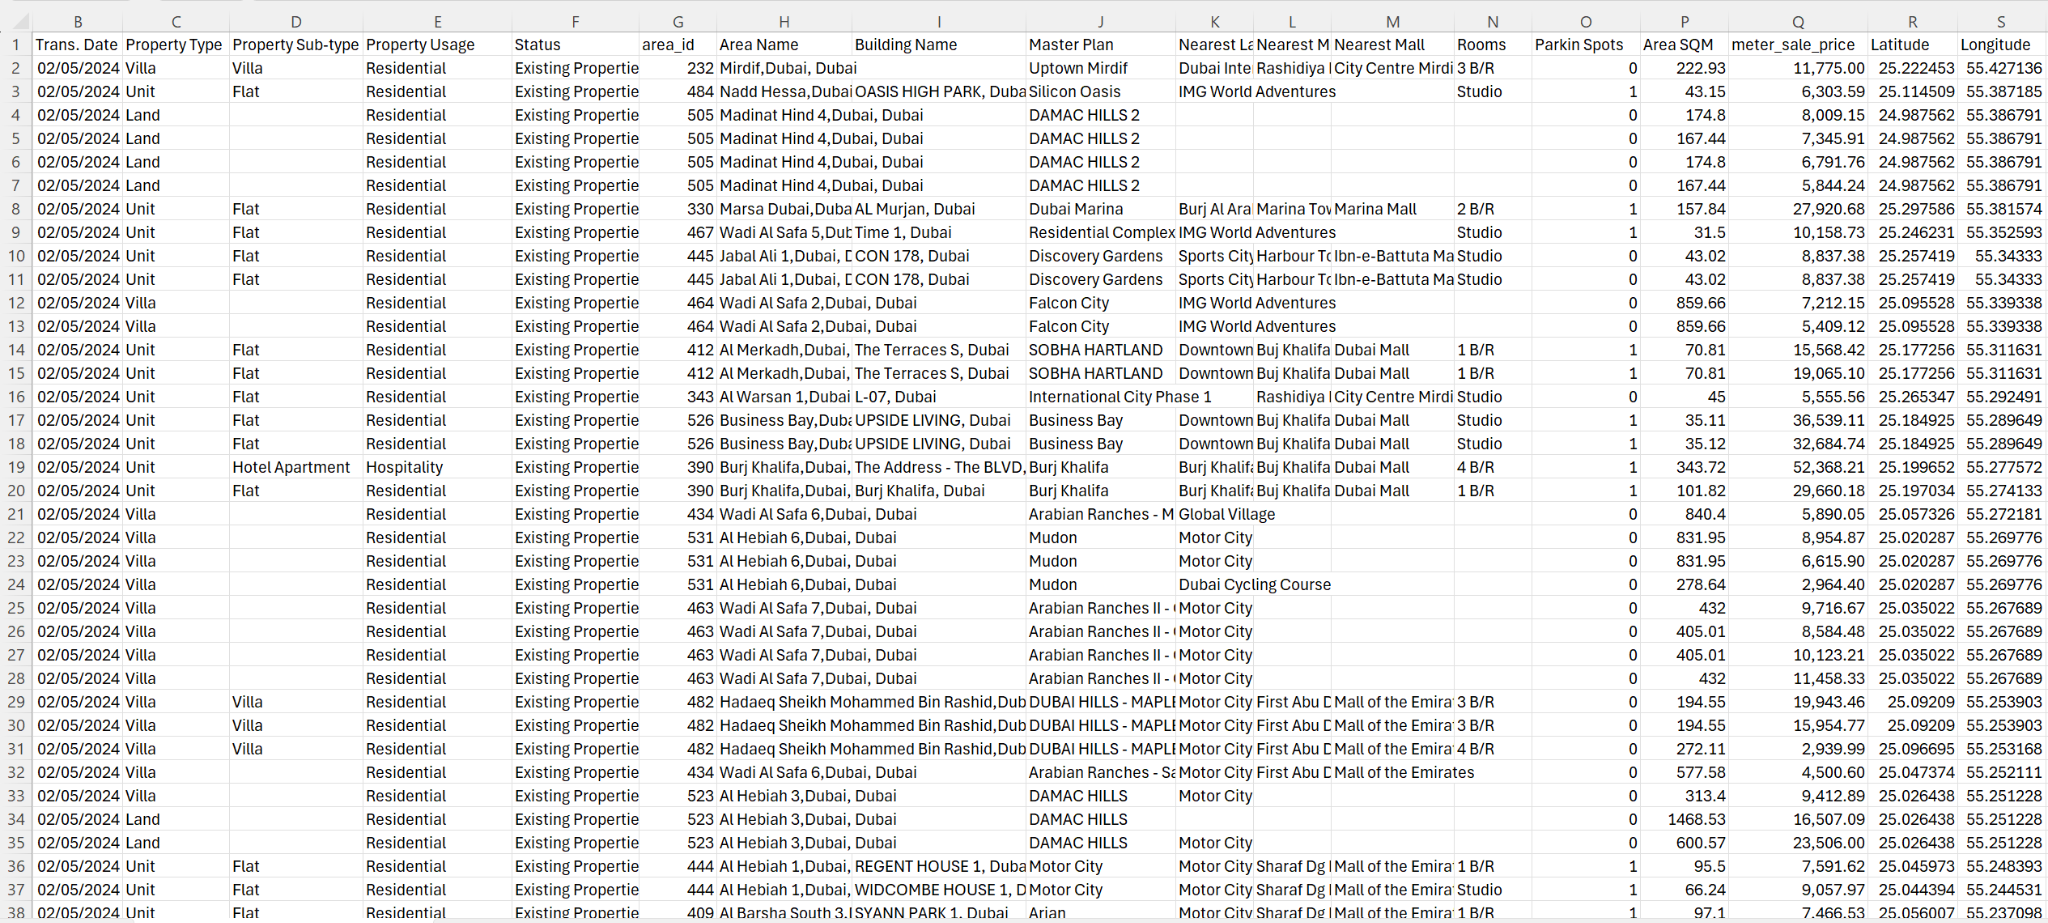
DATA SET
This dataset is provided by Dubai Land Department website https://dubailand.gov.ae/en/open-data/real-estate-data
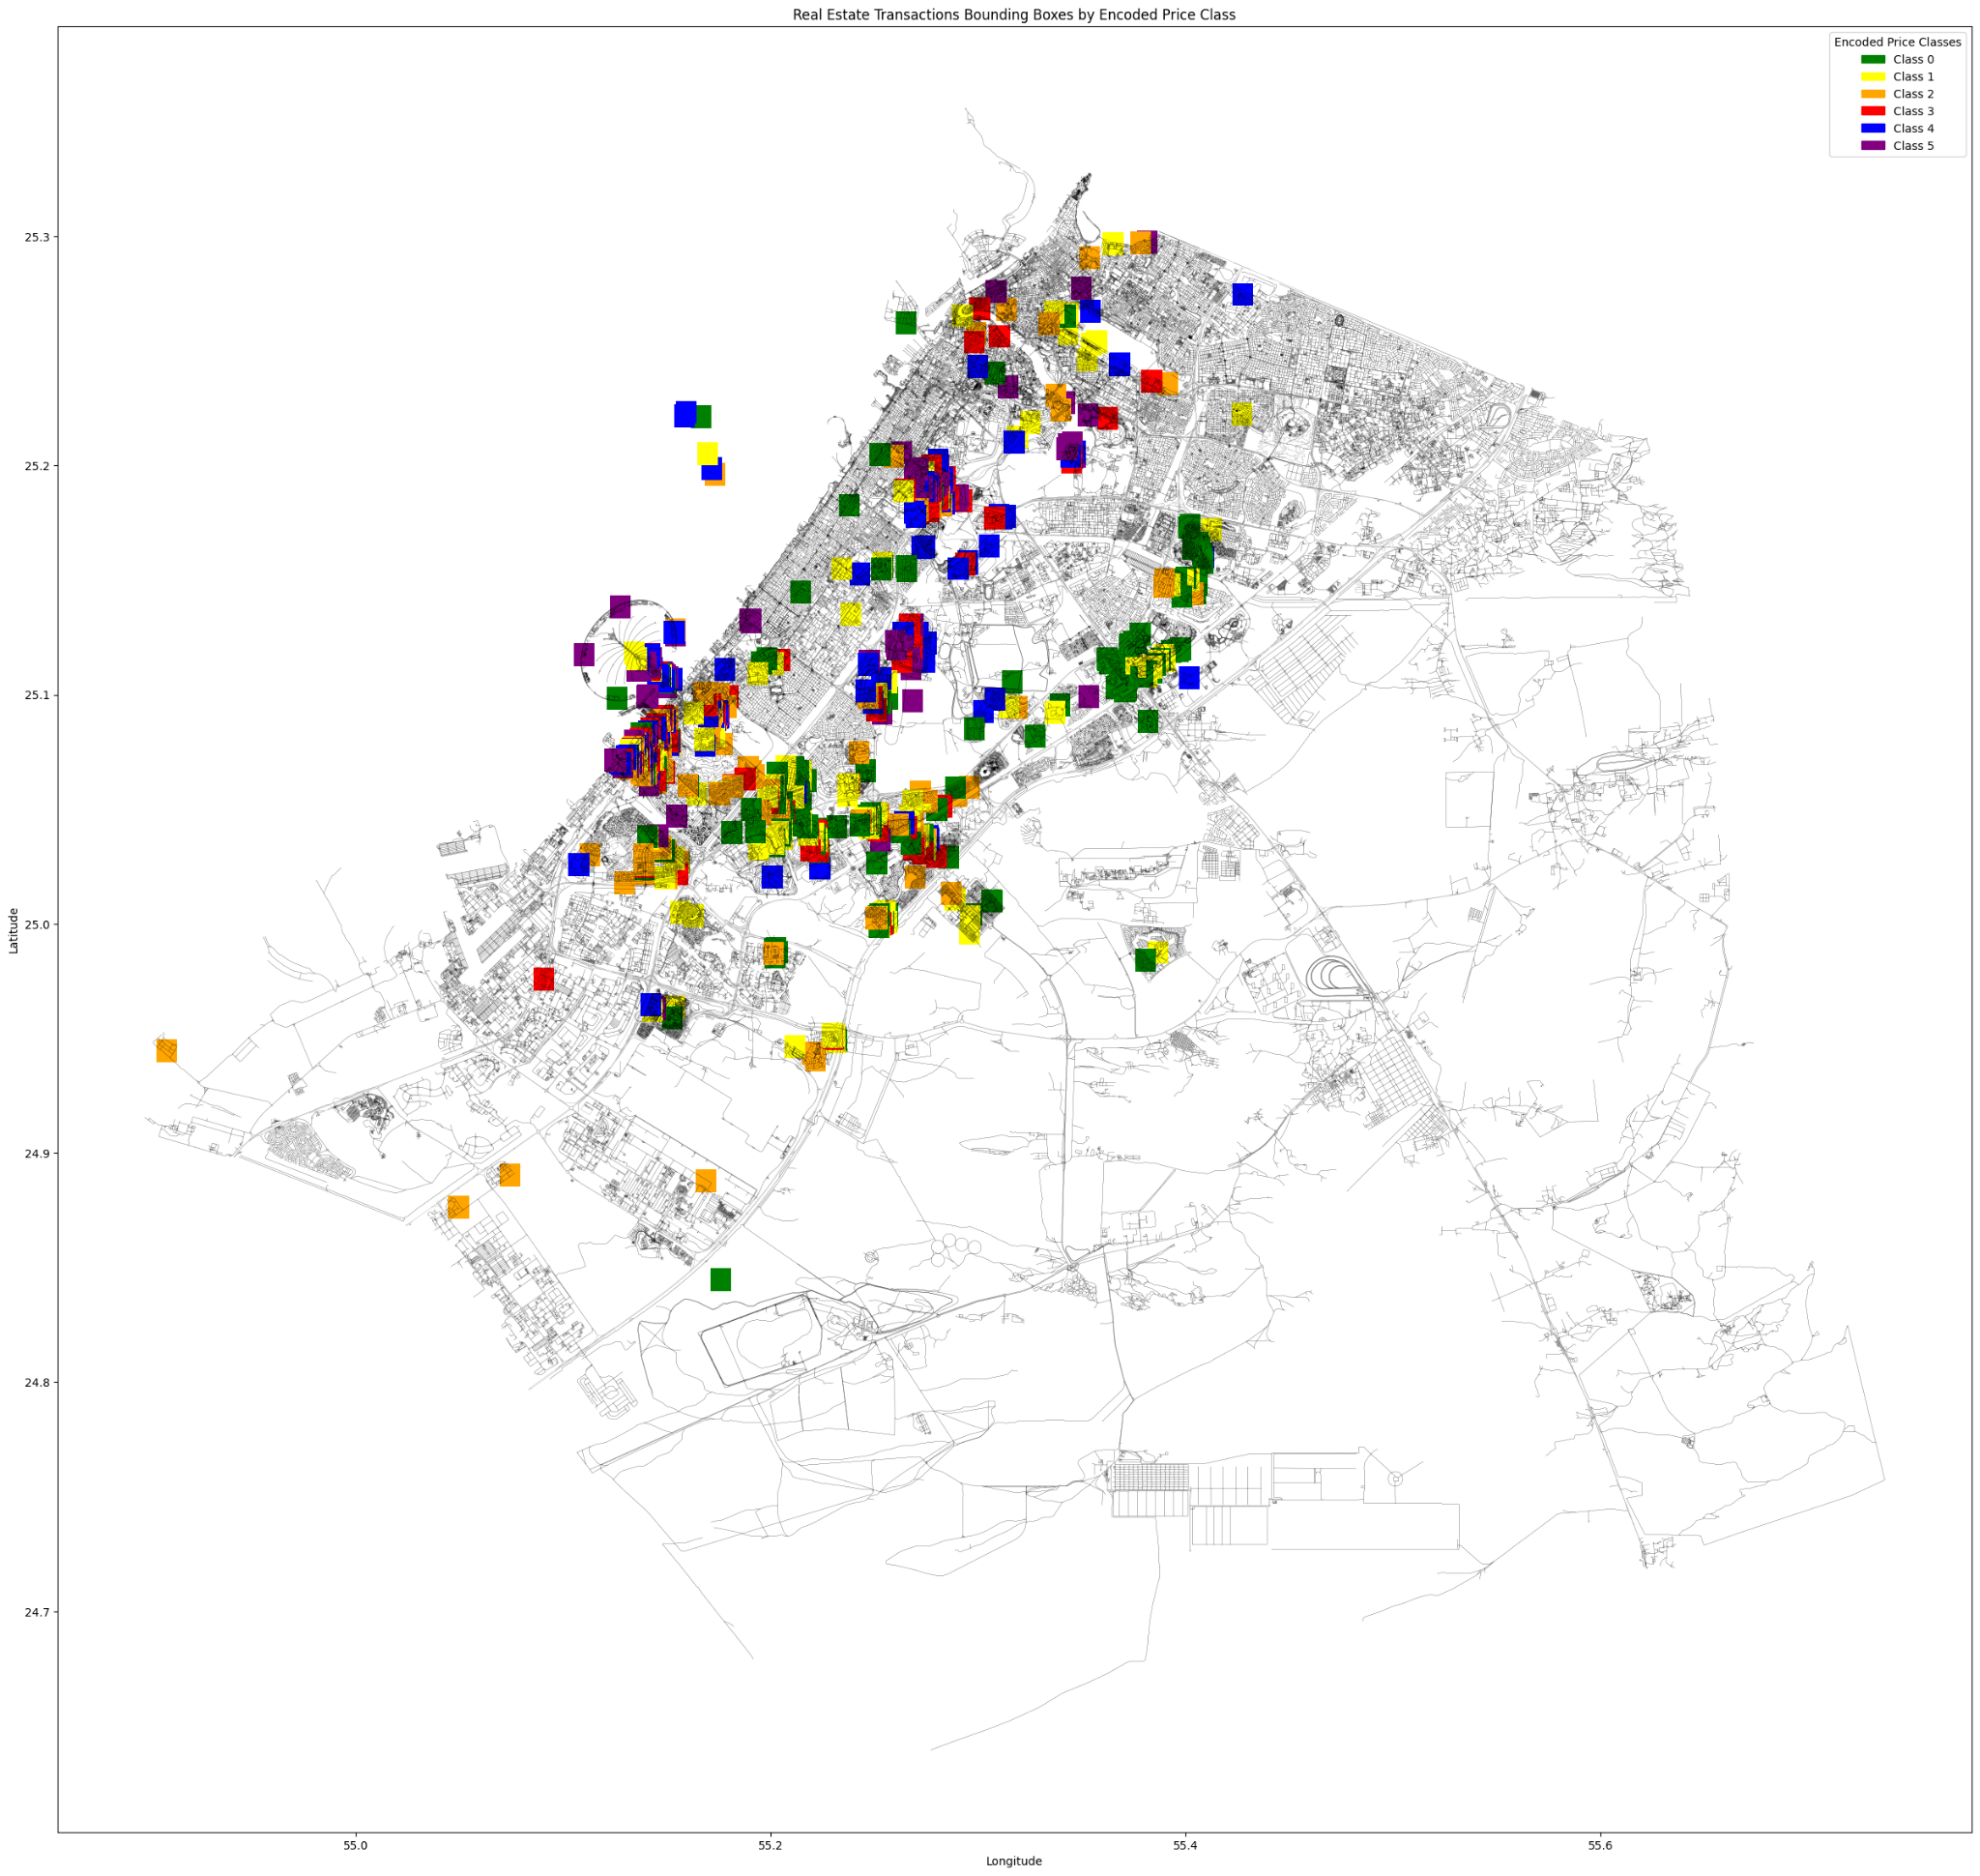
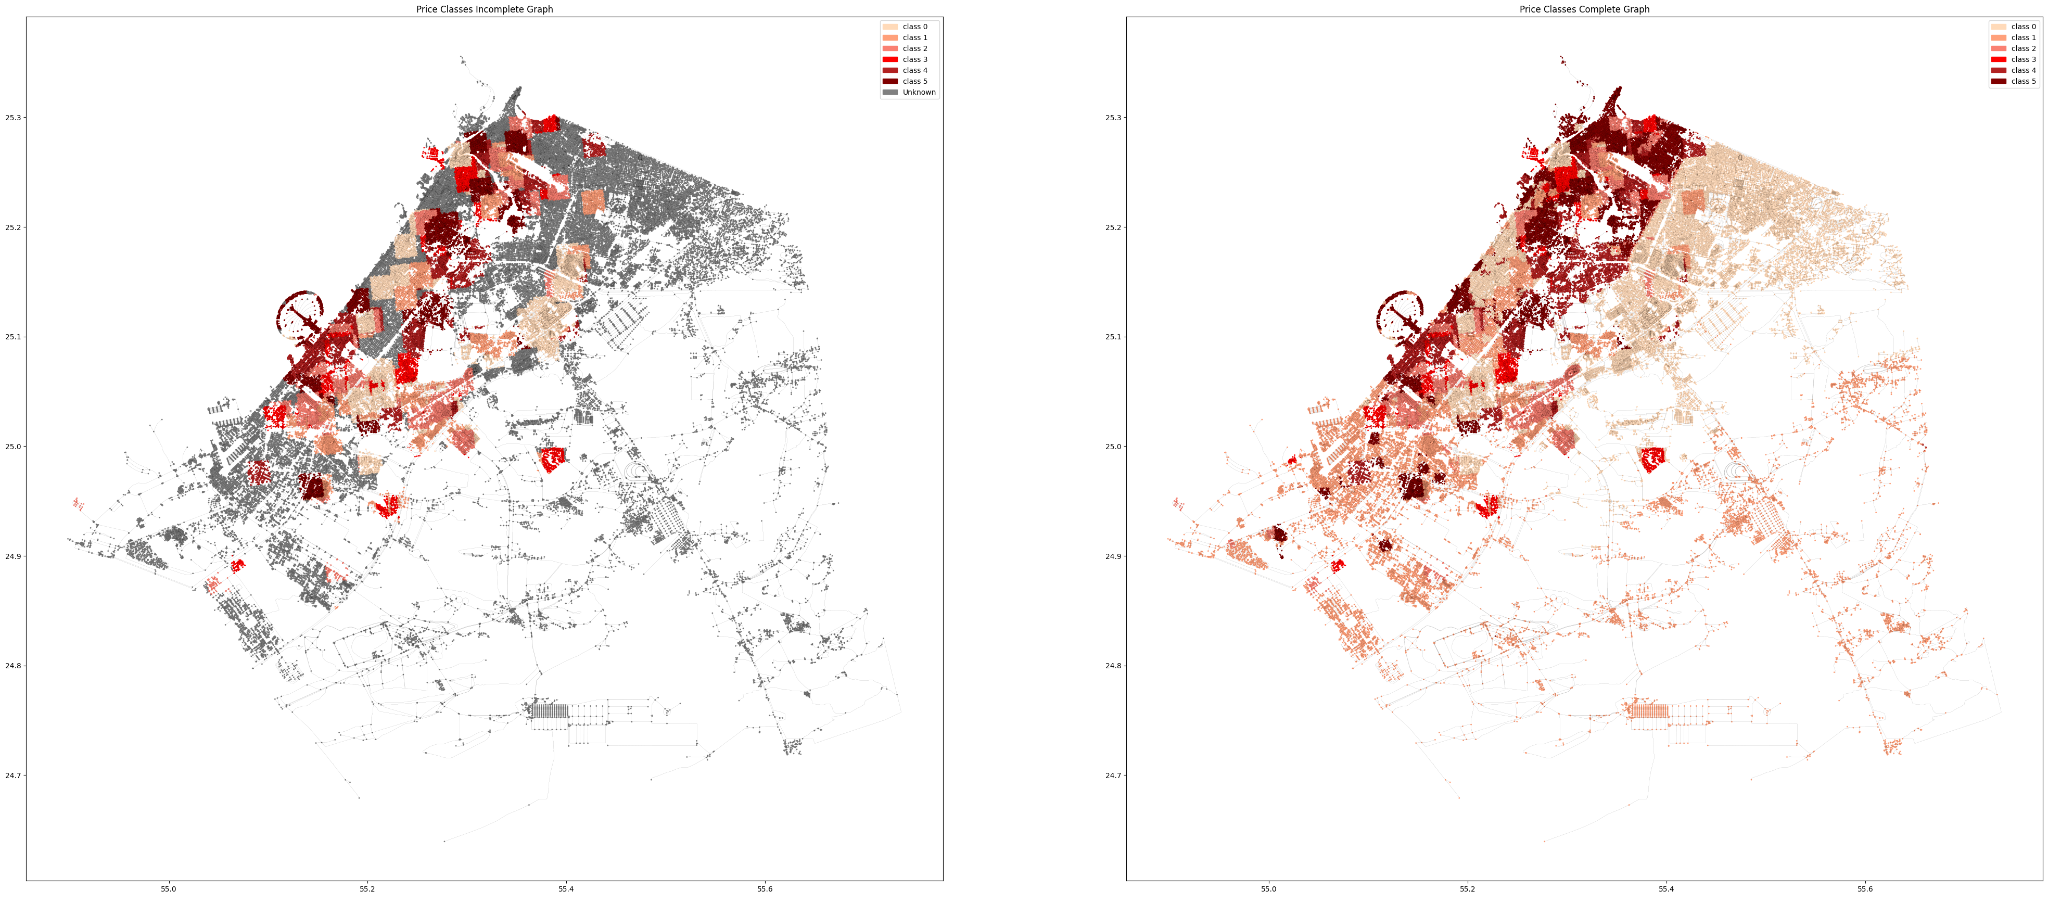
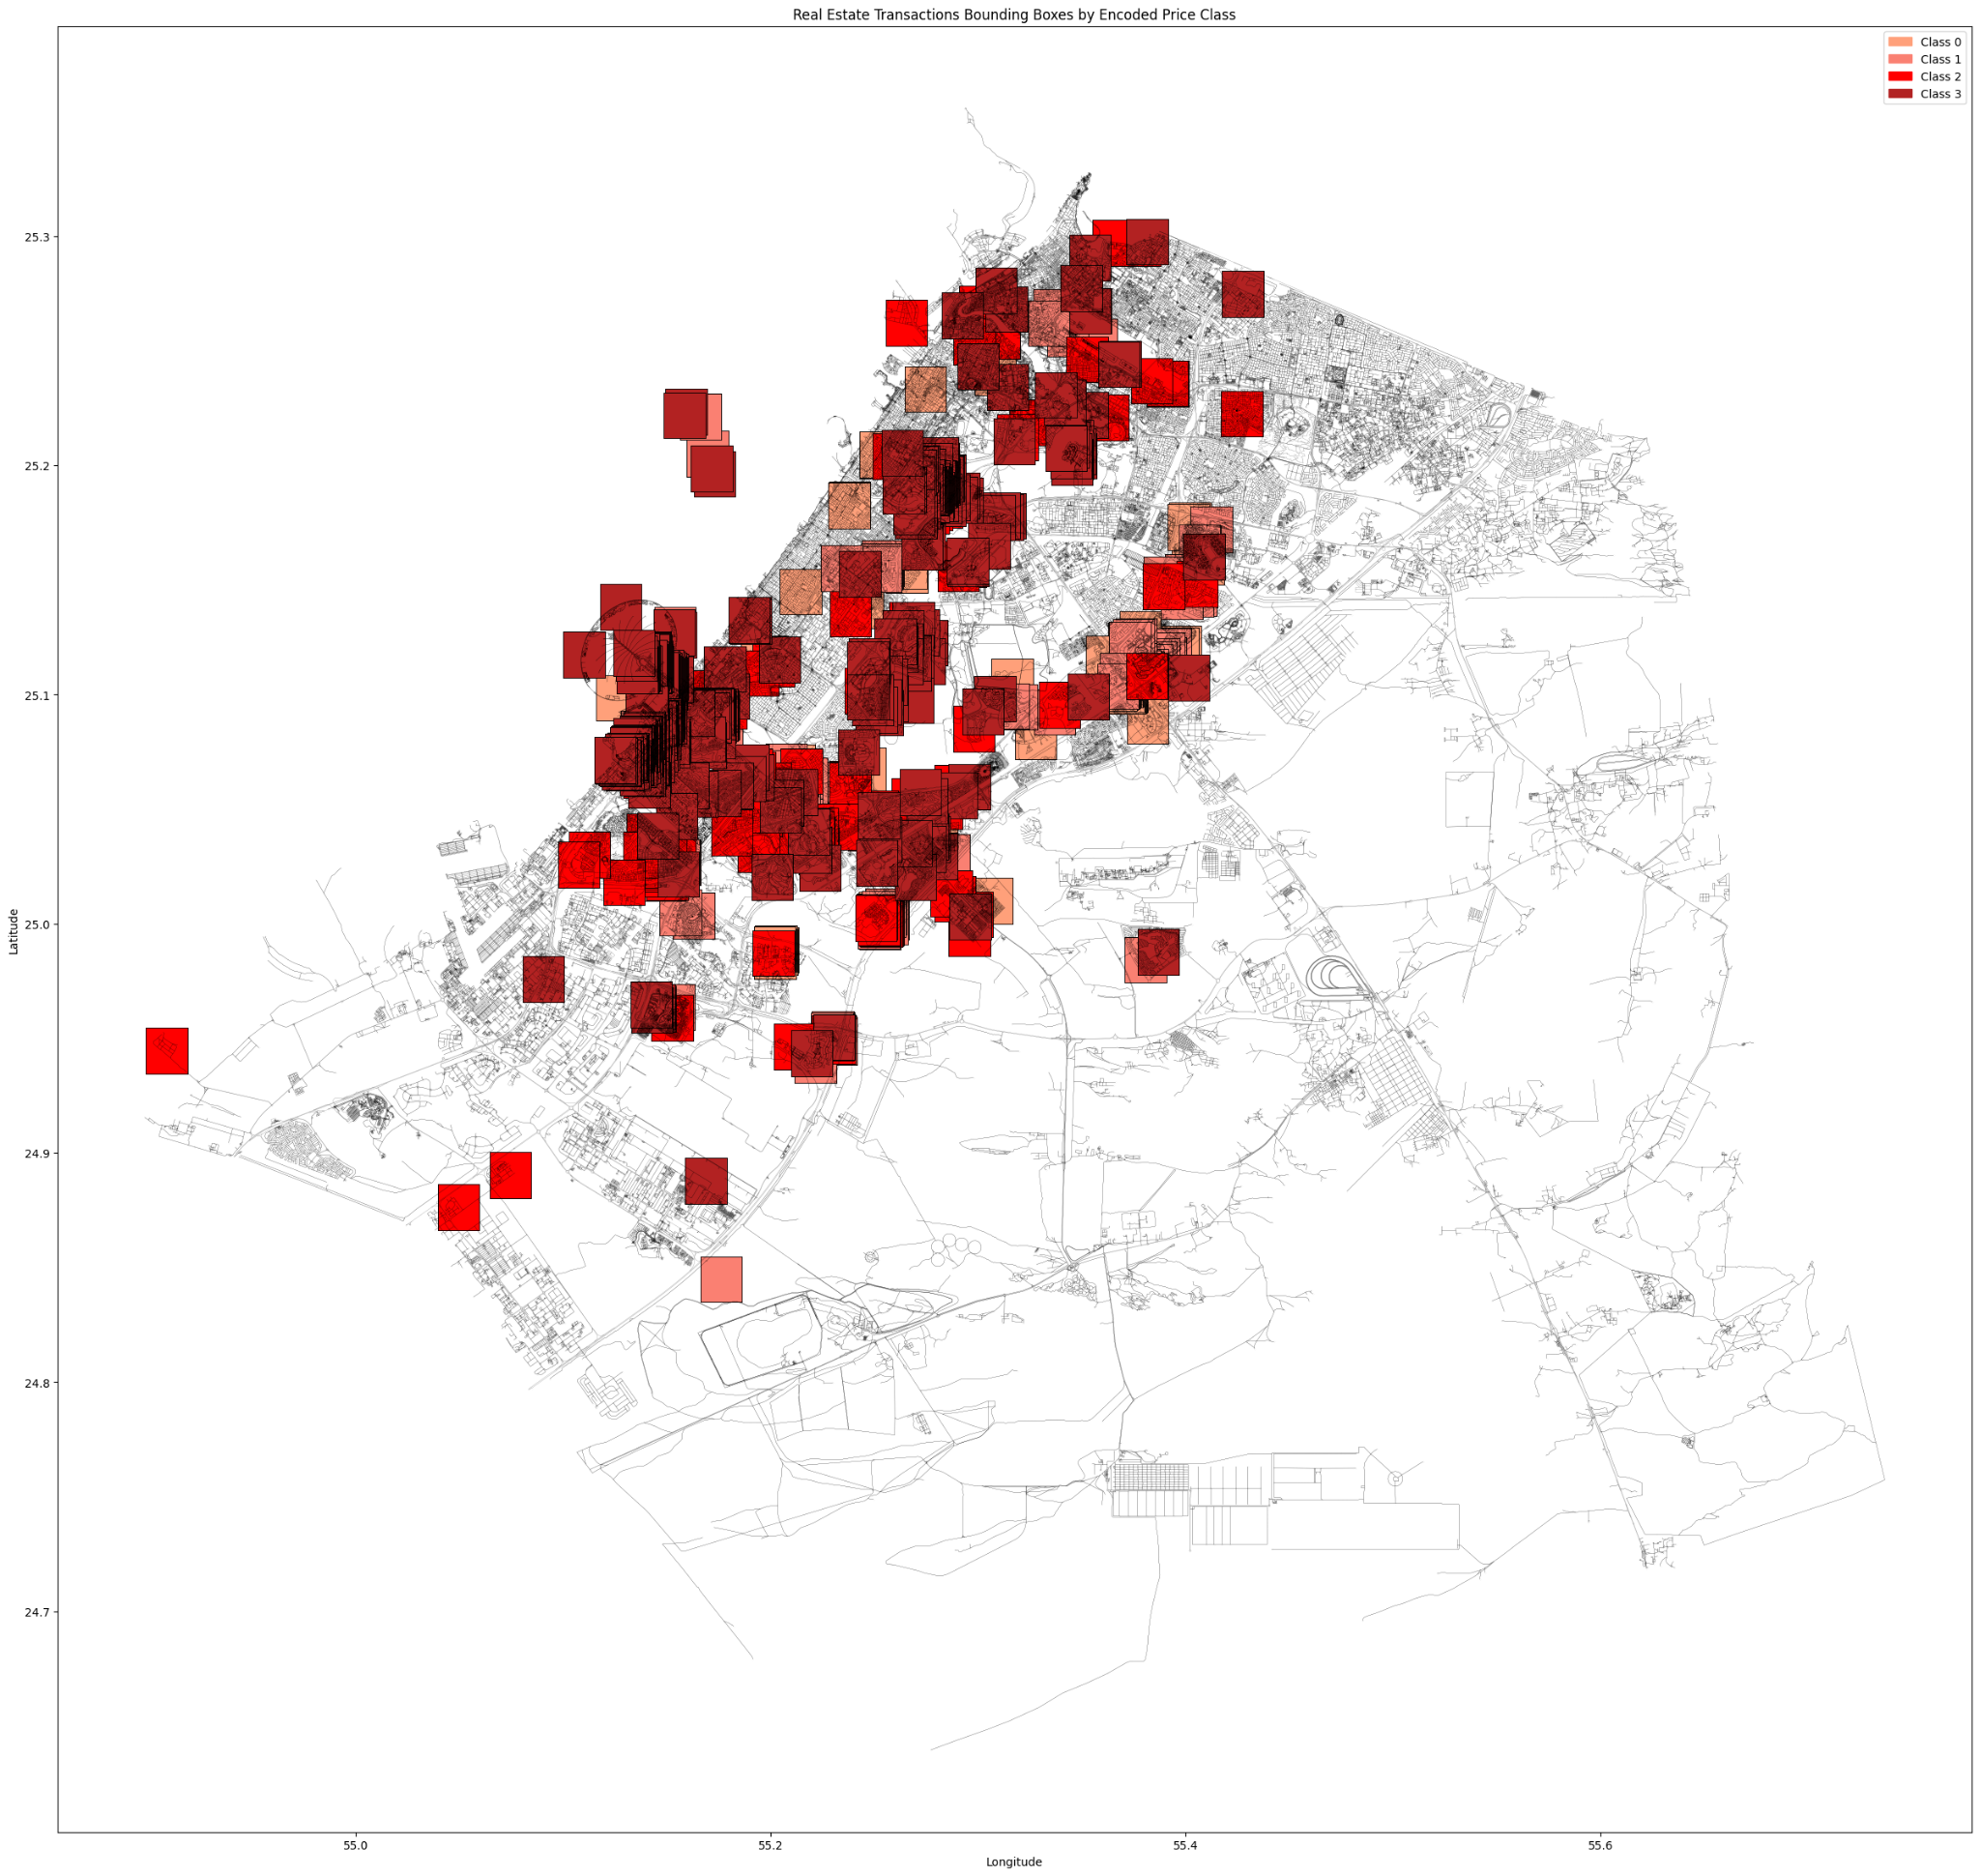
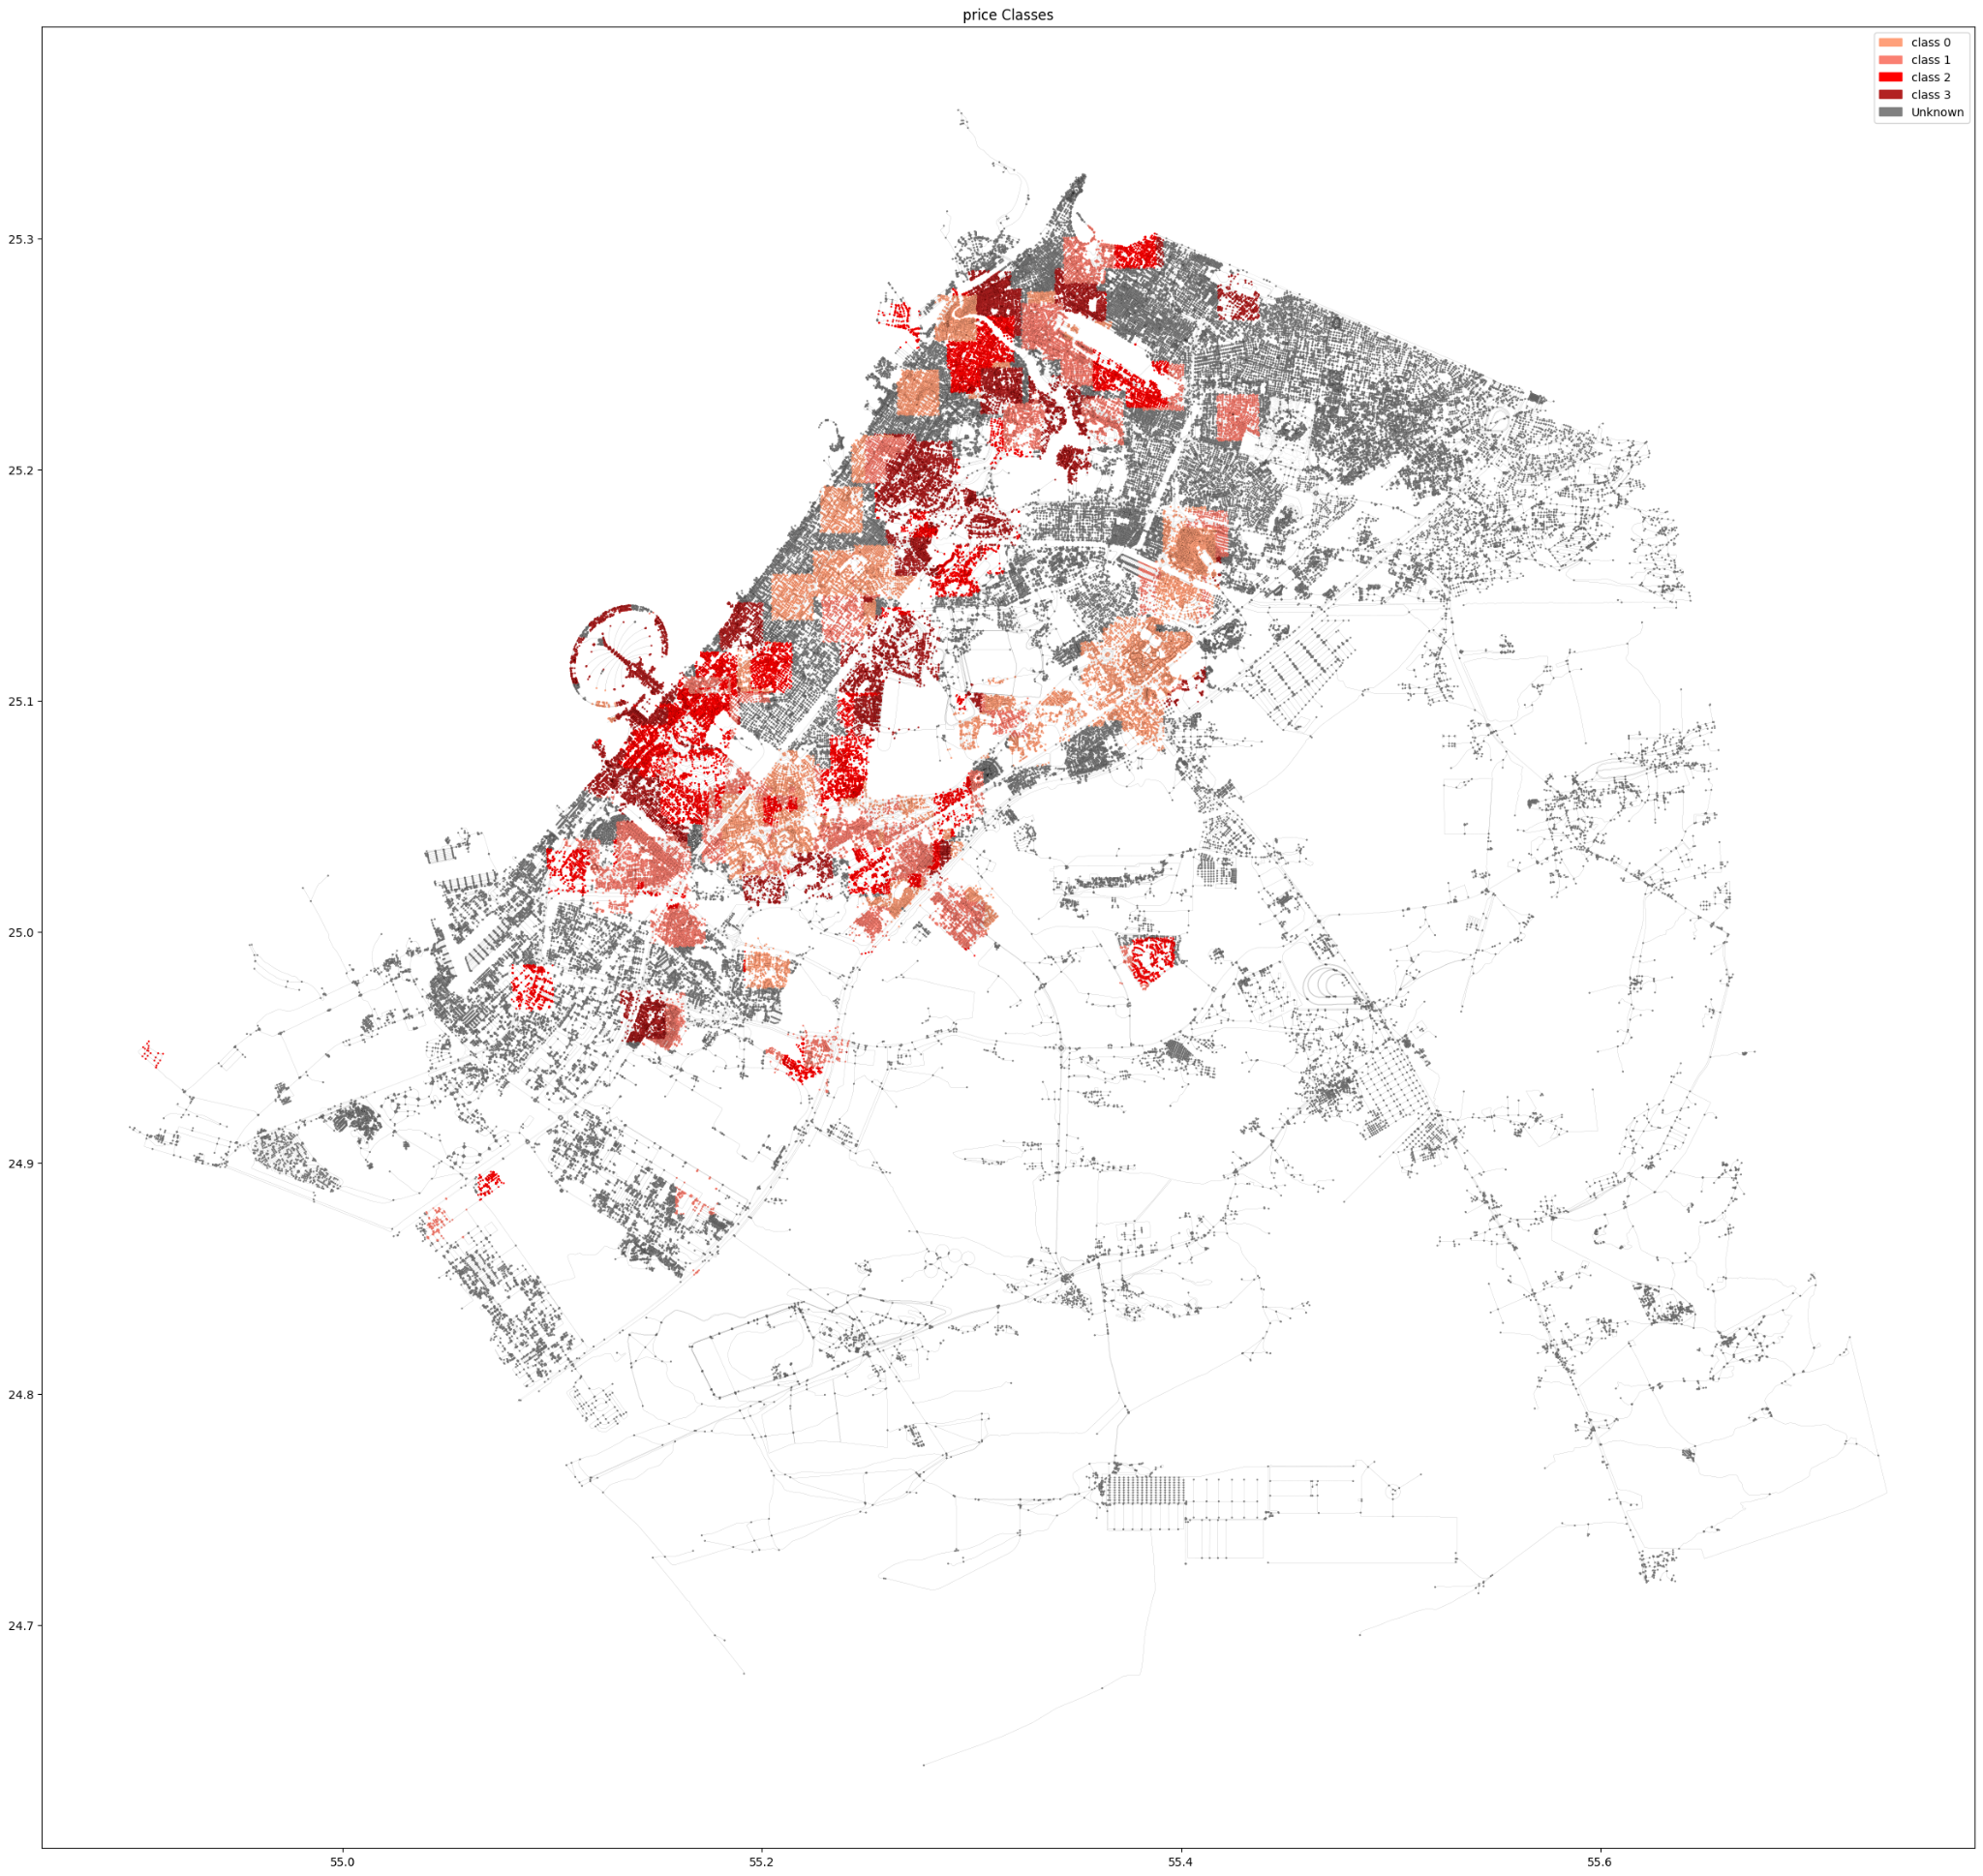
6 CLASSES
Similar to the amenities graph, we start by creating inclusion bounding boxes based on the encoded price classification with a radius of 1km.
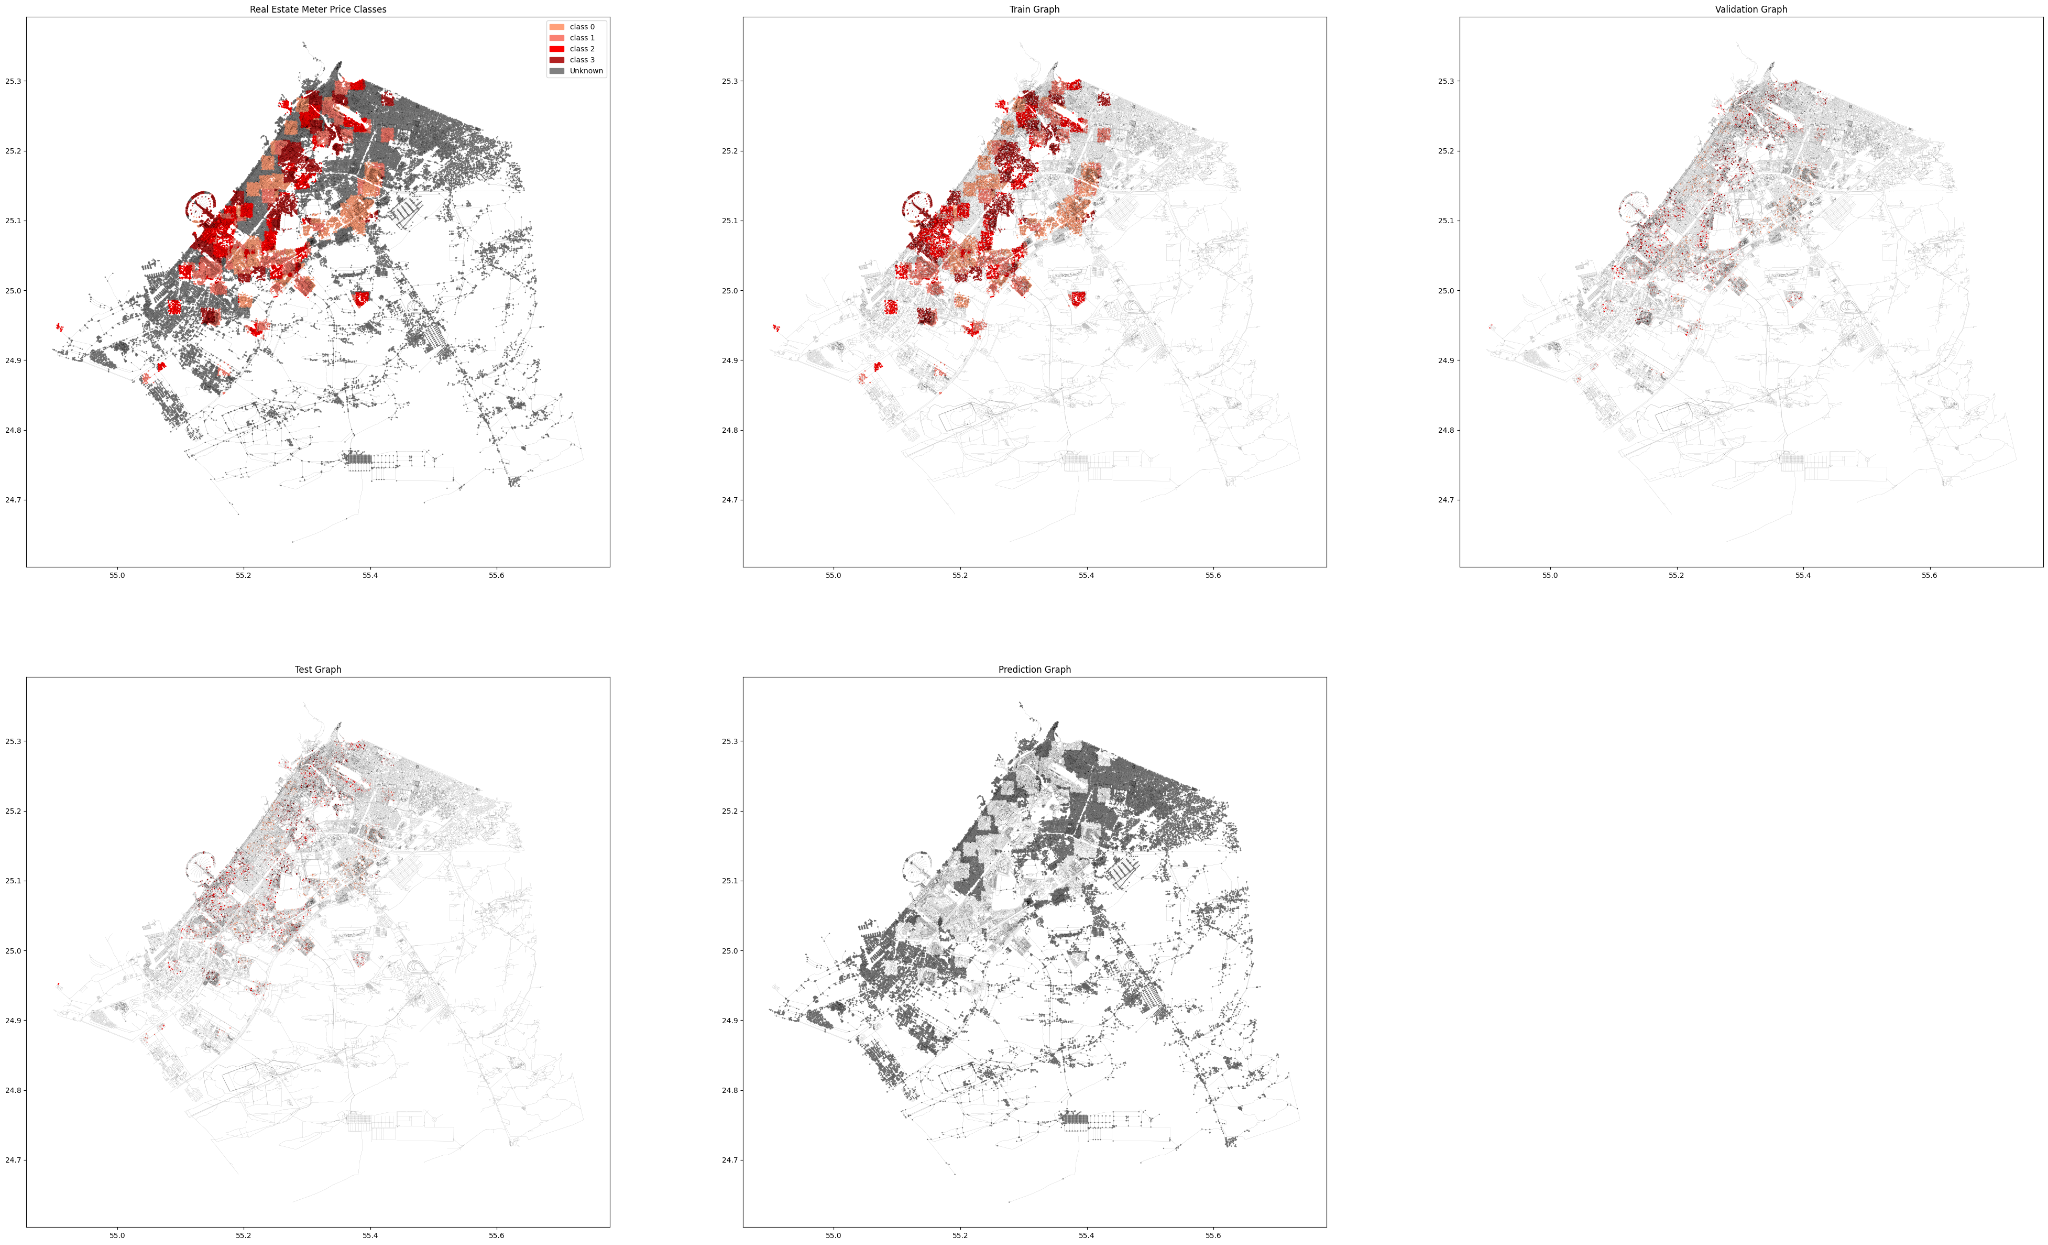
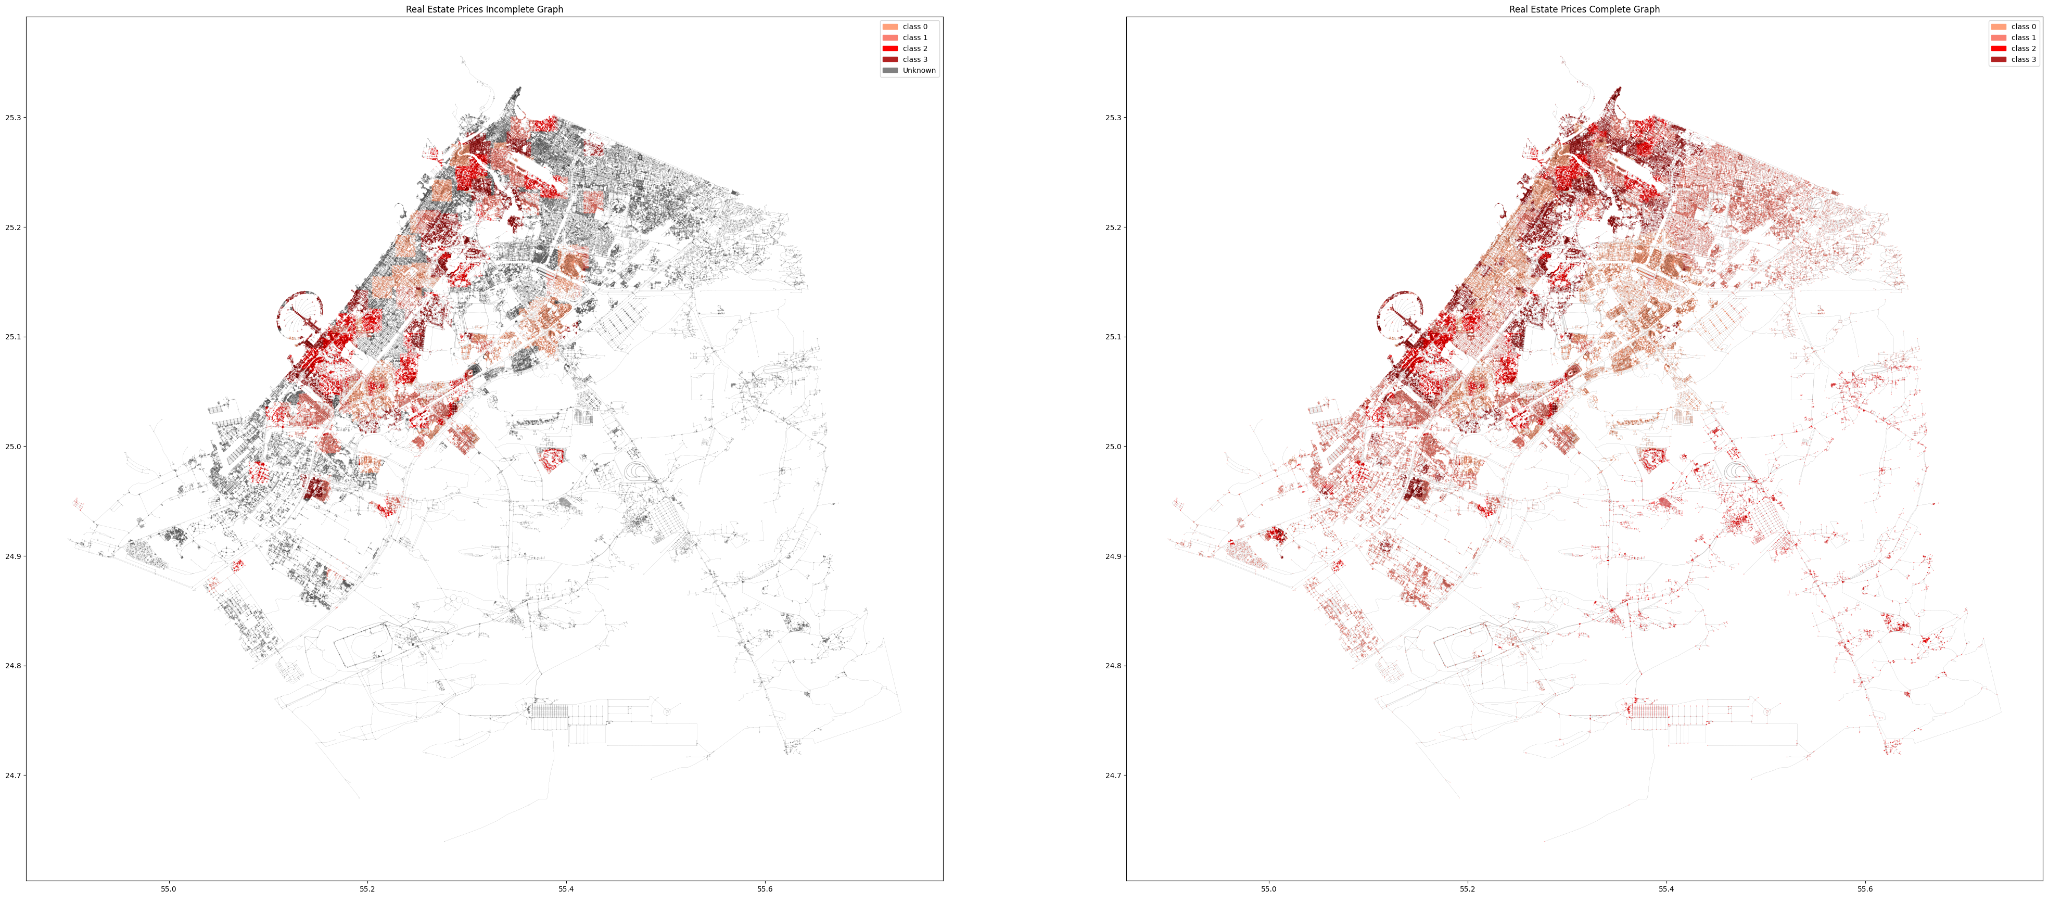
After classifying our data, we start by preparing our graph for GNN training. We split our data into Test-Train-Validate and Predict sets and we divide it into labeled vs unlabeled.
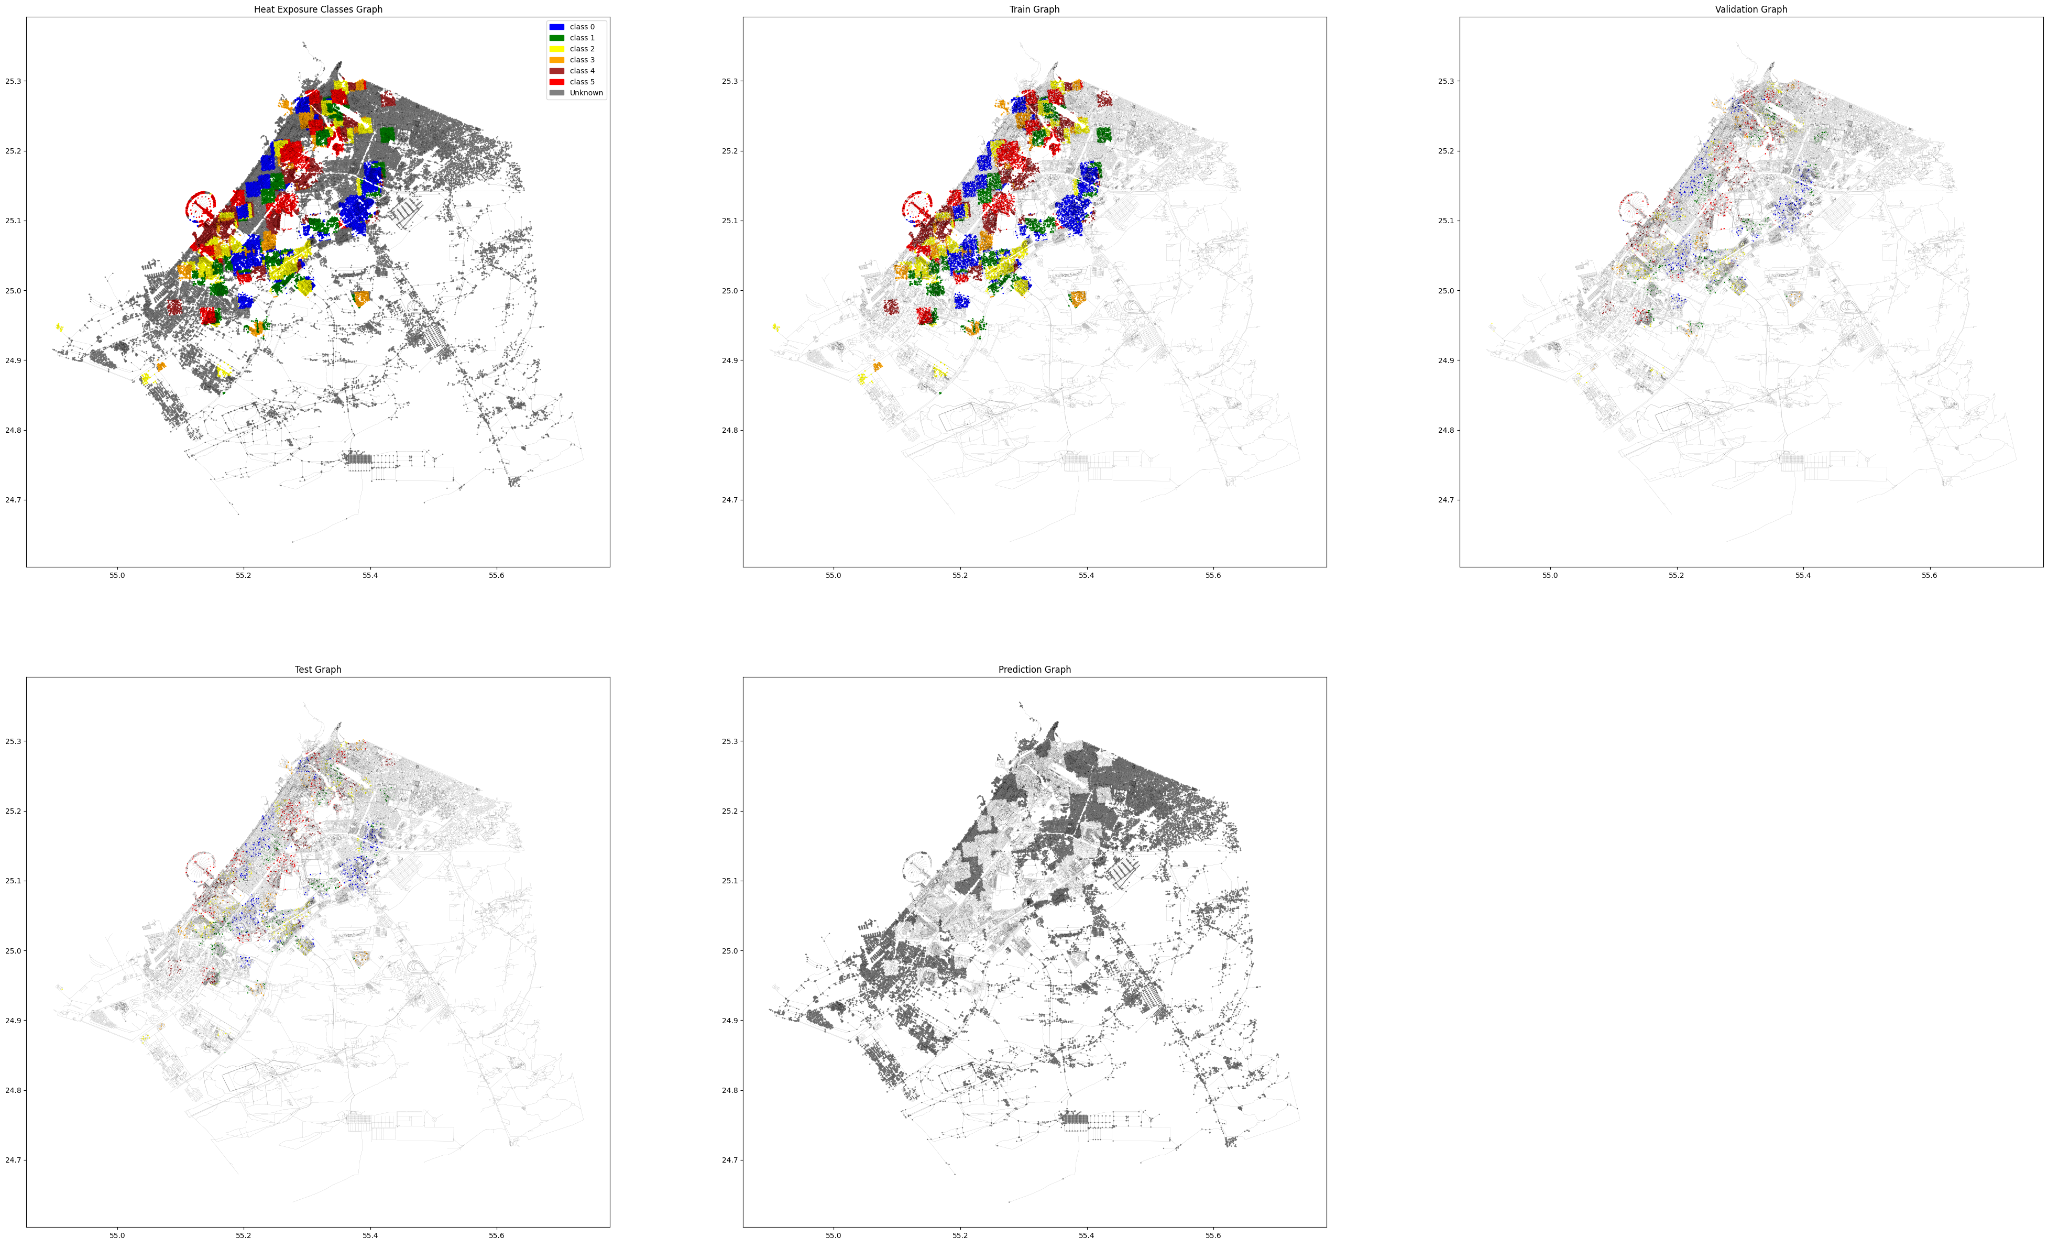
Finally, the complete graph with all the predicted classes.
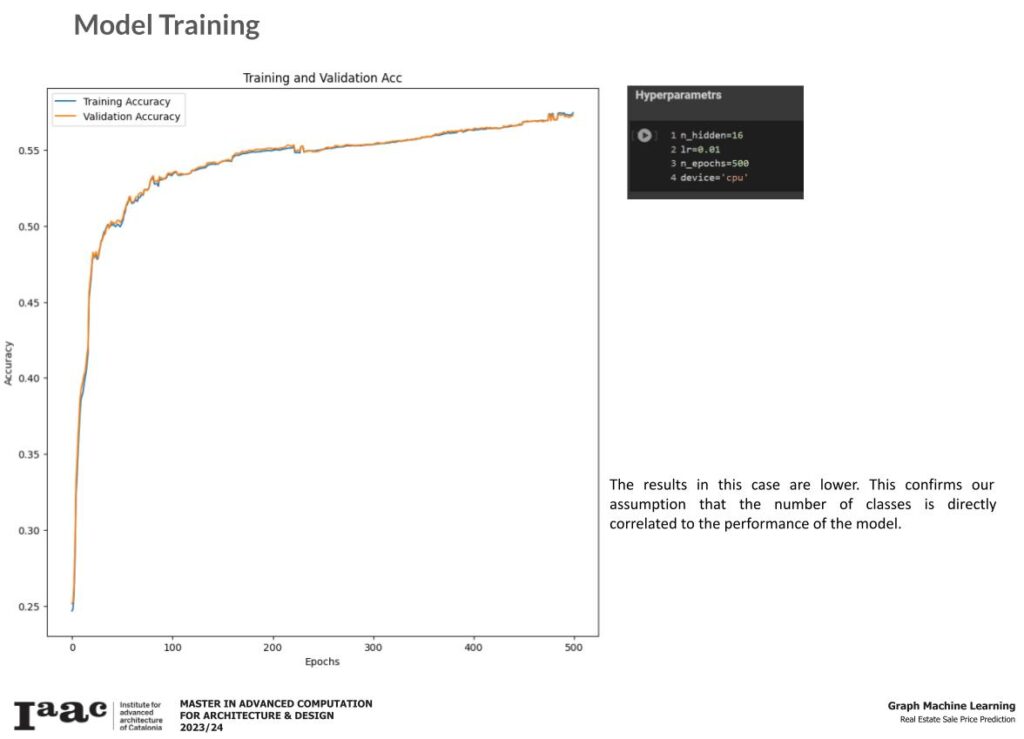
As expected, the model is unable to accurately generalize the prediction and it is evident from the above graphs.
2 CLASSES
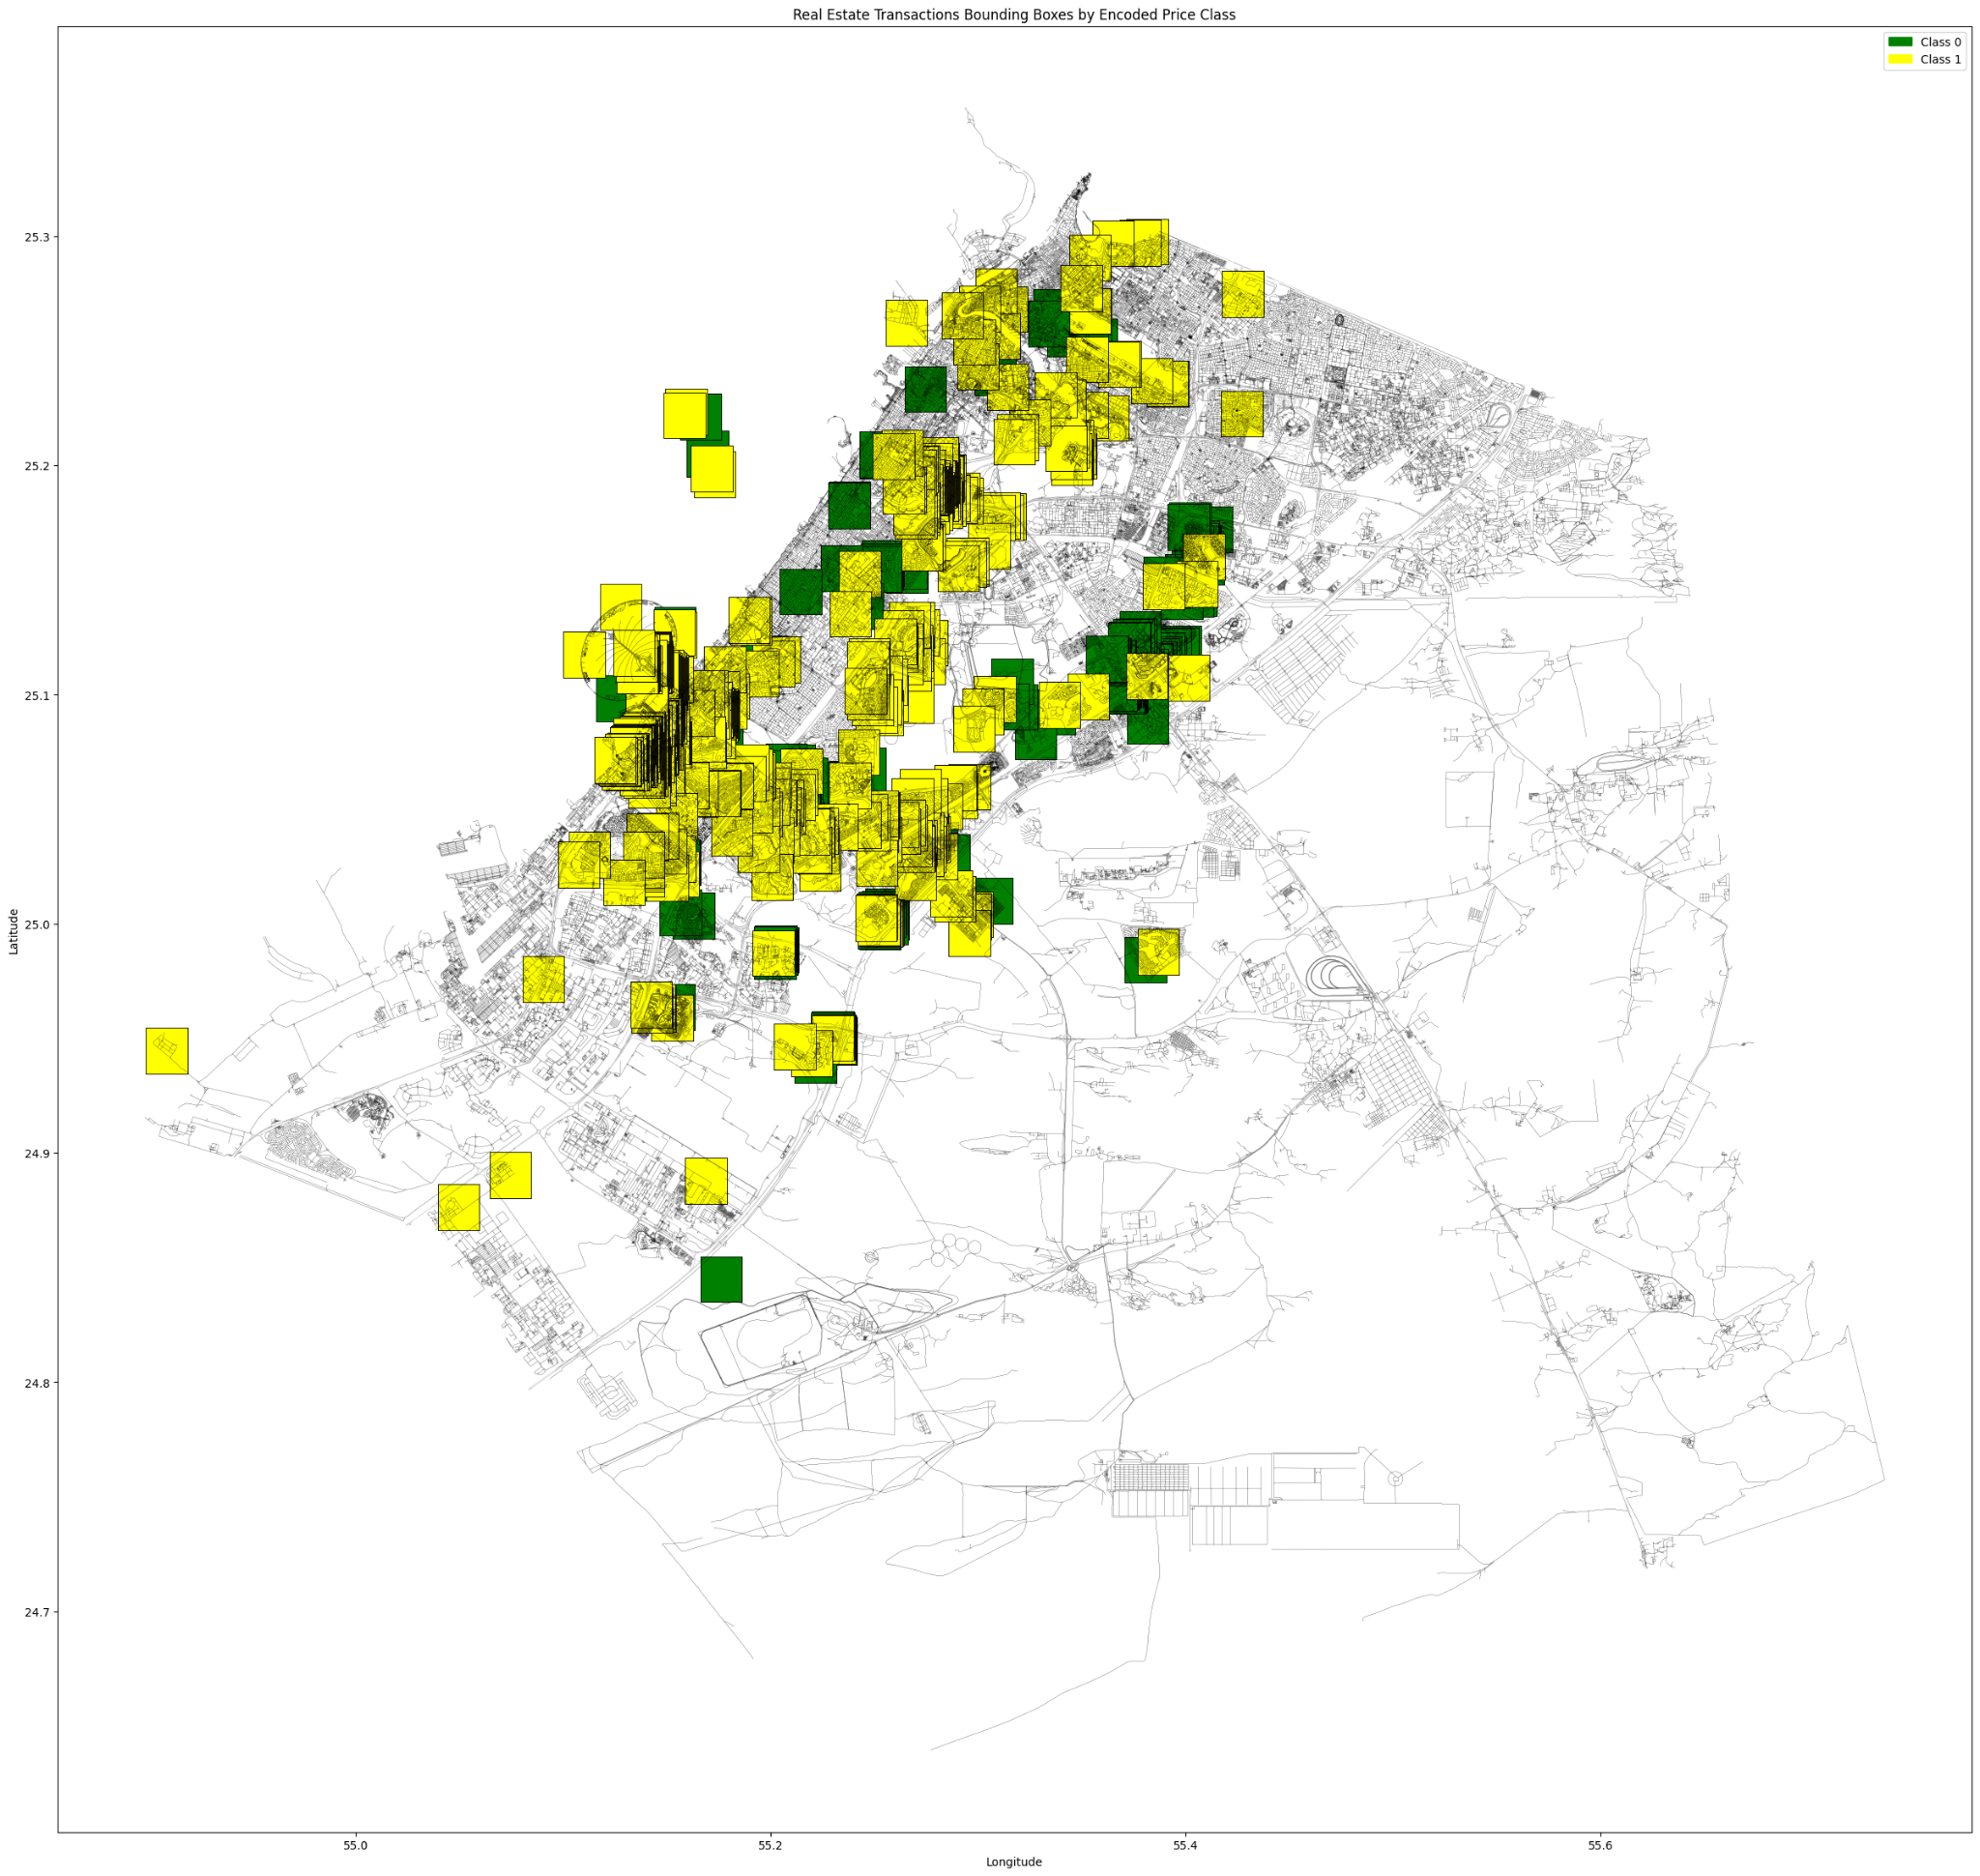
For this attempt, we proceed with the 2km radius since it already produced a better outcome in our six classes trail. Prices here a classified into two classes; 0 and 1
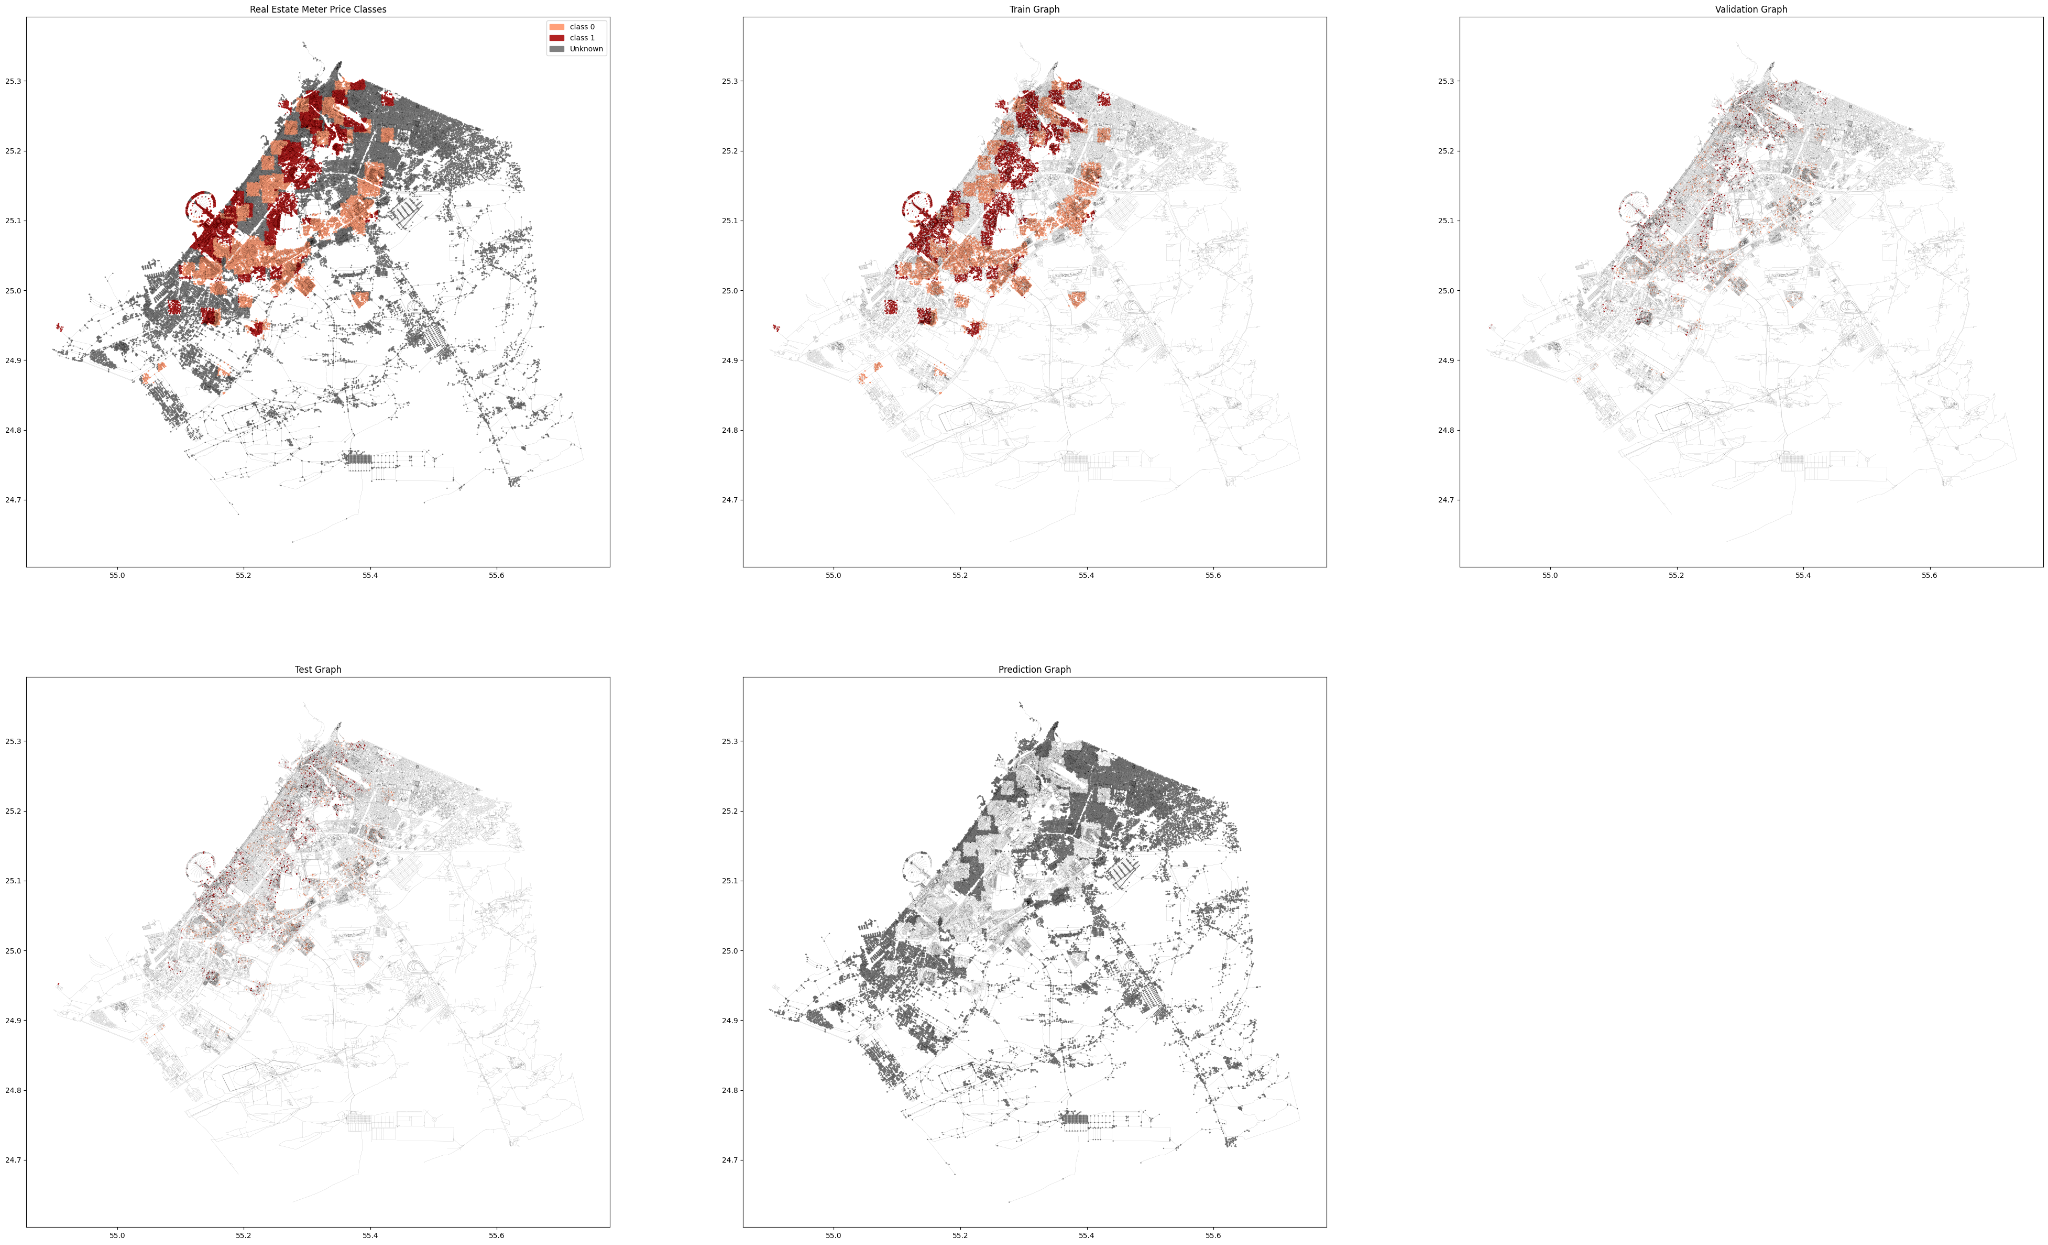
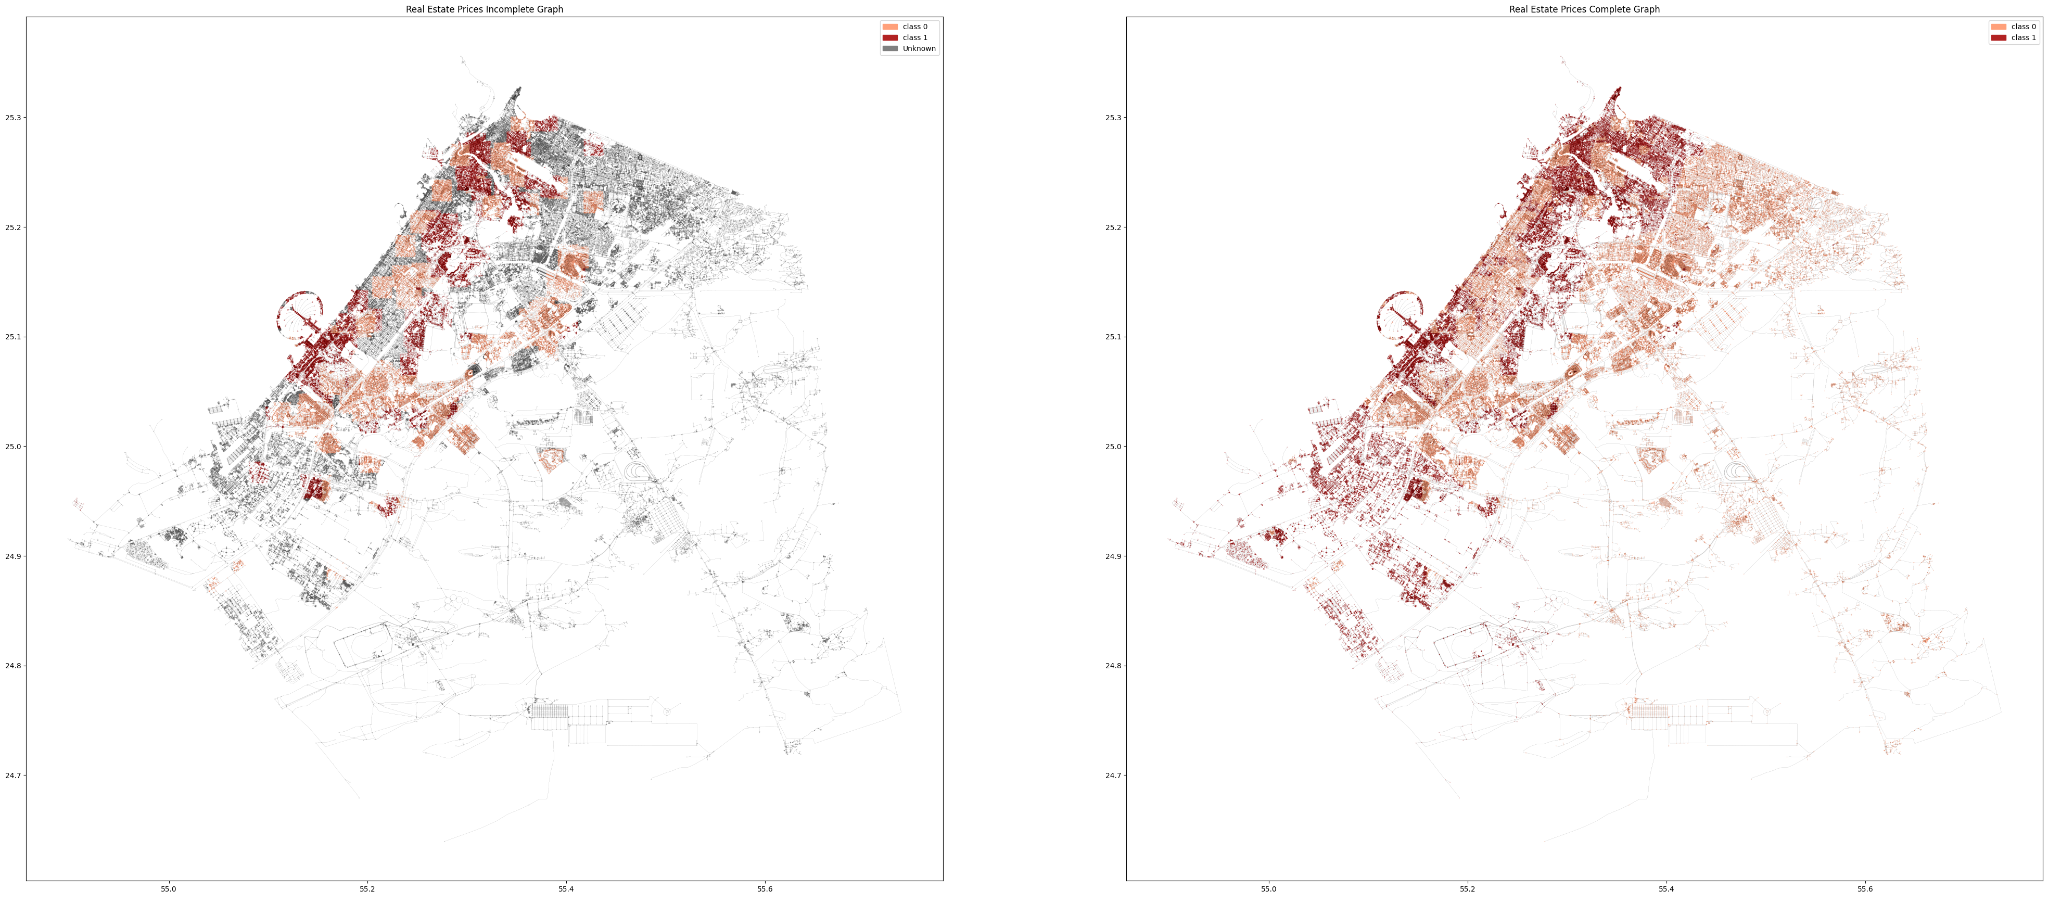
Similar to our first attempt, we split our data into Test-Train-Validate and Predict sets and we divide it into labeled vs unlabeled.
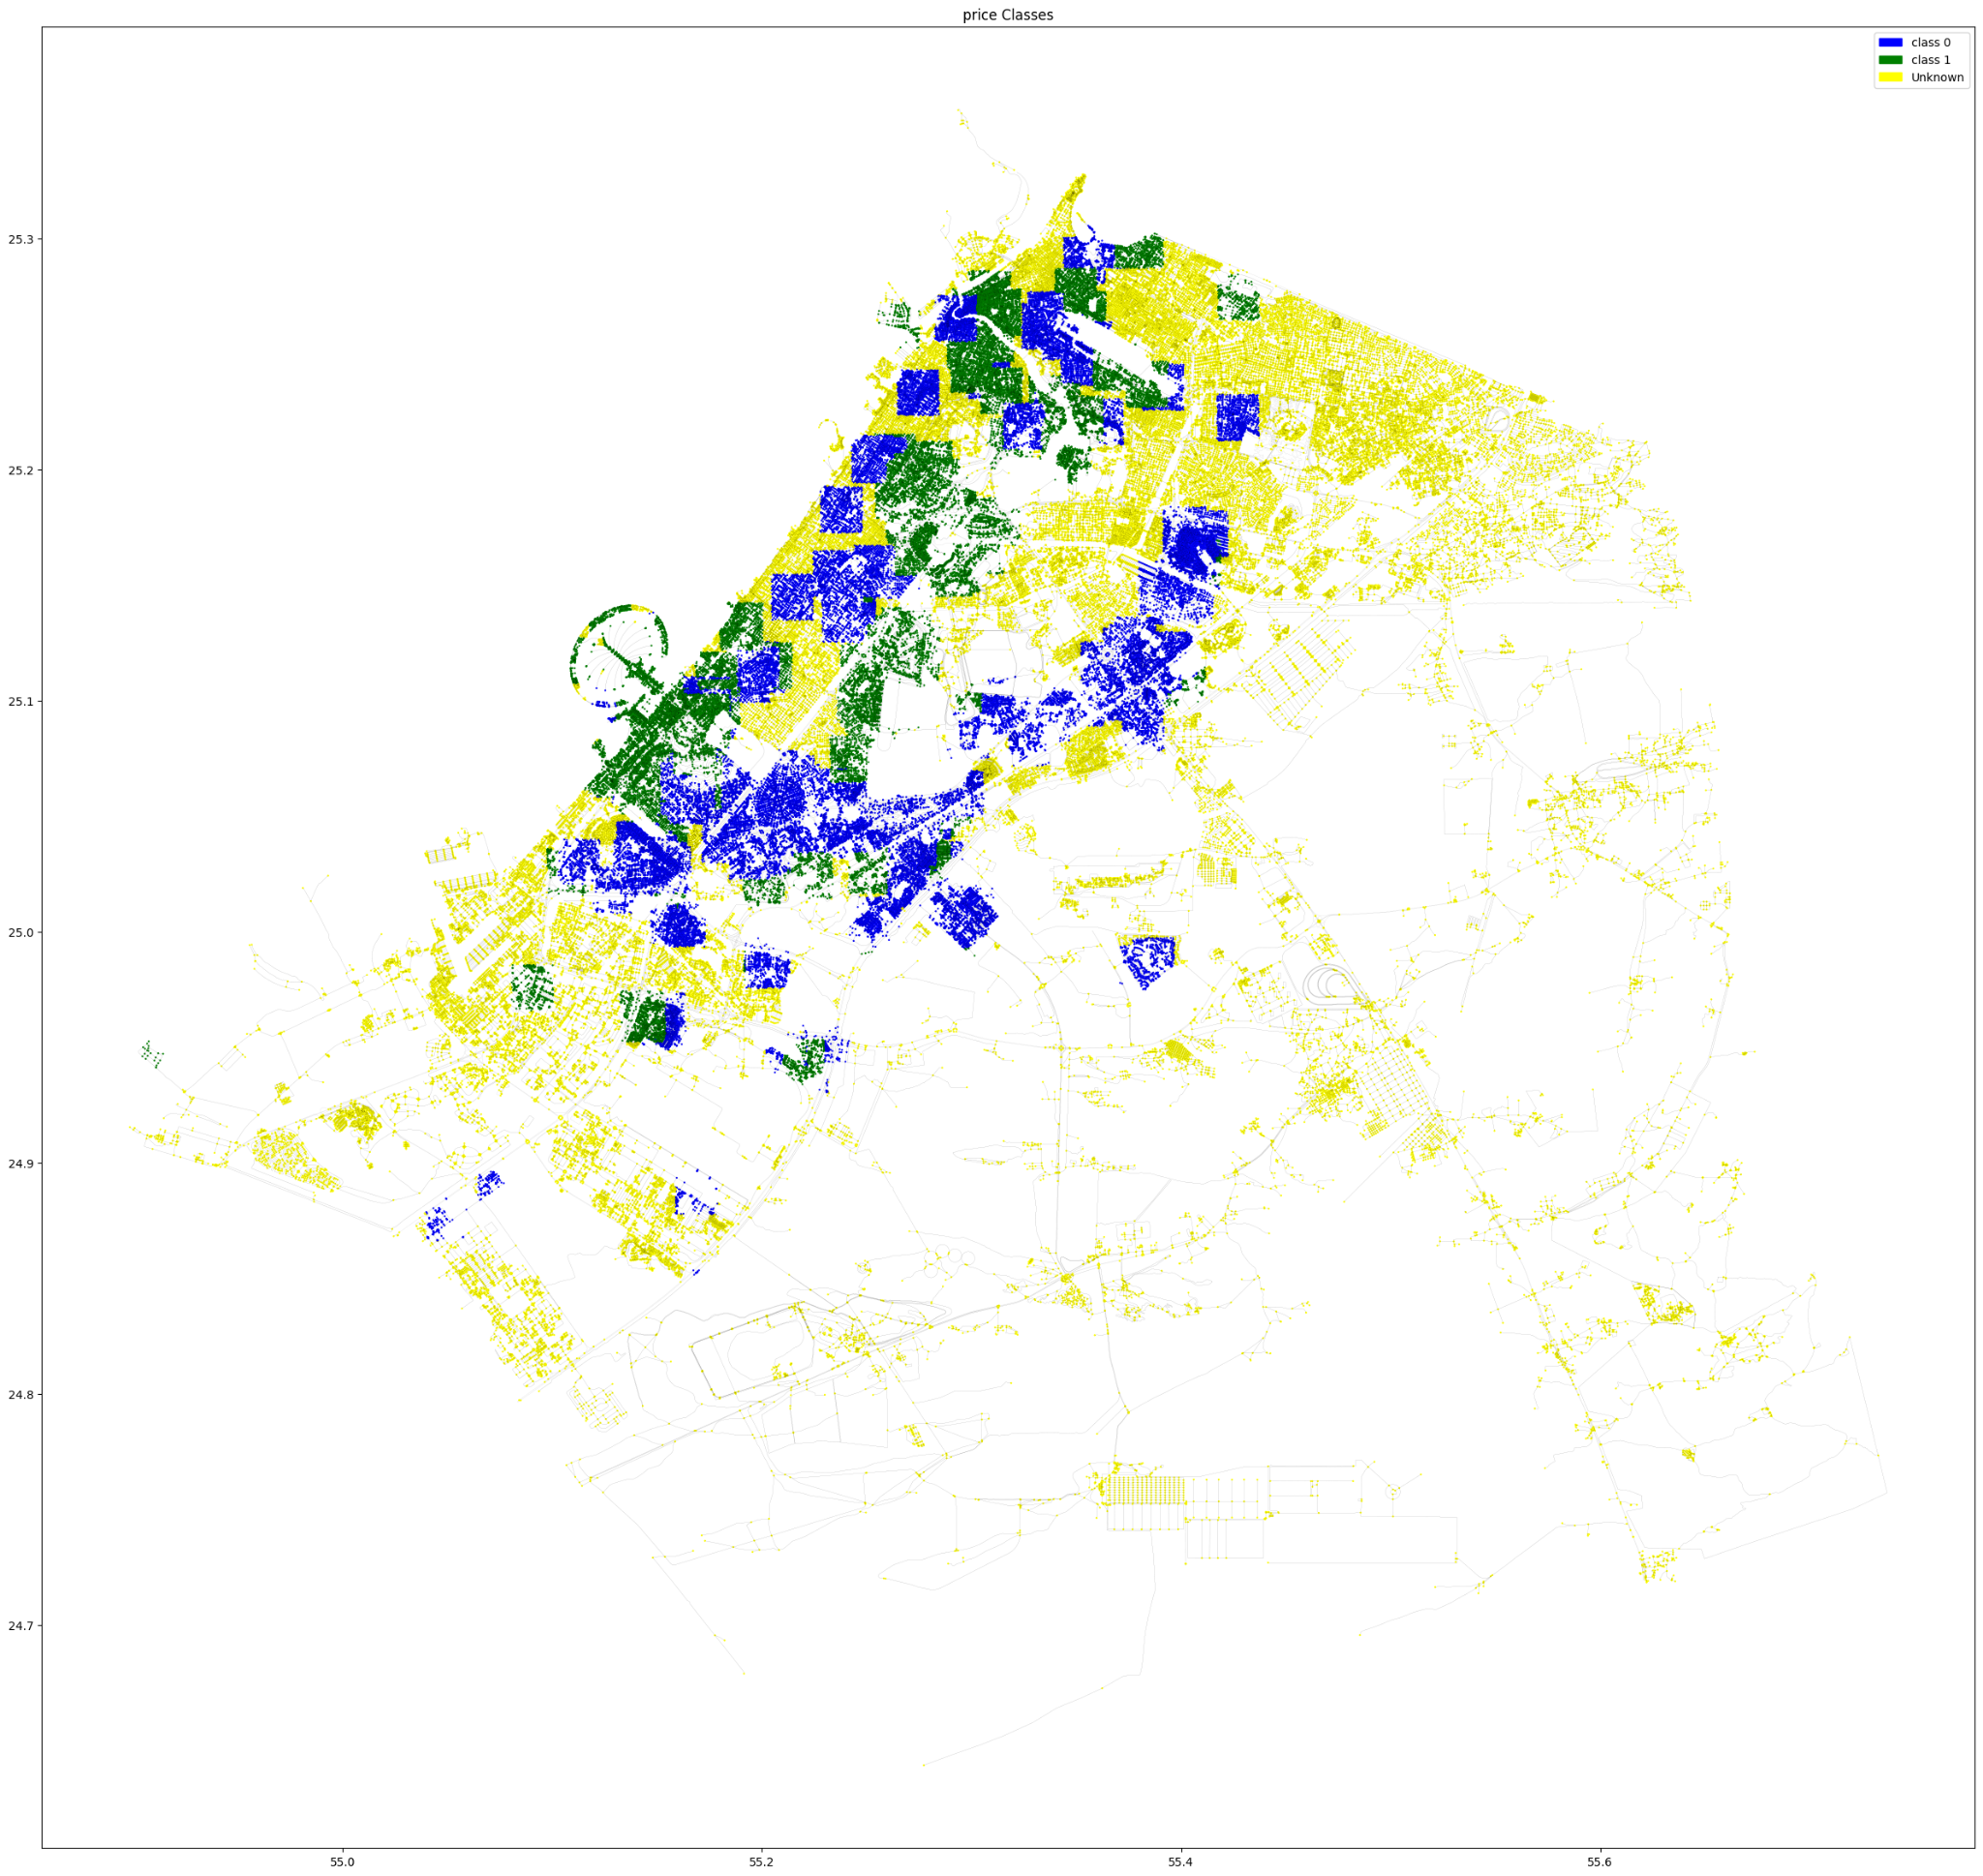
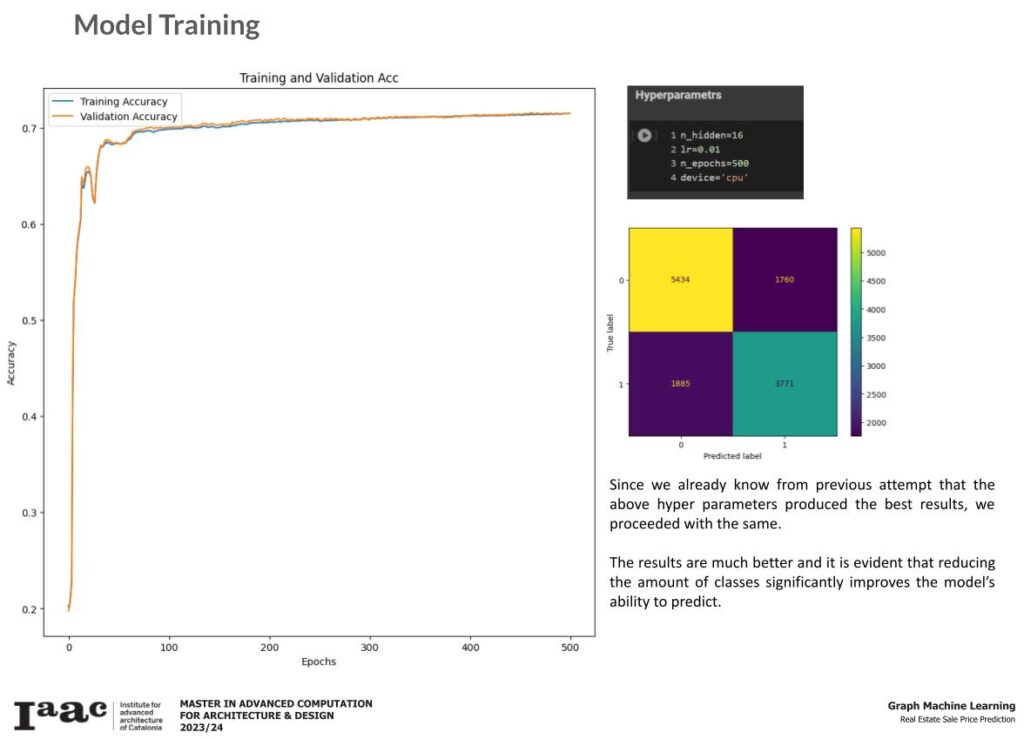
Finally, the complete graph with all the predicted classes.
The Complete graph shows much smoother and well generalized prediction which further proofs that reducing the quantity of classes have direct impact on the model’s performance and the quality of its predictions.
4 CLASSES
Since our attempt with 2 classes yielded good results, we decided to try again with 4 classes to see how our model will perform.
We start again with the same process using the exact same criteria applied in the 2-classes attempt.
Similar to our first attempt, we split our data into Test-Train-Validate and Predict sets and we divide it into labeled vs unlabeled.
The Complete graph still outperforms the 6 classes attempt but not as accurate as the 2 classes.
CONCLUSION
- The more related and well distributed the Amenities the better the prediction performance .
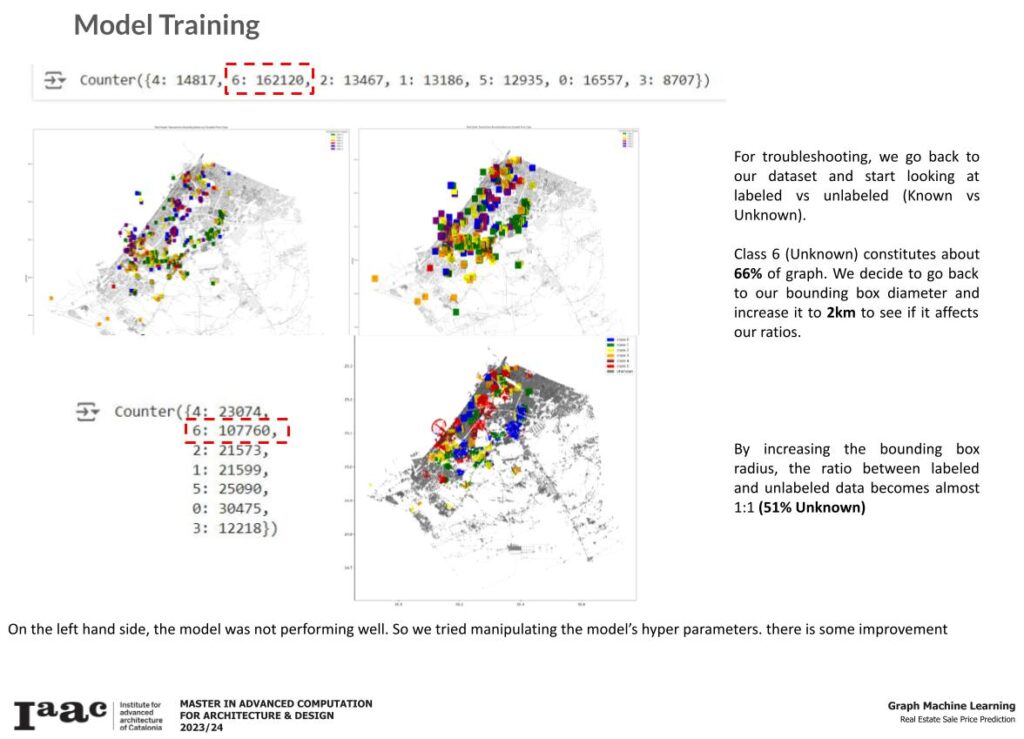
- Increasing the known:unknown values by limiting the neighbourhoods on the graph rather than taking all of Dubai map in consideration, or through bigger node labeling methods will result in better model training.
- The classification criteria has an inverse relationship with the model’s performance. When the amount of classes increase, the model’s accuracy drops and vice versa.
