
Introduction
Accurate prediction of rental prices poses a significant challenge in dynamic real estate markets such as Amsterdam. Our research project explores the use of graph-based machine learning to improve the accuracy of such predictions. This methodology could be of interest to various actors in the real estate sector, including brokers, investors, and urban planners.
Key aspects of our study:
- Integration of web scraping, OpenStreetMap data, and Graph Neural Networks
- Analysis of prediction accuracy for rental price classes
- Examination of relevant factors influencing rental prices in different city districts
The Problem
Amsterdam, like many other cities, has a diverse real estate market with varying rental prices influenced by numerous factors. Traditional models often struggle to incorporate the spatial and contextual richness required to accurately predict these prices. Our goal was to create a model that not only predicts rental prices but also understands the spatial dependencies and amenities influencing these prices.
Methodological Approach
Multiple data sources were used in the execution of the project by combining Internet-scraped rental data, OpenStreetMap (OSM) data and advanced graph-based machine learning techniques.
Data Collection and Preparation
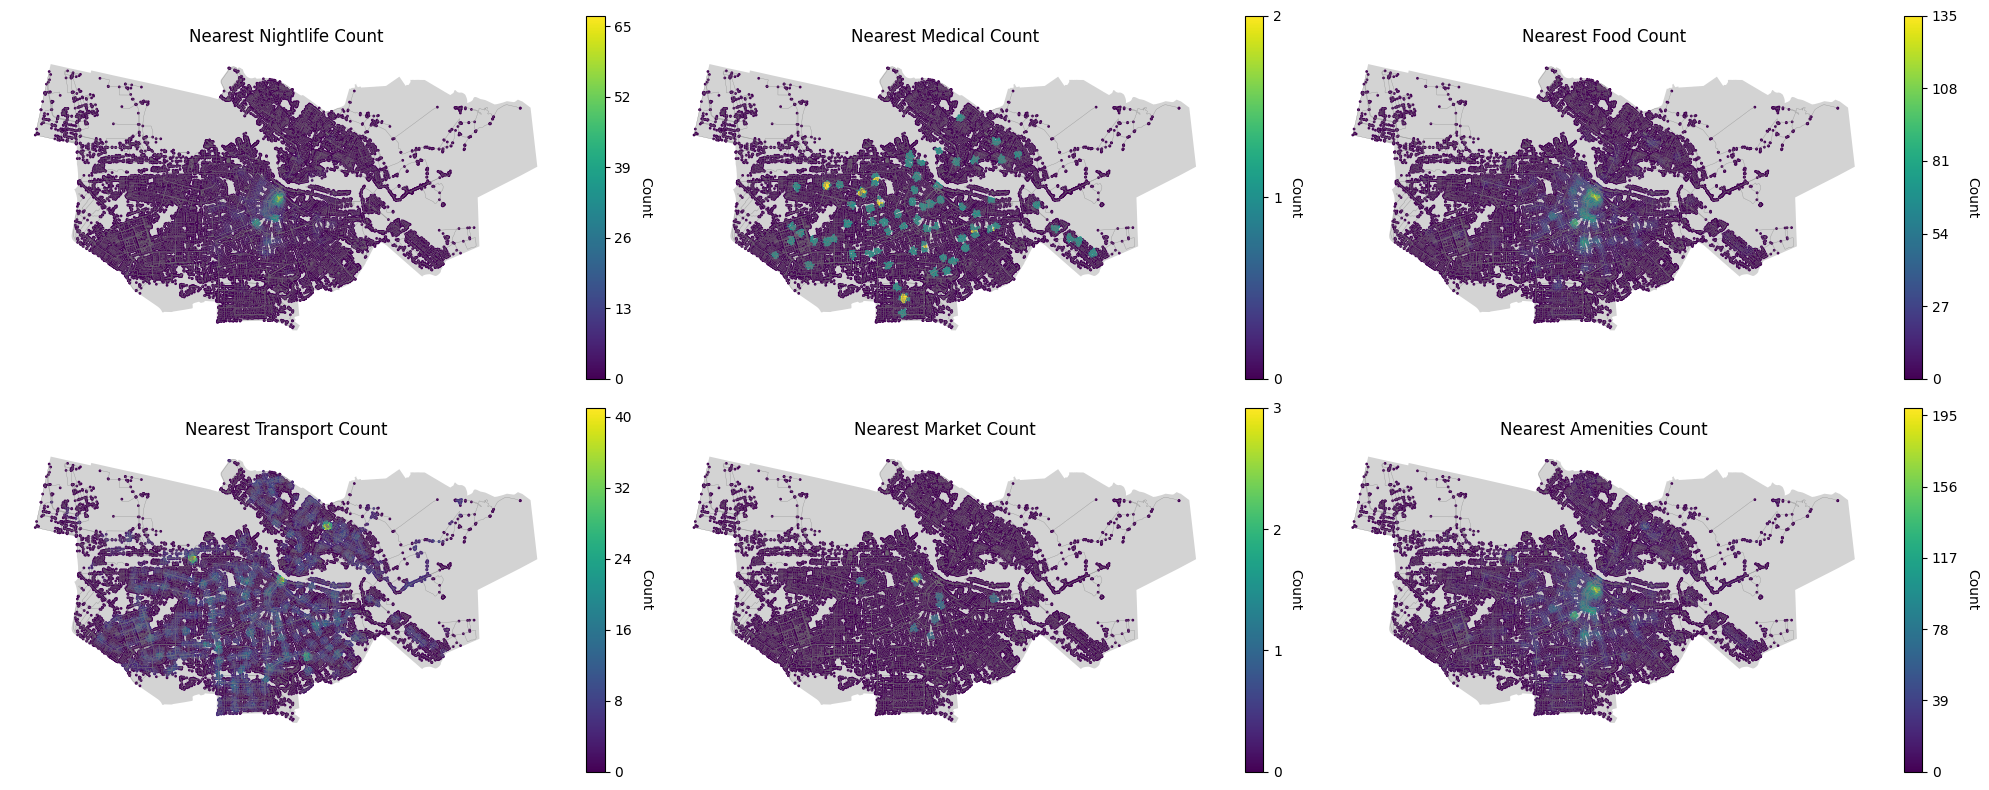
The project began with collecting rental data from pararius.com, which provided detailed information on rental prices, square footage, property types and more. This data was cleaned and converted into a geospatial format, making it ready for further analysis. Alongside, we extracted amenities data from OpenStreetMap, focusing on categories such as nightlife, medical facilities, food establishments, markets, and transport hubs. This data was also converted into a geospatial format and categorized for easier integration.
The web-scraped data lacked an associated coordinate reference system. We identified that the data likely used the EPSG:4326 system, common for web-based maps. We then converted all data into the Dutch national coordinate system (EPSG:28992) to ensure consistency across all our datasets.
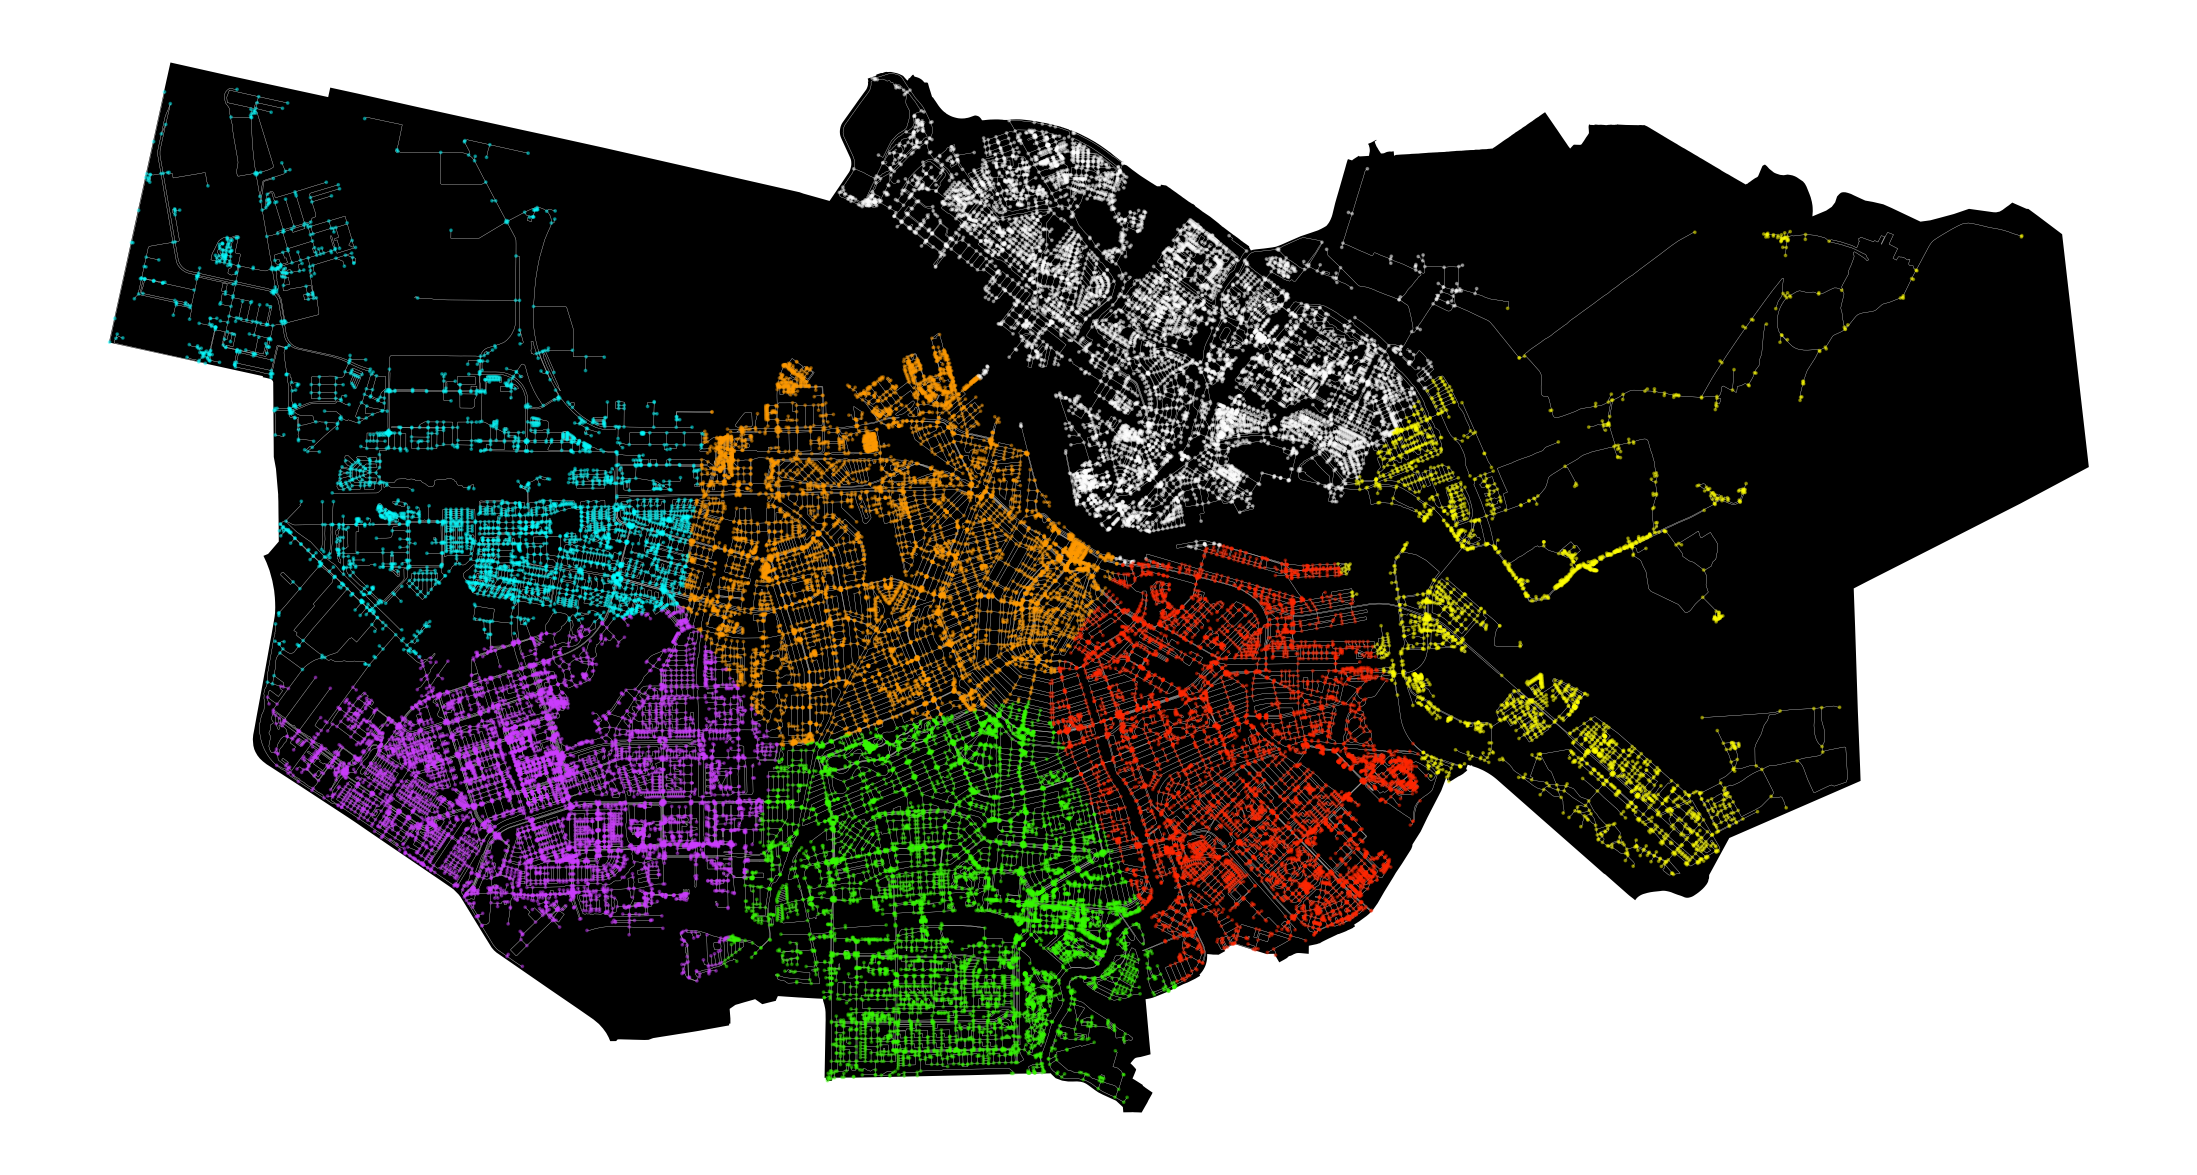
Using k-means clustering on the OSM data, we divided Amsterdam into distinct neighborhoods, helping us understand how different clusters or neighborhoods influence rental prices.
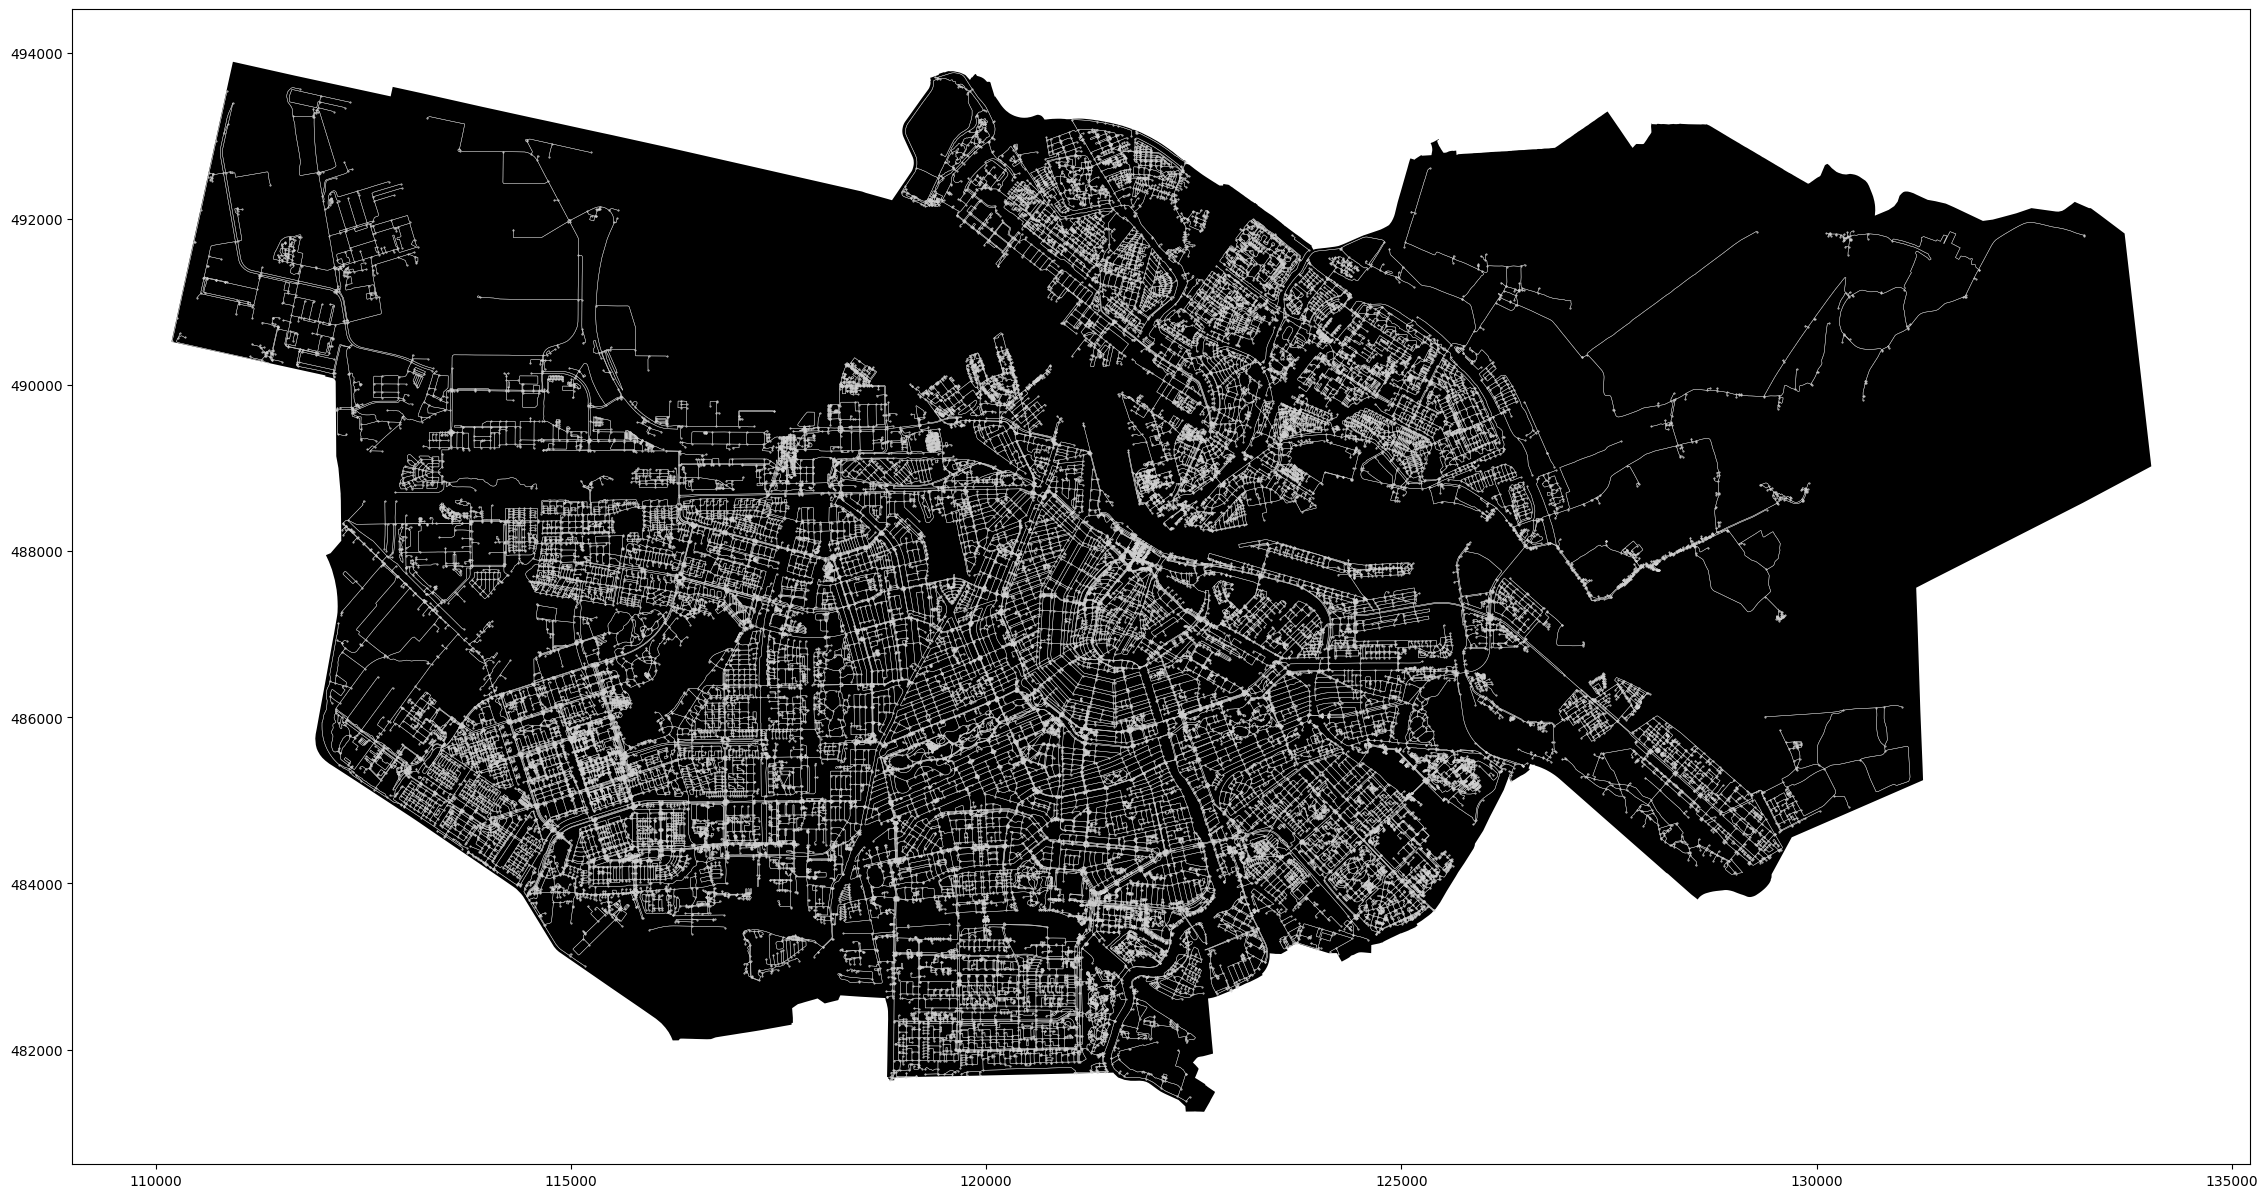
Building the Graph
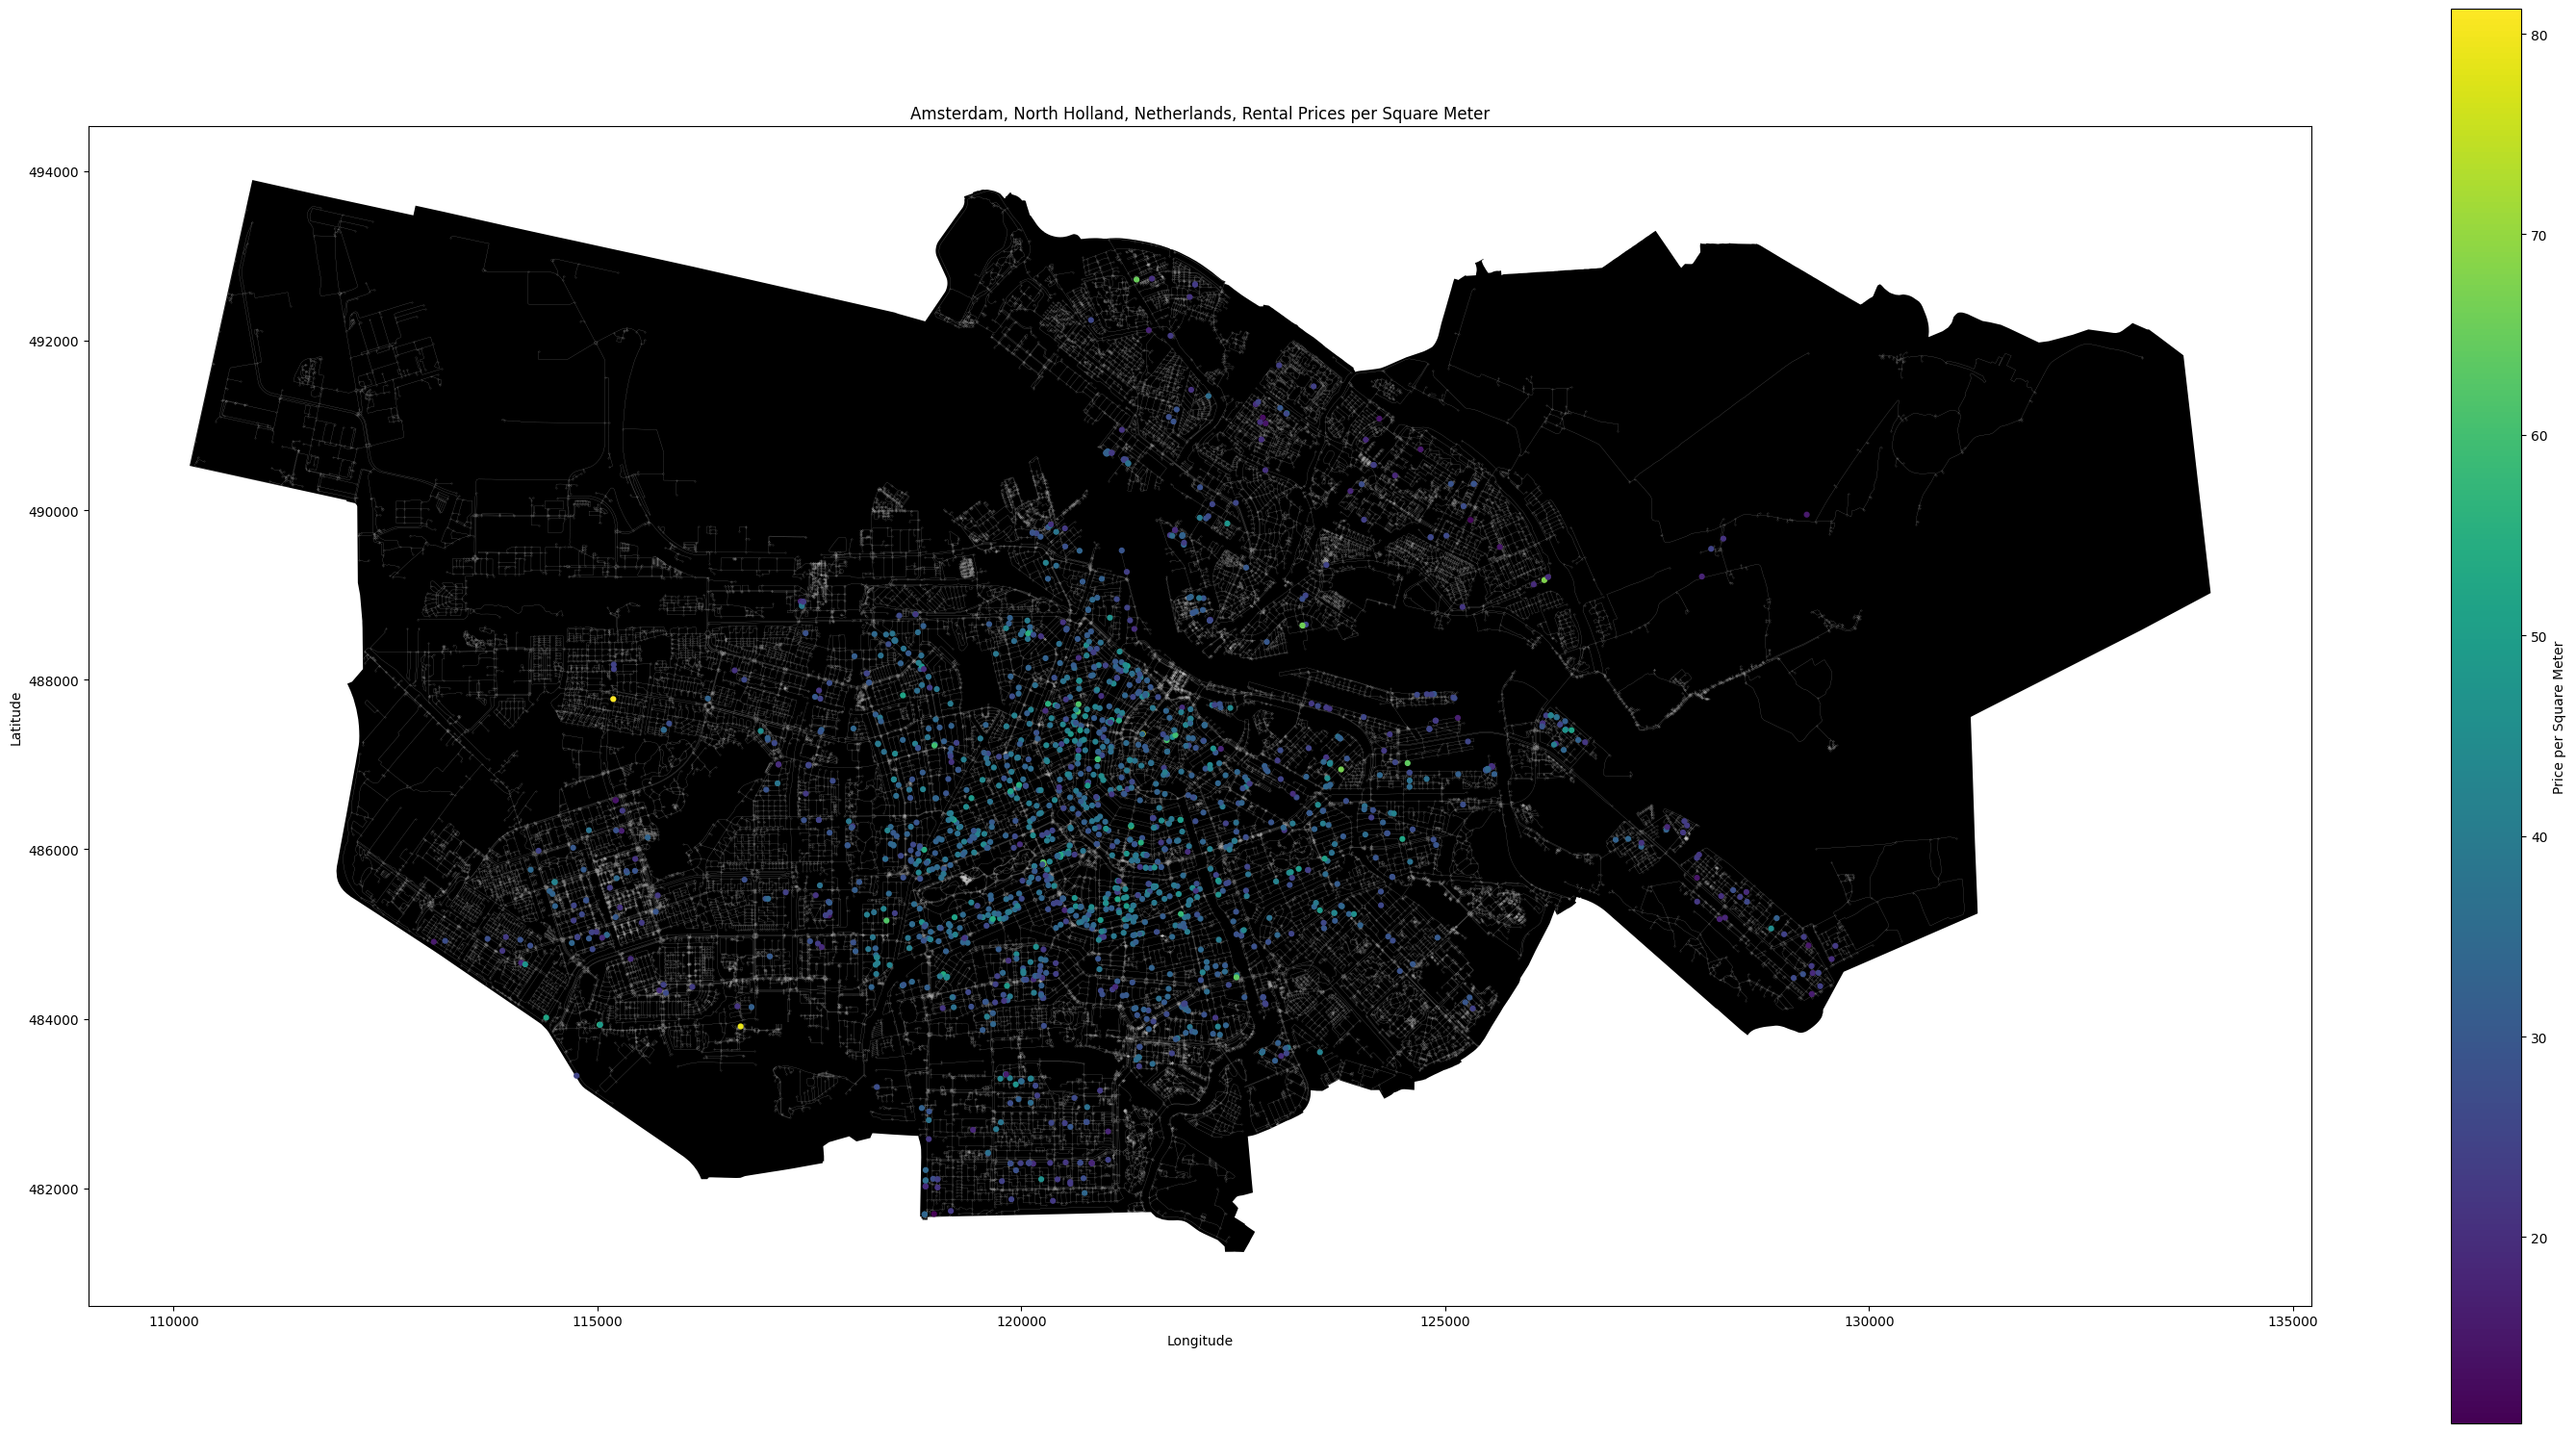
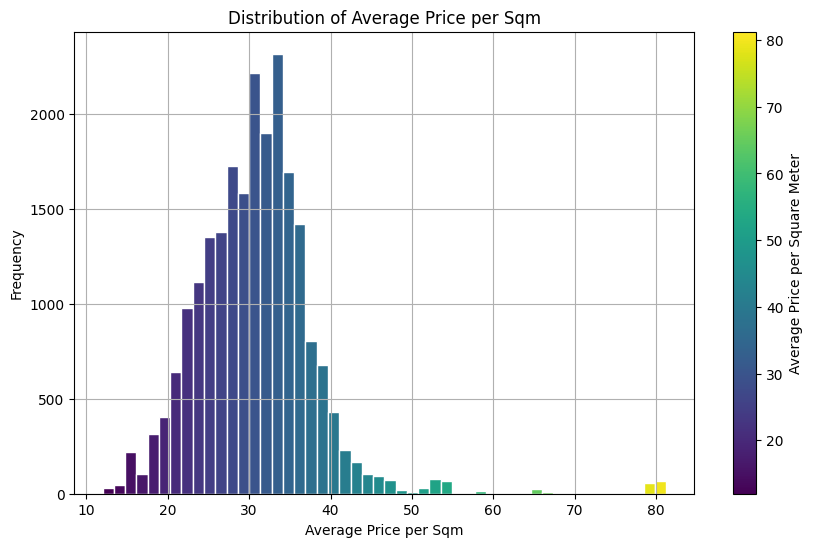
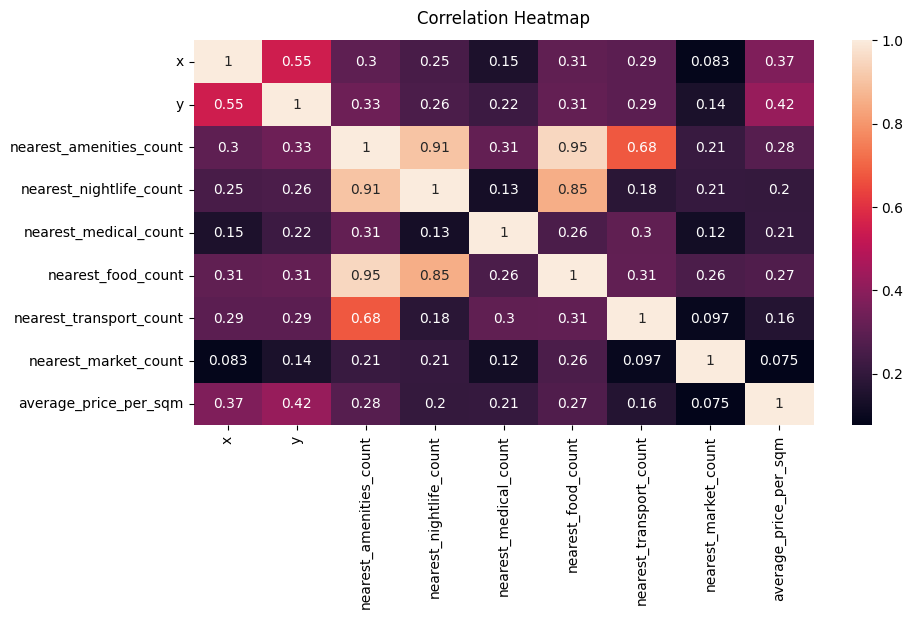
We created a comprehensive graph of Amsterdam using OSM’s street network data. Nodes in this graph represented various locations, enriched with rental and amenities data. We calculated the number of amenities within a 200-meter radius of each node and computed the average rental price per square meter for properties within these radii. These values were assigned as features to the nodes, creating a rich, data-driven representation of the city.
Machine Learning with Graph Neural Networks
To train our model, we categorized the rental prices into distinct classes using methods like equal-width binning and quantile-based binning. This classification was essential for training the model to predict price classes. We then built a Graph Neural Network (GNN) using the Deep Graph Library (DGL). The dataset was split into training, validation, and test sets, and the model was trained to predict the rental price class of each node.
Results and Visualization
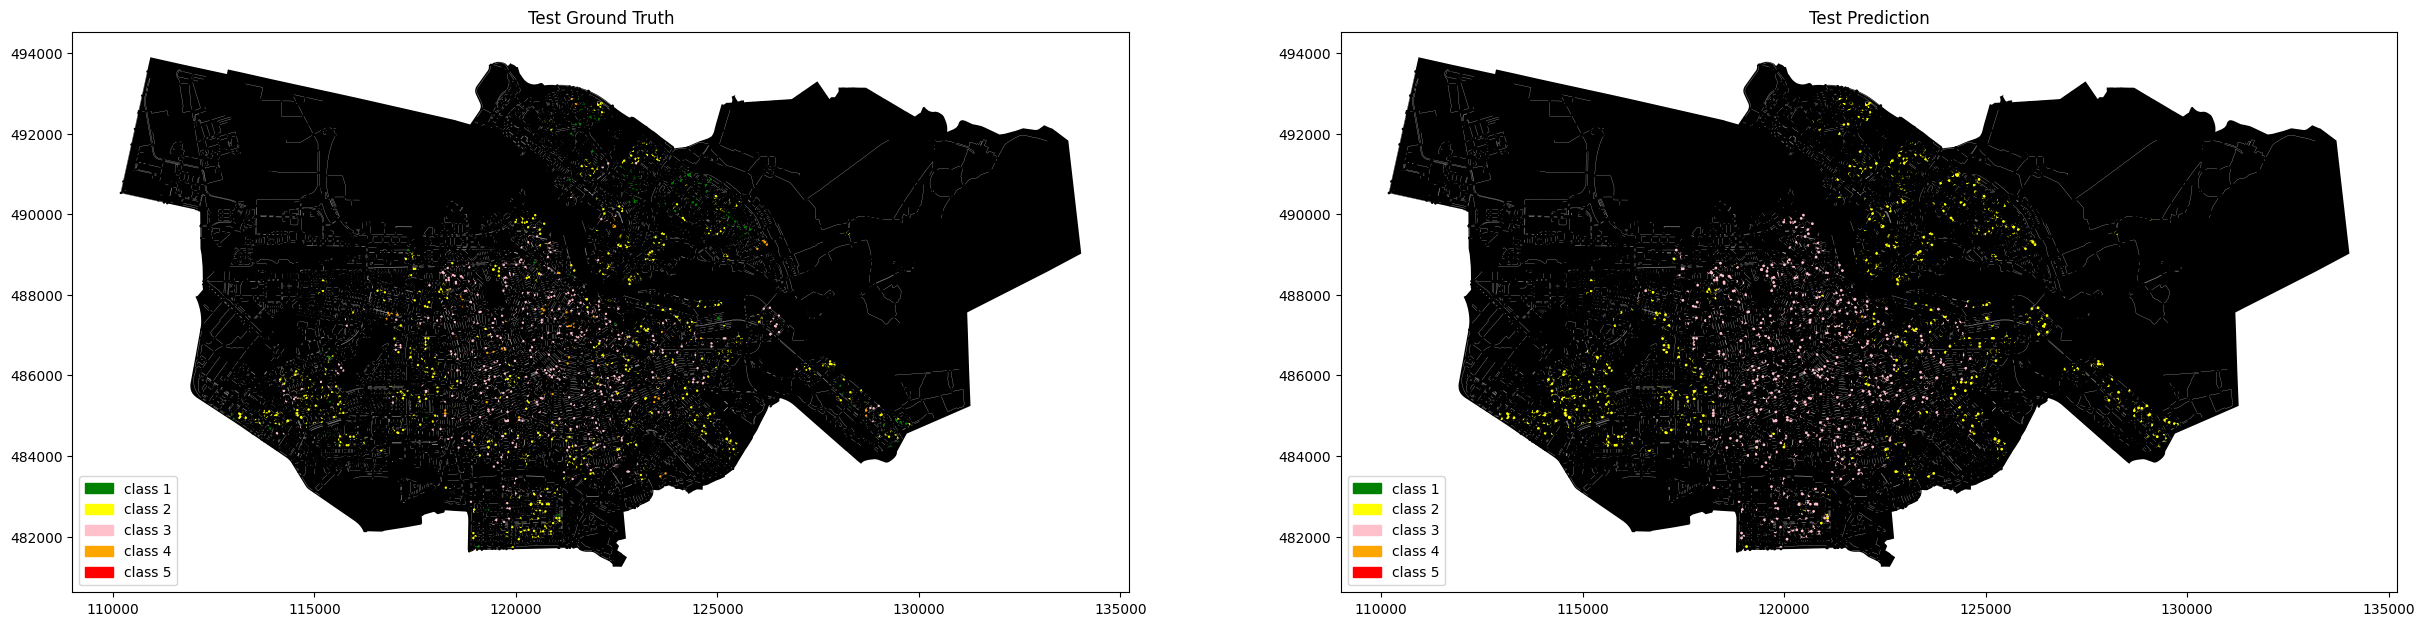
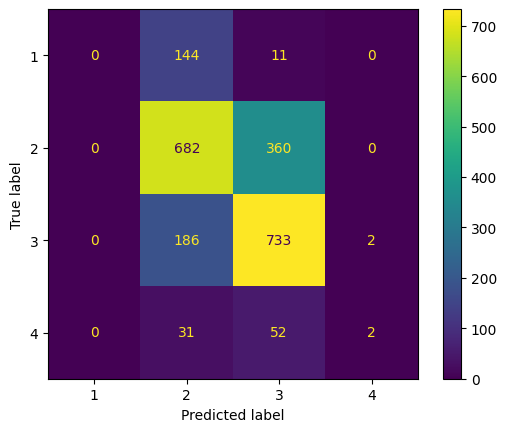
Our model achieved a moderate level of accuracy, with a balanced performance in terms of precision and recall. We visualized the results to compare the predicted rental price classes with the actual ones, showcasing the model’s performance. Detailed plots were created to visualize the distribution of amenities and rental prices across Amsterdam, providing a picture of the market dynamics.
Conclusion
This project demonstrates the power of combining graph-based techniques with machine learning for analyzing and predicting rental prices in complex urban environments. By leveraging rich spatial and contextual data, our model offers insights into the rental market in Amsterdam. The combination of extensive geodata with advanced AI technologies opens up new perspectives for the real estate industry and urban research.
However, the model’s performance was not entirely satisfactory in all aspects. In particular, it struggled with accuracy in less densely populated areas and varied data quality. To enhance the accuracy and reliability of our predictions, a solution could be to integrate additional datasets, such as socio-economic indicators, historical rental price trends, and more detailed property attributes. Furthermore, breaking down existing categories into more granular subcategories could help in identifying more precise relationships.
Future Work
Future research directions include applying our methodology to other urban contexts to test its generalizability and developing applications to make the insights gained practically usable.
The methodology presented provides a solid foundation for further research in data-driven real estate market analysis. We look forward to continuing our exploration and innovation in this exciting field. Stay tuned for more updates!
