
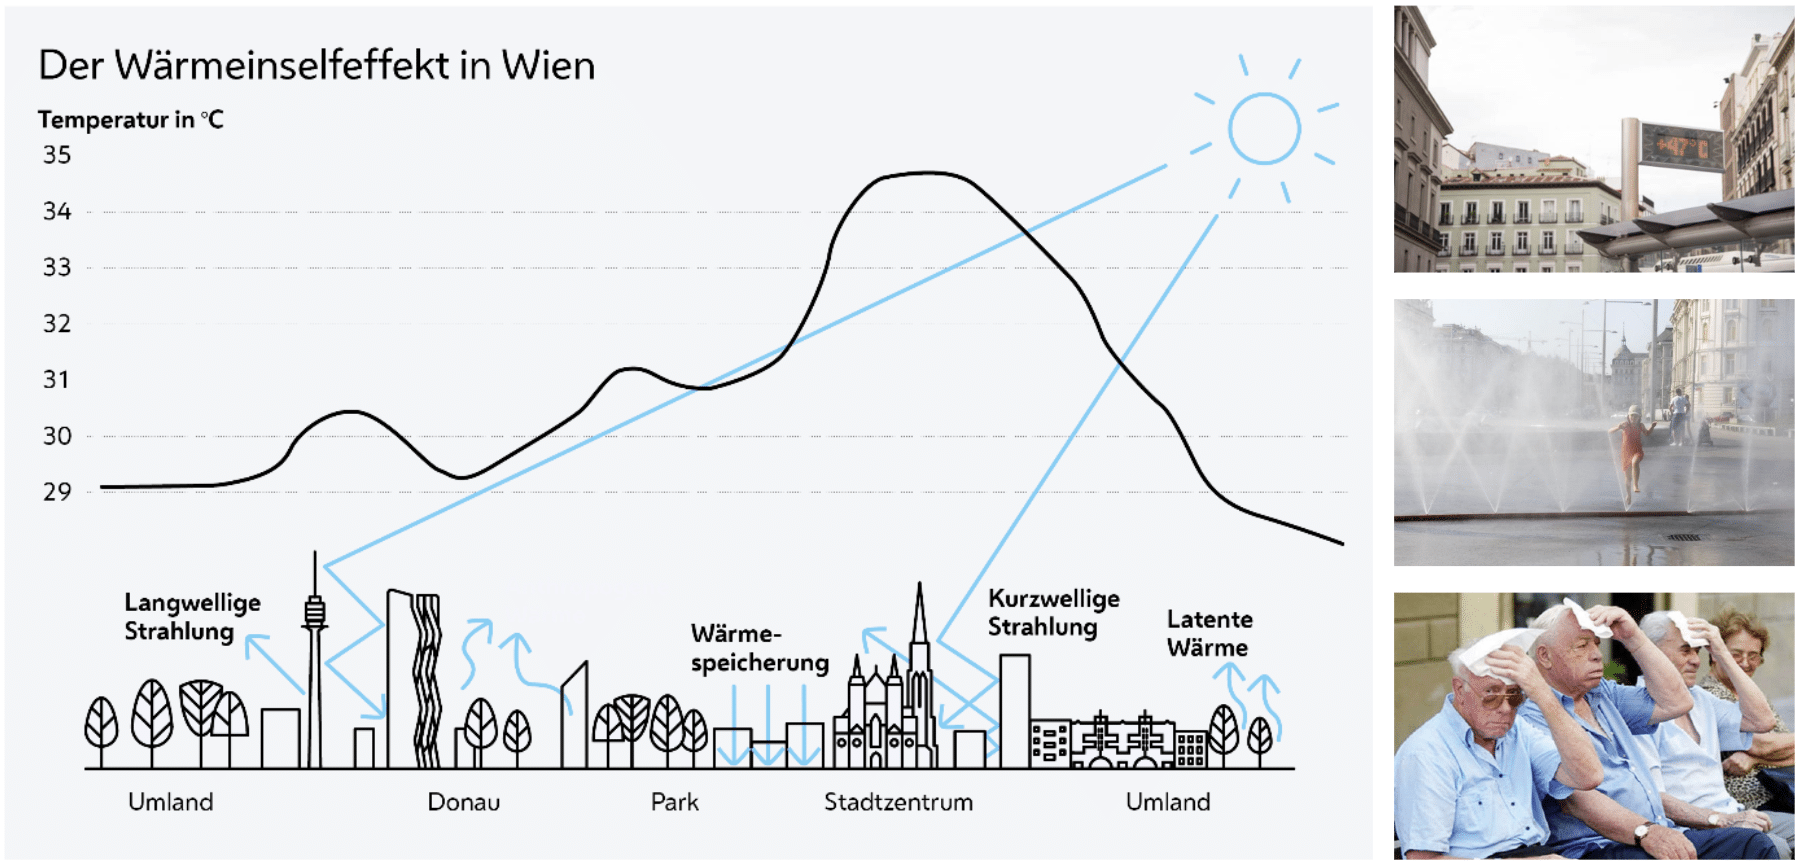
Cities are warming rapidly, and dense urban centers feel it the most — especially areas with little shade or vegetation. Heat doesn’t affect everyone equally: groups like the elderly, youth, and people with health conditions are far more vulnerable.
Problem Statement
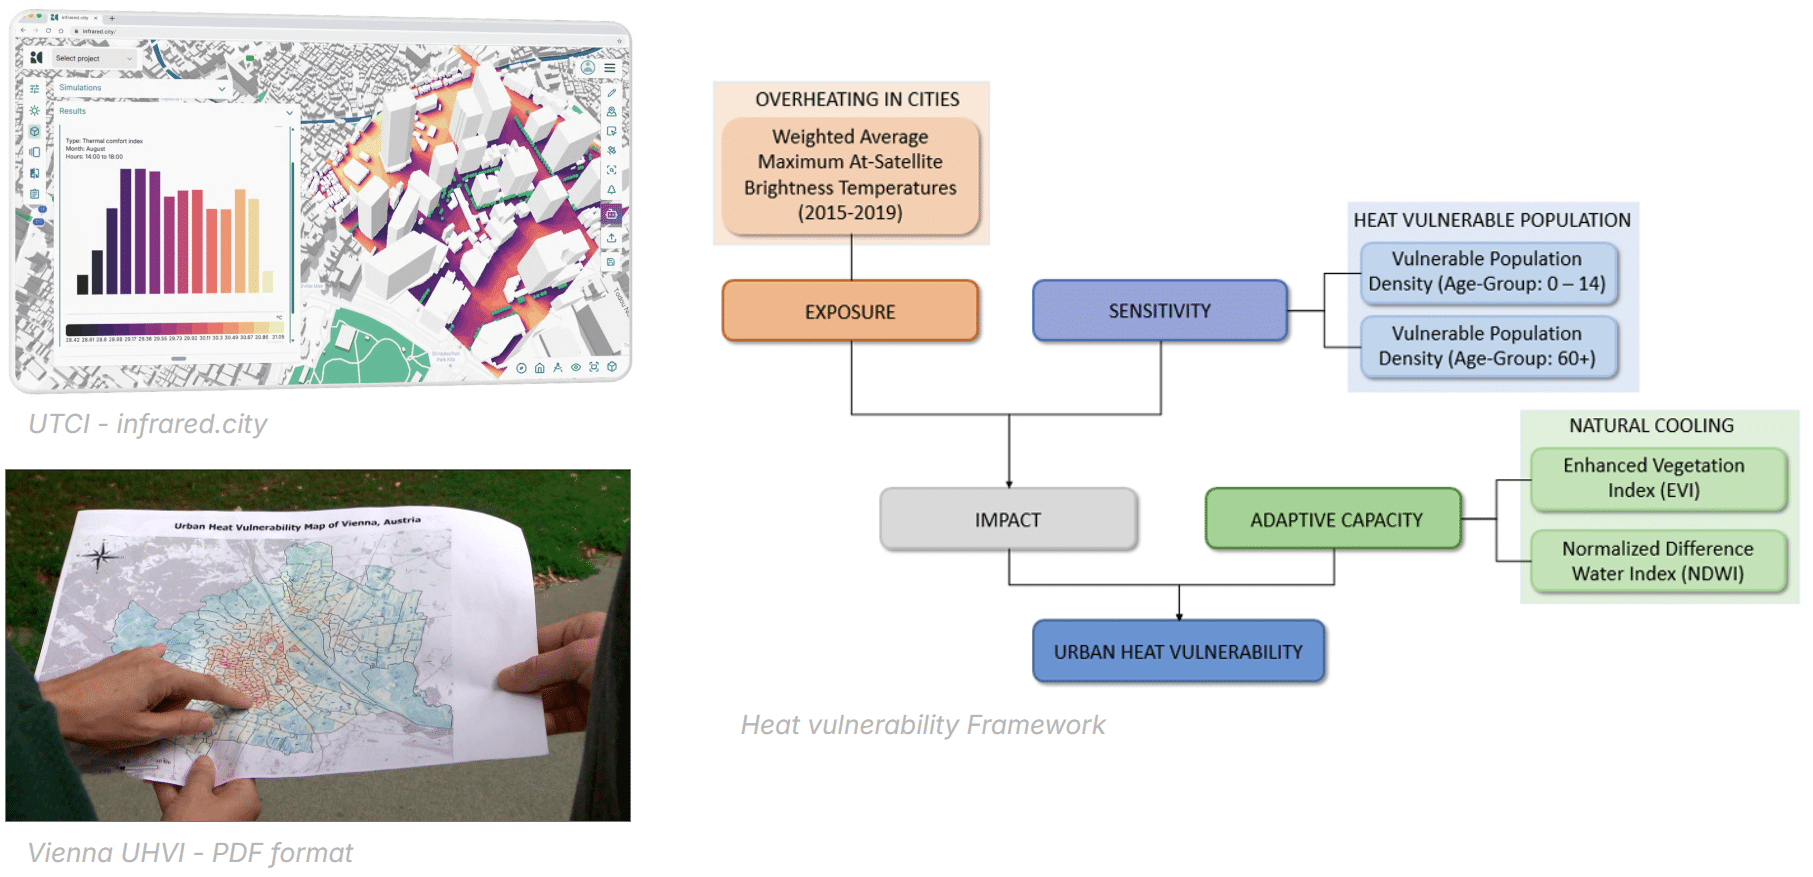
Most existing tools focus on UTCI, the Universal Thermal Climate Index. It measures how hot it feels outdoors and gives one single value for the entire population. While this is useful, it doesn’t show who is most affected or how high the risk is.
UHVI — the Urban Heat Vulnerability Index — fills that gap by combining heat exposure with socio‑demographic sensitivity. Vienna has excellent UHVI data, but it currently lives inside heavy GIS files and static PDFs. These formats are slow, technical, and not suited for fast planning or public transparency.
Proposed Solution
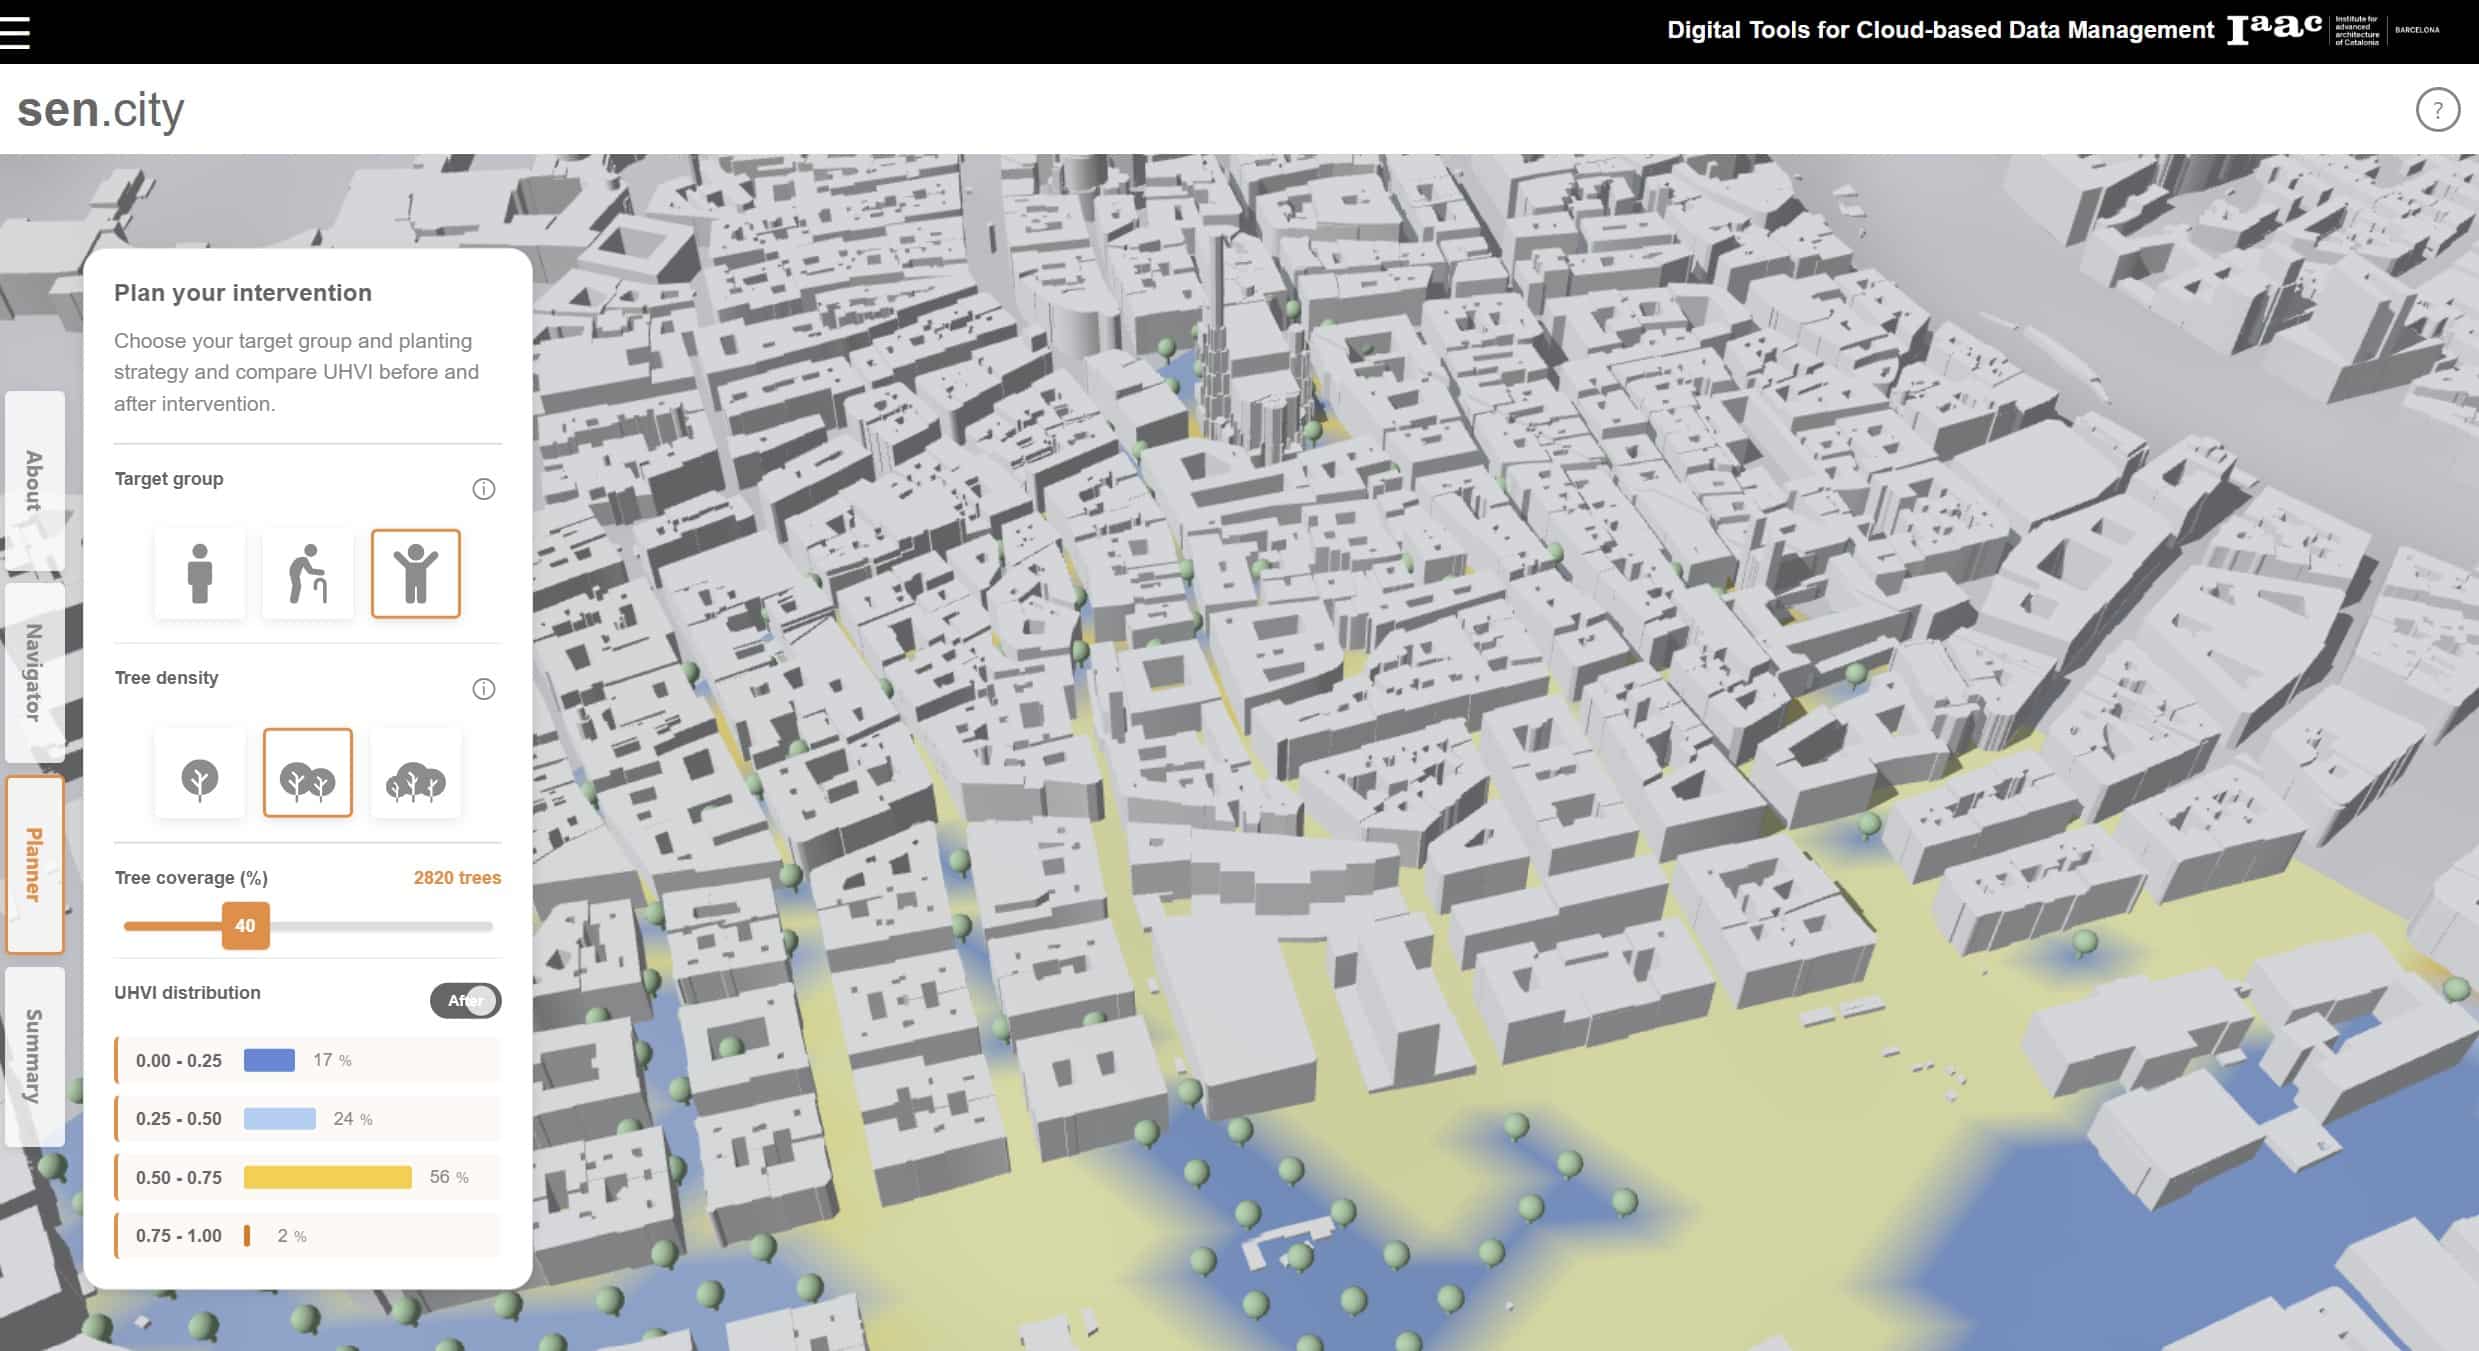
Sen.city transforms Vienna’s static UHVI dataset into an interactive planning environment. It makes vulnerability understandable at a glance and lets users instantly simulate the cooling impact of new trees.
The tool is designed for urban planners and politicians who need to prioritize interventions and communicate decisions with transparent scoring logic.
How it Works
Data Preparation
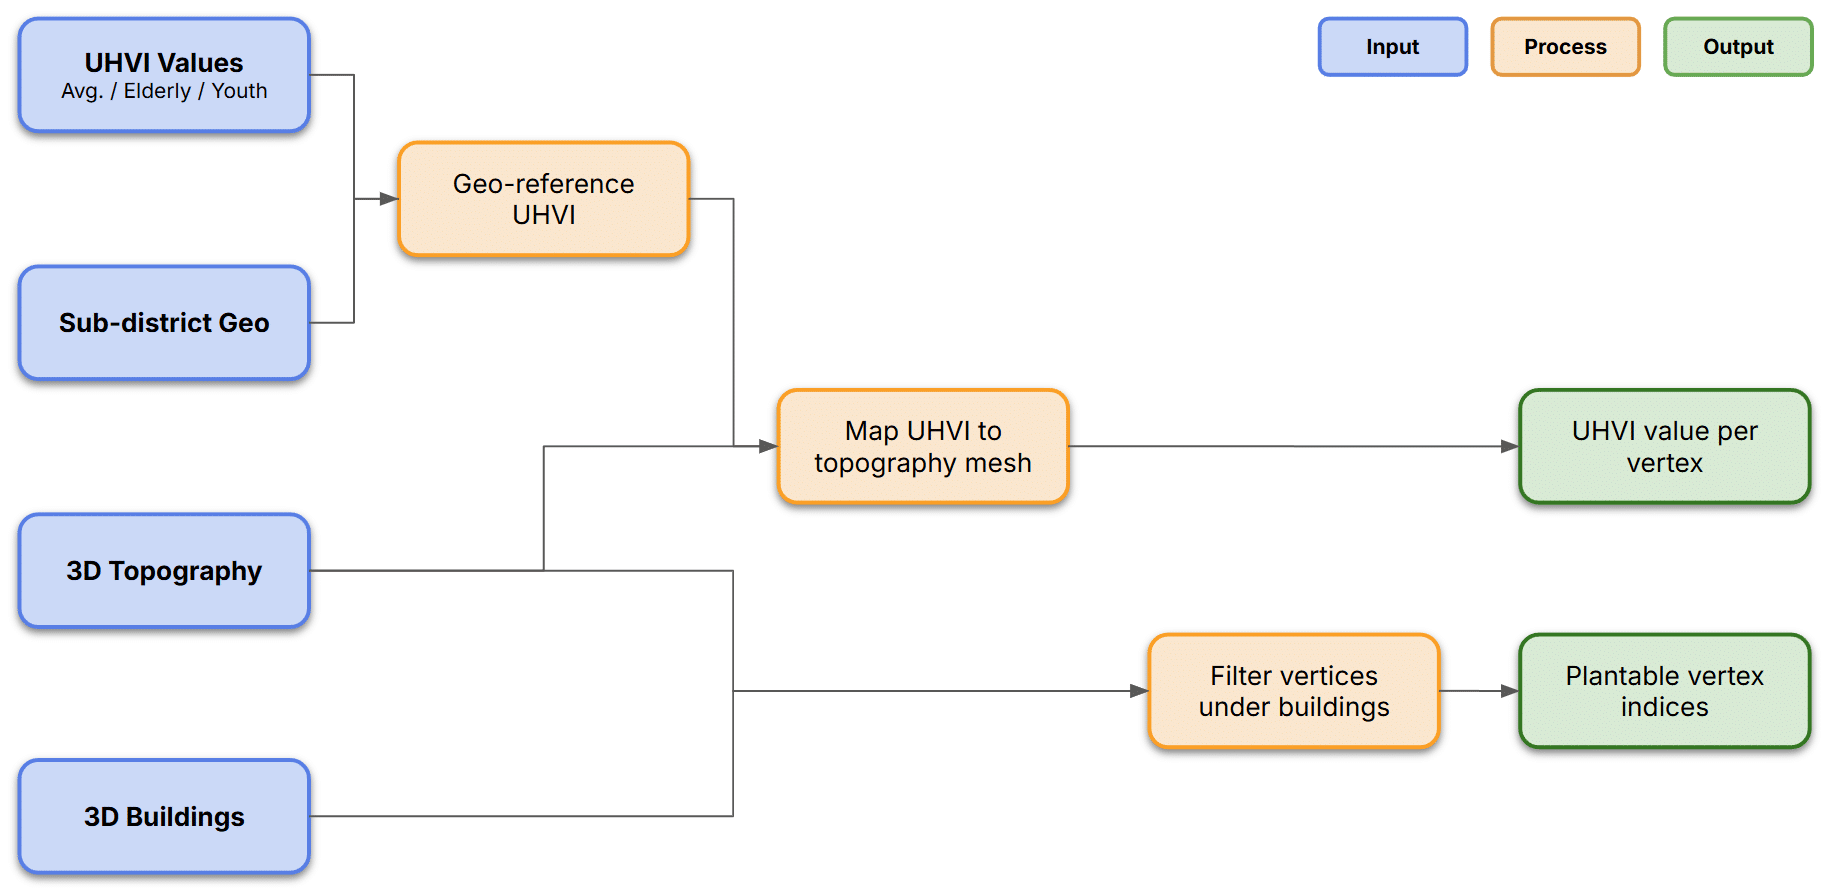
We started from Vienna’s official UHVI dataset — available for the general population, the elderly, and youth. We georeferenced these values and mapped them onto a 3D topography mesh of four central districts, the stored the lists of UHVI value per vertex together with suitable-for-planting locations.
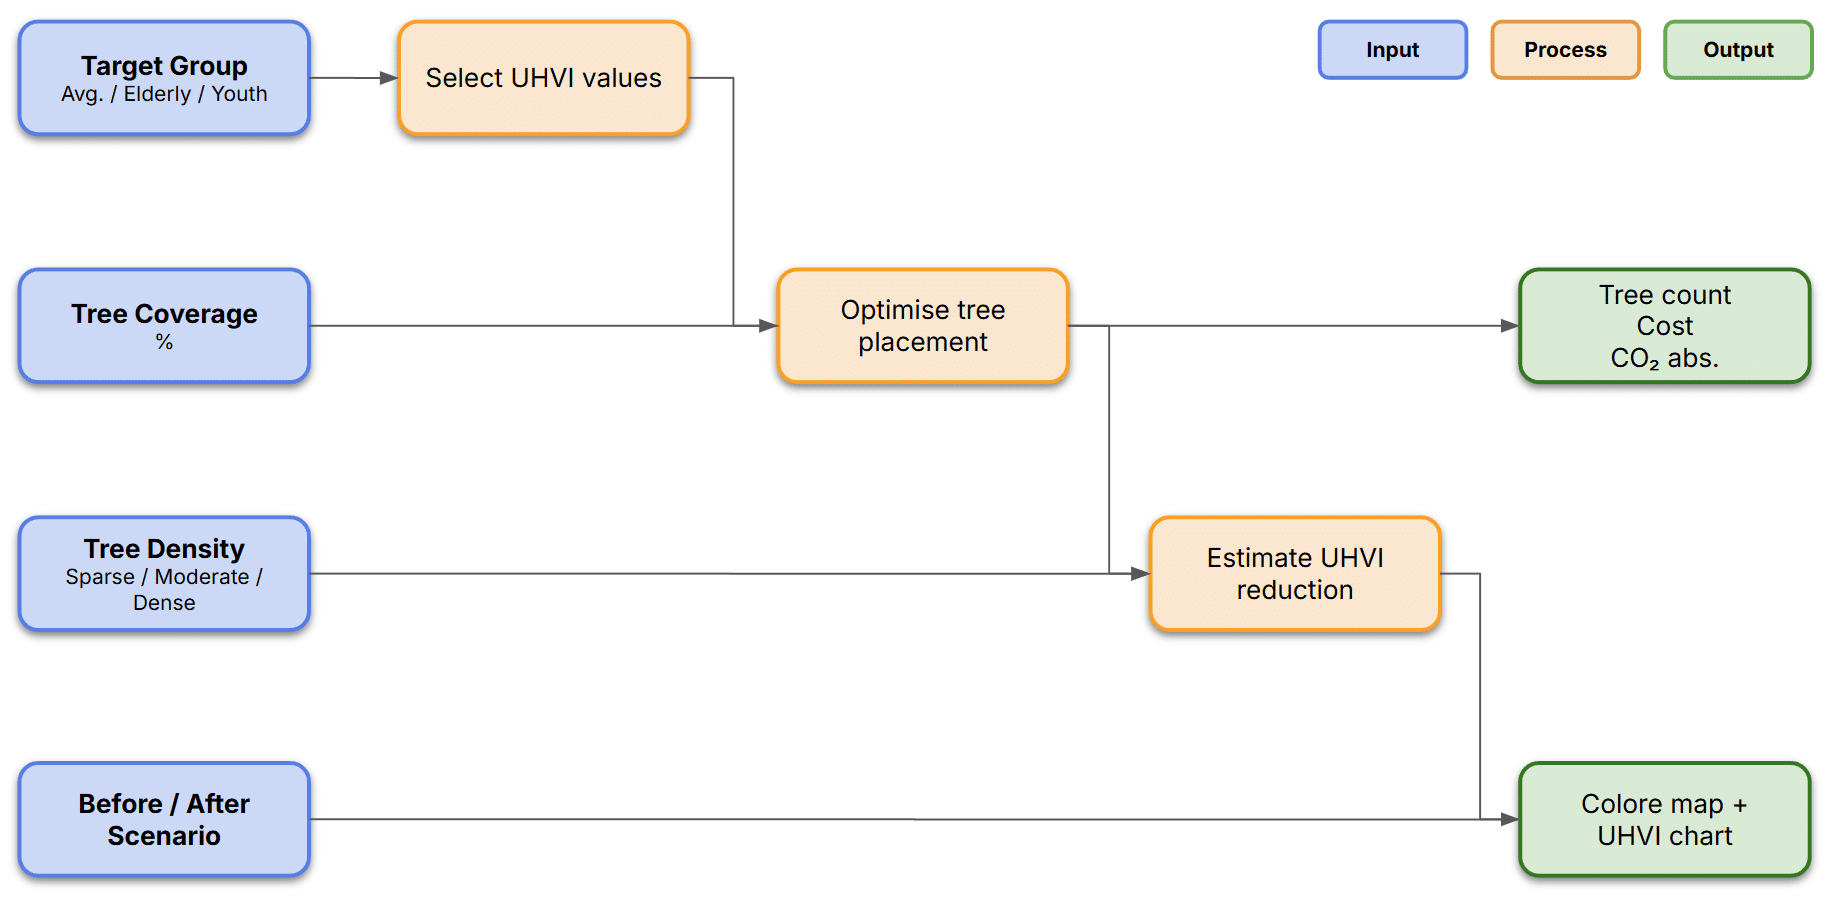
Interactive Engine
Once the data is mapped, the app becomes fully interactive. It takes user inputs — target group, tree density, and coverage — optimise tree placement and updates the UHVI map in real time to show the cooling effect.
Success Factors
The key success factor is speed. All the heavy GIS processing is done upfront, so scenarios render in seconds instead of days. The interface is intuitive and lowers the barrier to using UHVI, making it accessible beyond GIS specialists and usable in fast decision‑making contexts.
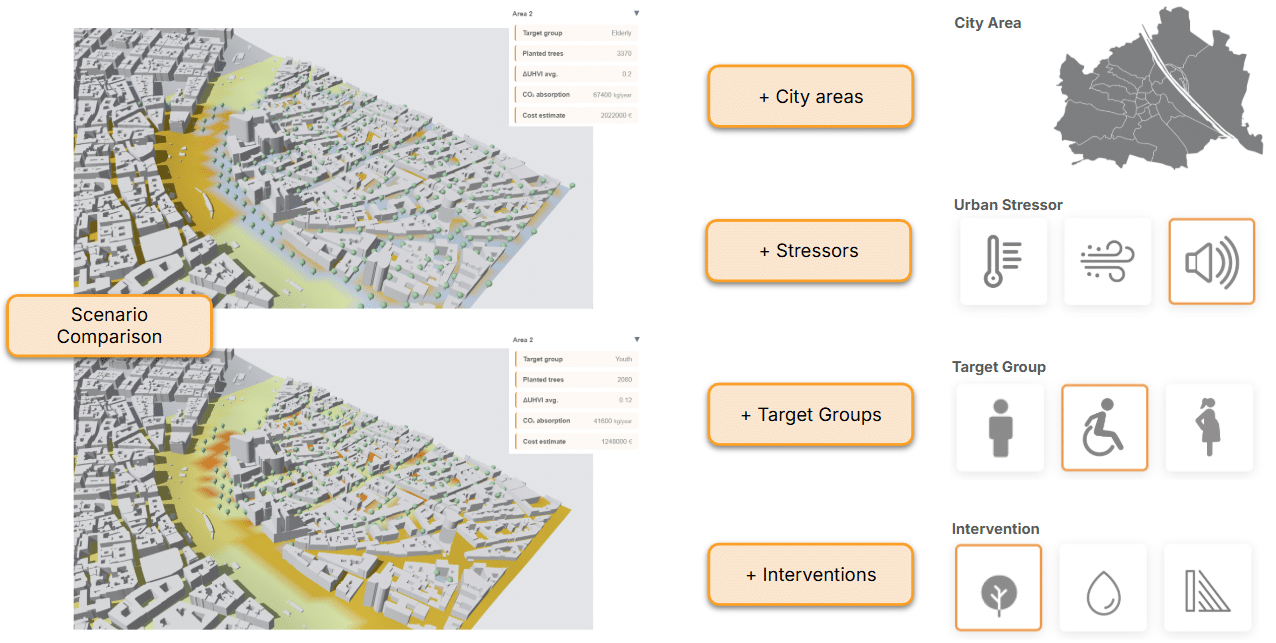
Future Vision
In the future, users will be able to save multiple scenarios per area, compare and share them. The tool can scale and extend to other stressors like noise or dust, additional vulnerable groups such as pregnant women or people with disabilities, and interventions such as water sources and shading.
You can find the full app description and user workflow in the video below.
