Abstract
This study delves into the innovative fusion of graph theory with architectural design and planning, facilitated by a structured BIM to Graph workflow. By conceptualizing architectural elements as nodes and their interconnections as edges within a graph, architects gain an adaptable and multifunctional tool for representation, analysis, and strategic planning. The graph’s inherent scalability allows it to transcend various architectural contexts, providing a unified language for diverse projects. Interactivity is introduced to enhance the comprehension of the graph, making it more user-friendly. Architectural attributes, such as energy efficiency, spatial functionality, program distribution, and geometric considerations, are seamlessly integrated into the graph, enriching the analytical toolkit. Practical scenarios highlight the graph’s practicality. Architects can utilize it for optimizing network layouts, assessing restroom efficiency, and formulating emergency evacuation plans. Engineers benefit from the minimum spanning tree graph for efficient infrastructure design. Maintenance planning and spatial optimization become more data-driven through the graph’s node-level insights. This innovative integration of graph theory within BIM workflows enhances architectural decision-making across the building’s entire lifecycle. From design refinement to operational efficiency and adaptive reuse, the graph proves invaluable in augmenting the quality and functionality of the built environment.
Introduction
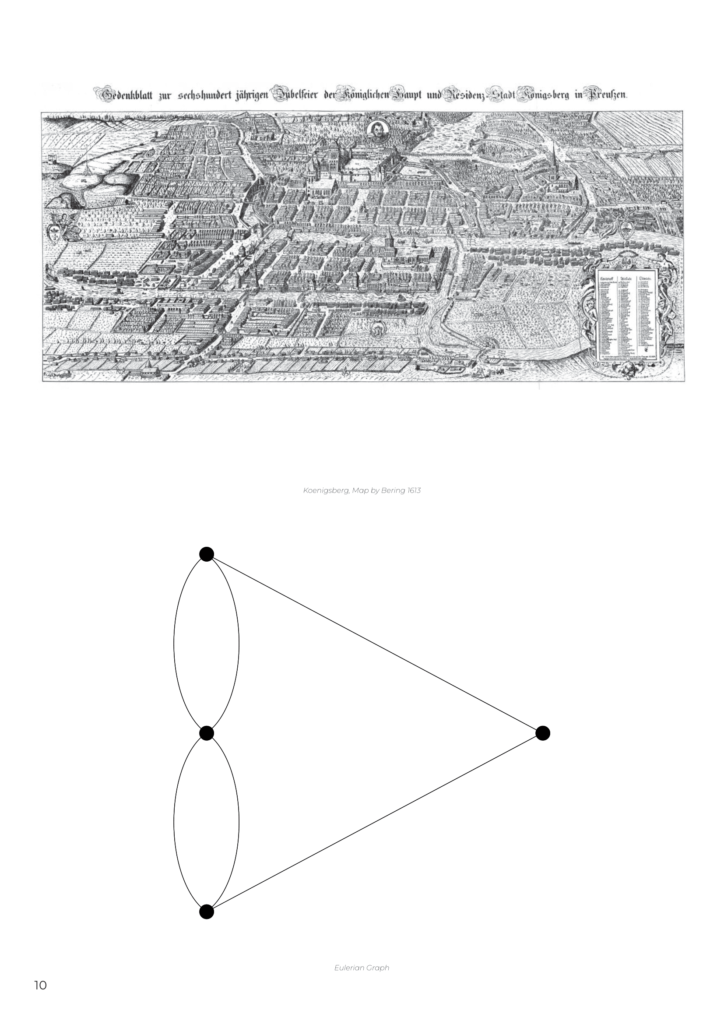
Graph theory, a branch of mathematics, found its roots in a practical puzzle that emerged in the 18th century – the Bridges of Königsberg problem. This intriguing conundrum centered on the city of Königsberg, which was connected by seven bridges, spanning two main landmasses and several river islands. The puzzle presented a deceptively simple task: to devise a route that would traverse each bridge precisely once, ultimately returning to the initial starting point. In pursuit of this challenge, the renowned mathematician Leonhard Euler not only unraveled the enigma but also erected the cornerstones of graph theory. Euler’s intellectual prowess introduced the revolutionary notion of a “graph” – a visual representation that captures the relationships between objects through nodes and edges. This innovation marked a pivotal moment in the history of mathematics, as it unlocked a powerful tool for modeling and understanding intricate connections in various domains of knowledge. The impact of graph theory transcends the confines of mathematical academia, as it permeates and influences a wide spectrum of fields. It functions as an indispensable instrument in realms as diverse as computer science, social networks, economics, urban planning, and many others. This thesis embarks on a comprehensive exploration of the multifaceted landscape of graph theory, delving into its foundational principles and uncovering its profound implications in contemporary society. As we embark on this intellectual journey, we will navigate the intricate networks of knowledge, demonstrating how graph theory continues to shape and revolutionize our understanding of Architecture.
How can applied graphs be used in architectural decision making? Can they enhance architectural representation and expose spatial information?
This thesis is an exploration of a BIM to graph workflow its application on an existing work from Perkins and Will.
Forms of Architectural Representation
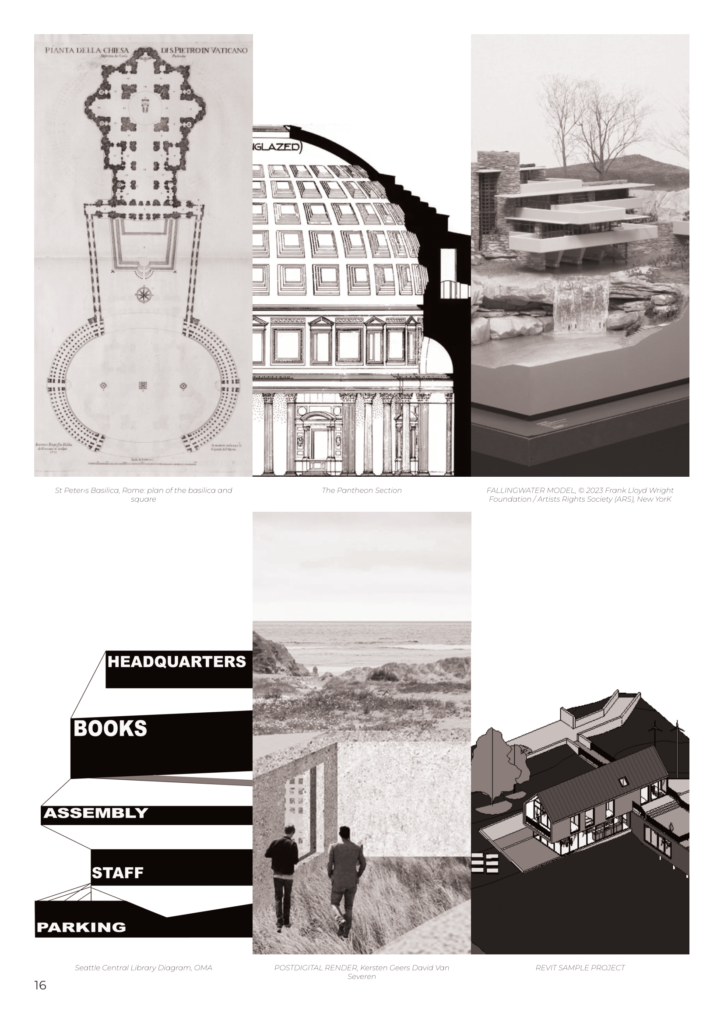
In the realm of architectural representation, various tools and forms play pivotal roles in conveying essential aspects of a project. Among these, the plan emerges as a foundational drawing, offering crucial insights into spatial organization and layout, as well as serving as a valuable resource for zoning and code compliance assessments. Complementing the plan, the section provides a vertical cross-section, illuminating structural elements and the experiential dimensions of both horizontal and vertical circulation, while also aiding in the analysis of daylight and other pertinent factors. The diagram distills the project into its fundamental concepts, effectively conveying its
guiding principles. The physical model, on the other hand, serves as a tangible testing ground for iterative design processes, allowing for in-depth exploration of scale, massing, and materiality, and serving as a potent medium for communication with clients and stakeholders. In the digital realm, the render unveils the experiential nuances of a space, shedding light on aspects such as lighting and materiality, thereby facilitating visualization and the anticipation of user experiences. The BIM (Building
Information Modeling) model emerges as a centralized digital repository, fostering efficient management and collaborative efforts among consultants, while also proving invaluable for clash detection and error identification.
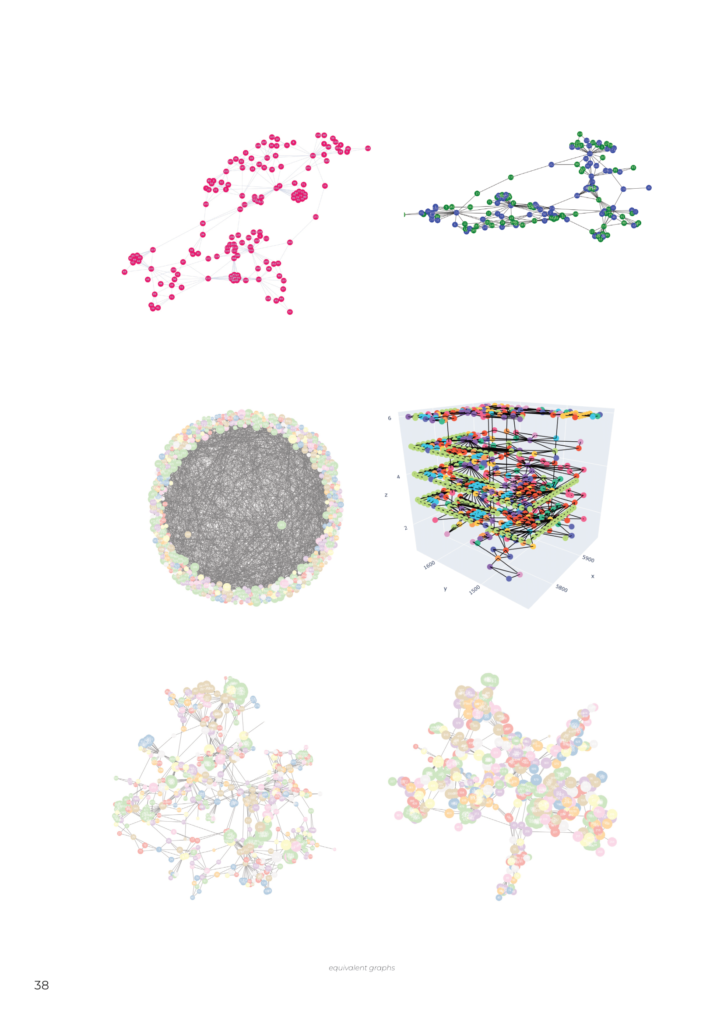
Amidst this array of tools, the graph presents a unique abstraction—a representation of a building distilled into nodes and edges, encoding vital information
and relationships. Notably, it transcends the constraints of scale, existing as a topological entity where equivalency reigns. Each graph, regardless of its representation, encapsulates the same underlying data. This scalelessness and inherent equivalence render the graph a versatile instrument, offering a fresh perspective on architectural representation that reinforces and enhances the utility of existing forms.
In this context, the graph emerges as an indispensable tool, harmoniously complementing and amplifying the strengths of conventional architectural representations. Its abstract nature, scalability, and consistent information representation make it a valuable asset in the architect’s toolkit, enhancing the understanding and communication of architectural projects from diverse vantage points.
BIM to Graph Workflow
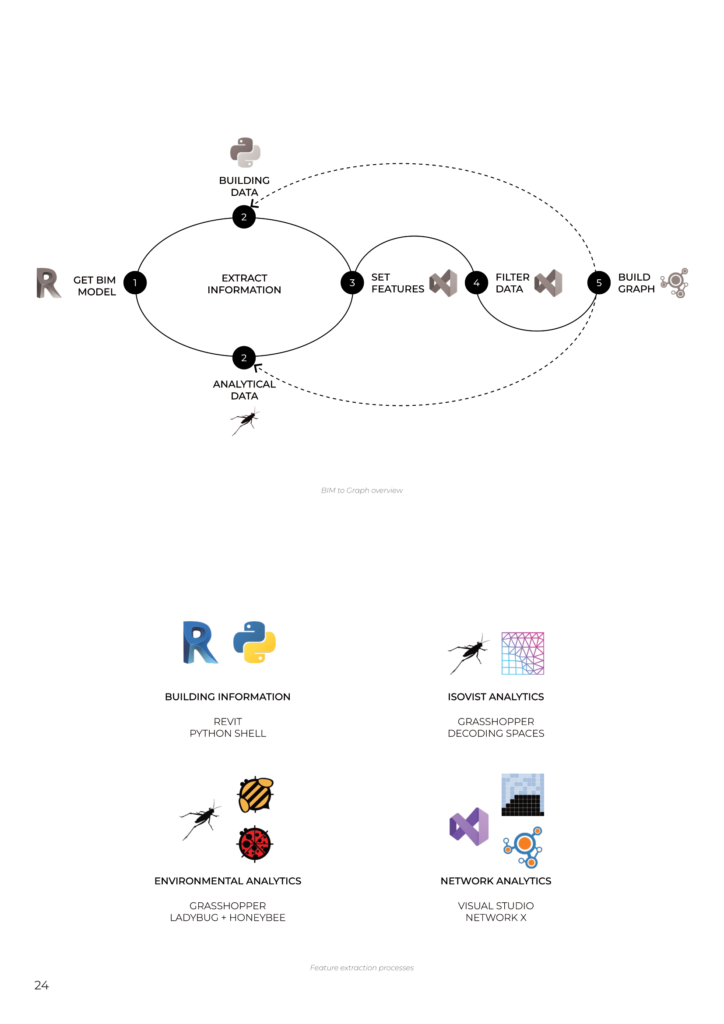
Modern architectural design requires an interdisciplinary approach that transcends traditional boundaries. Employing an array of computational tools, from geometric engines in Revit to parametric simulations in Rhino and Grasshopper, this study aims to pave the way for an integrated methodology. This work introduces an innovative pipeline that commences with a BIM model and integrates spatial, environmental, and human-centric data into a comprehensive graph-based representation. The workflow capitalizes on various computational tools to extract, analyze, and visualize multifaceted data. These tools range from Revit›s Python shell for geometric and core element properties, decoding spaces plugin for spatial and isovists analysis, Ladybug and Honeybee for bioclimatic metrics, NetworkX for graph construction and relation metrics, and MESA for agentbased simulations mimicking human action in different settings using the graph as the movement landscape. Those attributes will synergize to evaluate qualitatively interpretation outcomes and will enable the research team to efficiently assess the given simulated scenarios since agents have their own schedule and attributes and can naturally oscillate on their preference depending each node’s features and target.
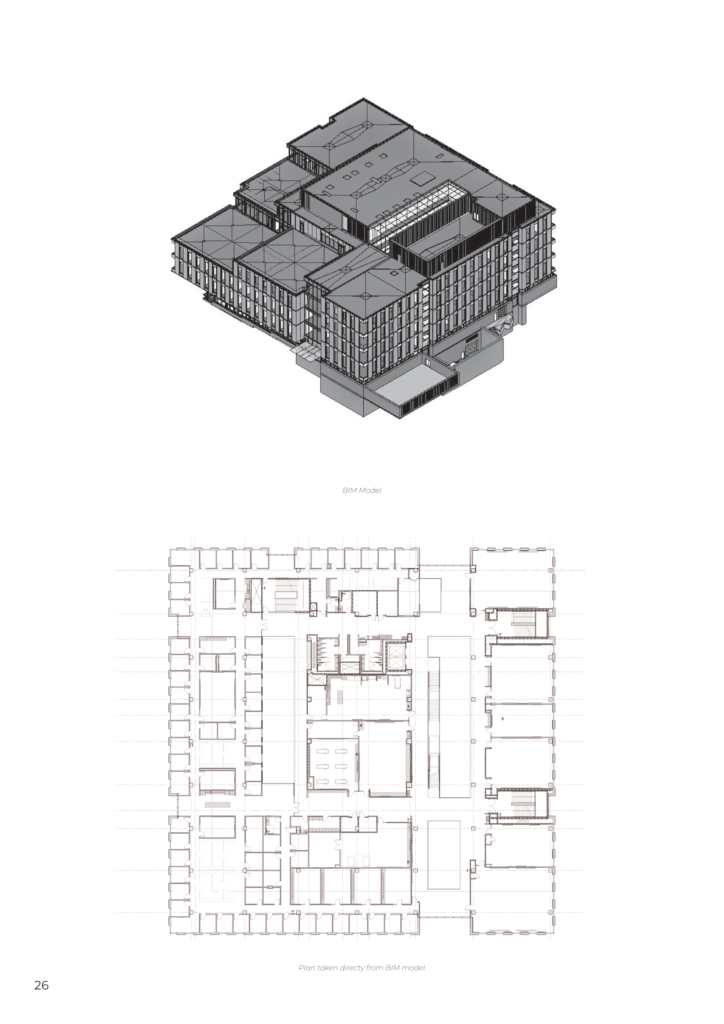
The research adopts a case study methodology focusing on a university building designed by Perkins and Will, beginning with a BIM model.
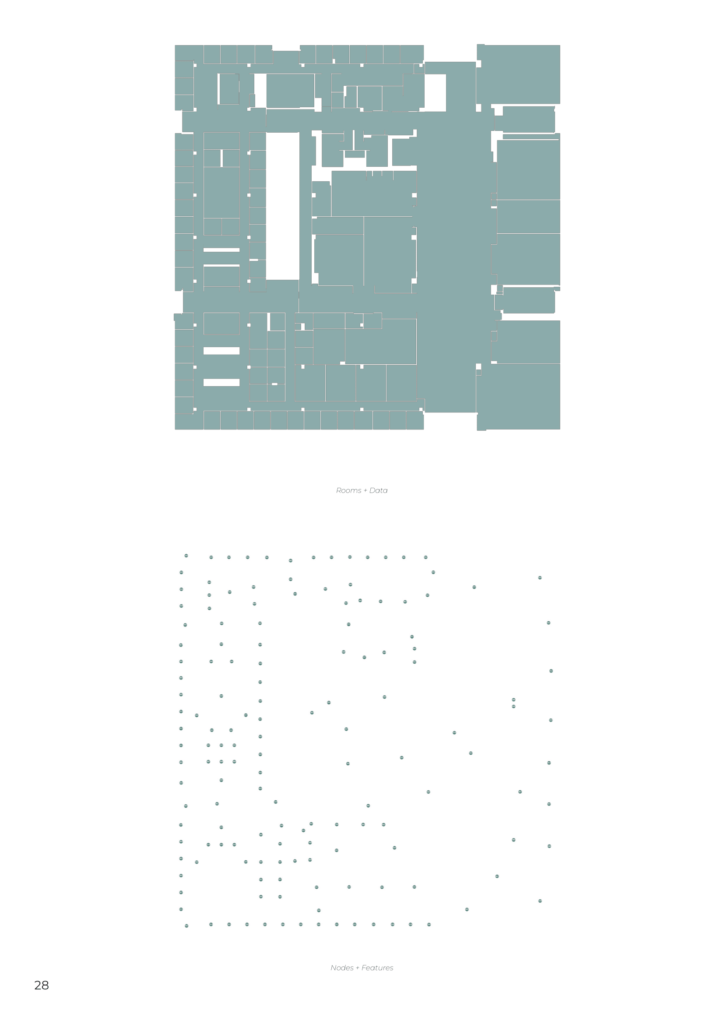
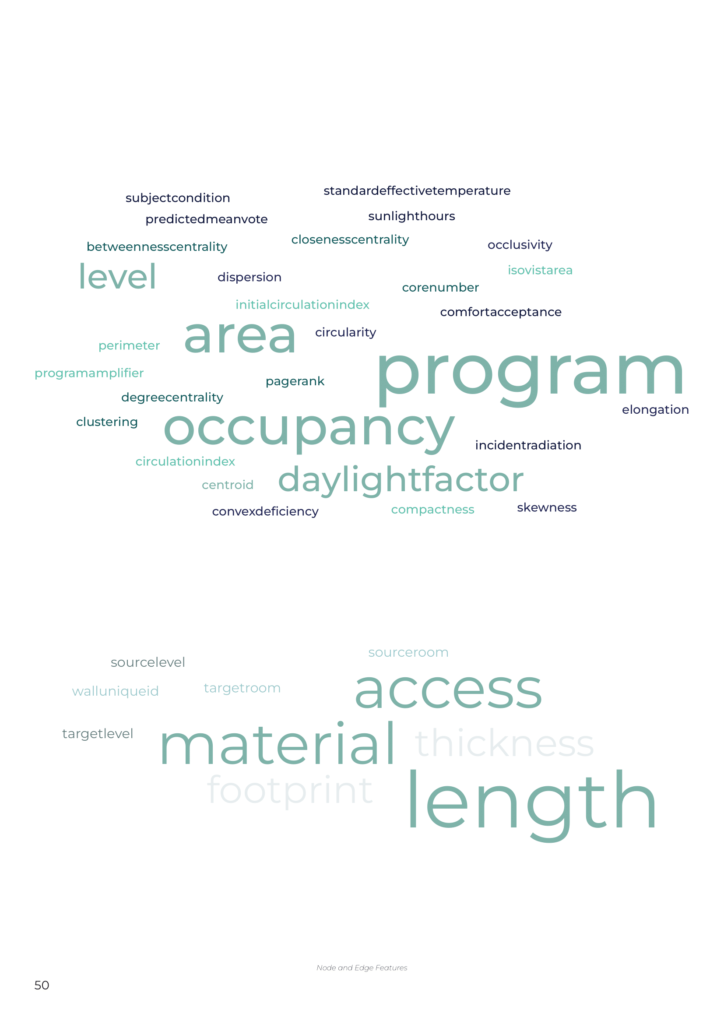
Our workflow emphasizes the transformation of rooms into graph nodes that incorporate several attributes. These attributes extend from basic geometric properties such as area, centroids, and polygons to more complex identifiers like adjacencies in the unique room IDs that using those IDs they can be traced back through a cloud platform like Speckle and scaled to purpose. These nodes serve as the foundational elements upon which the entire graph is constructed.
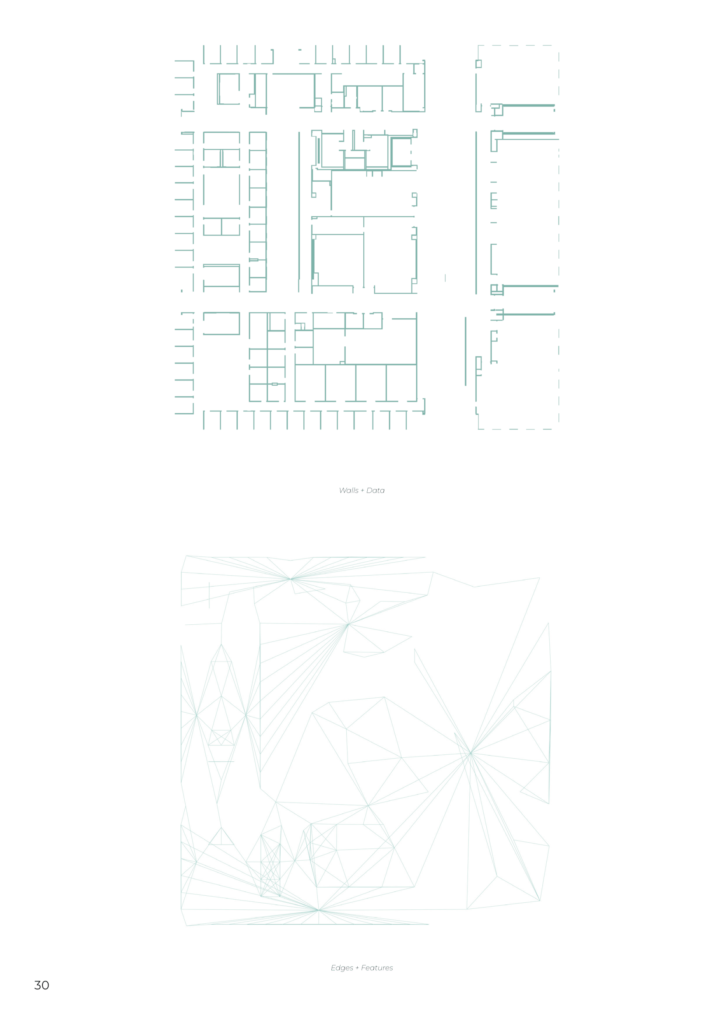
In this framework, the edges between nodes aren’t mere lines but encapsulate significant data regarding walls, their materiality, and typological features. This elevates the graph from a simple set of points and lines to an intricate relational model that can capture the complexities of real-world architectural spaces. The given edges include relative distances from each as weight while include a key for either they include a door (utilized for accessibility) or a window (utilized for isovist’s visual connectivity).
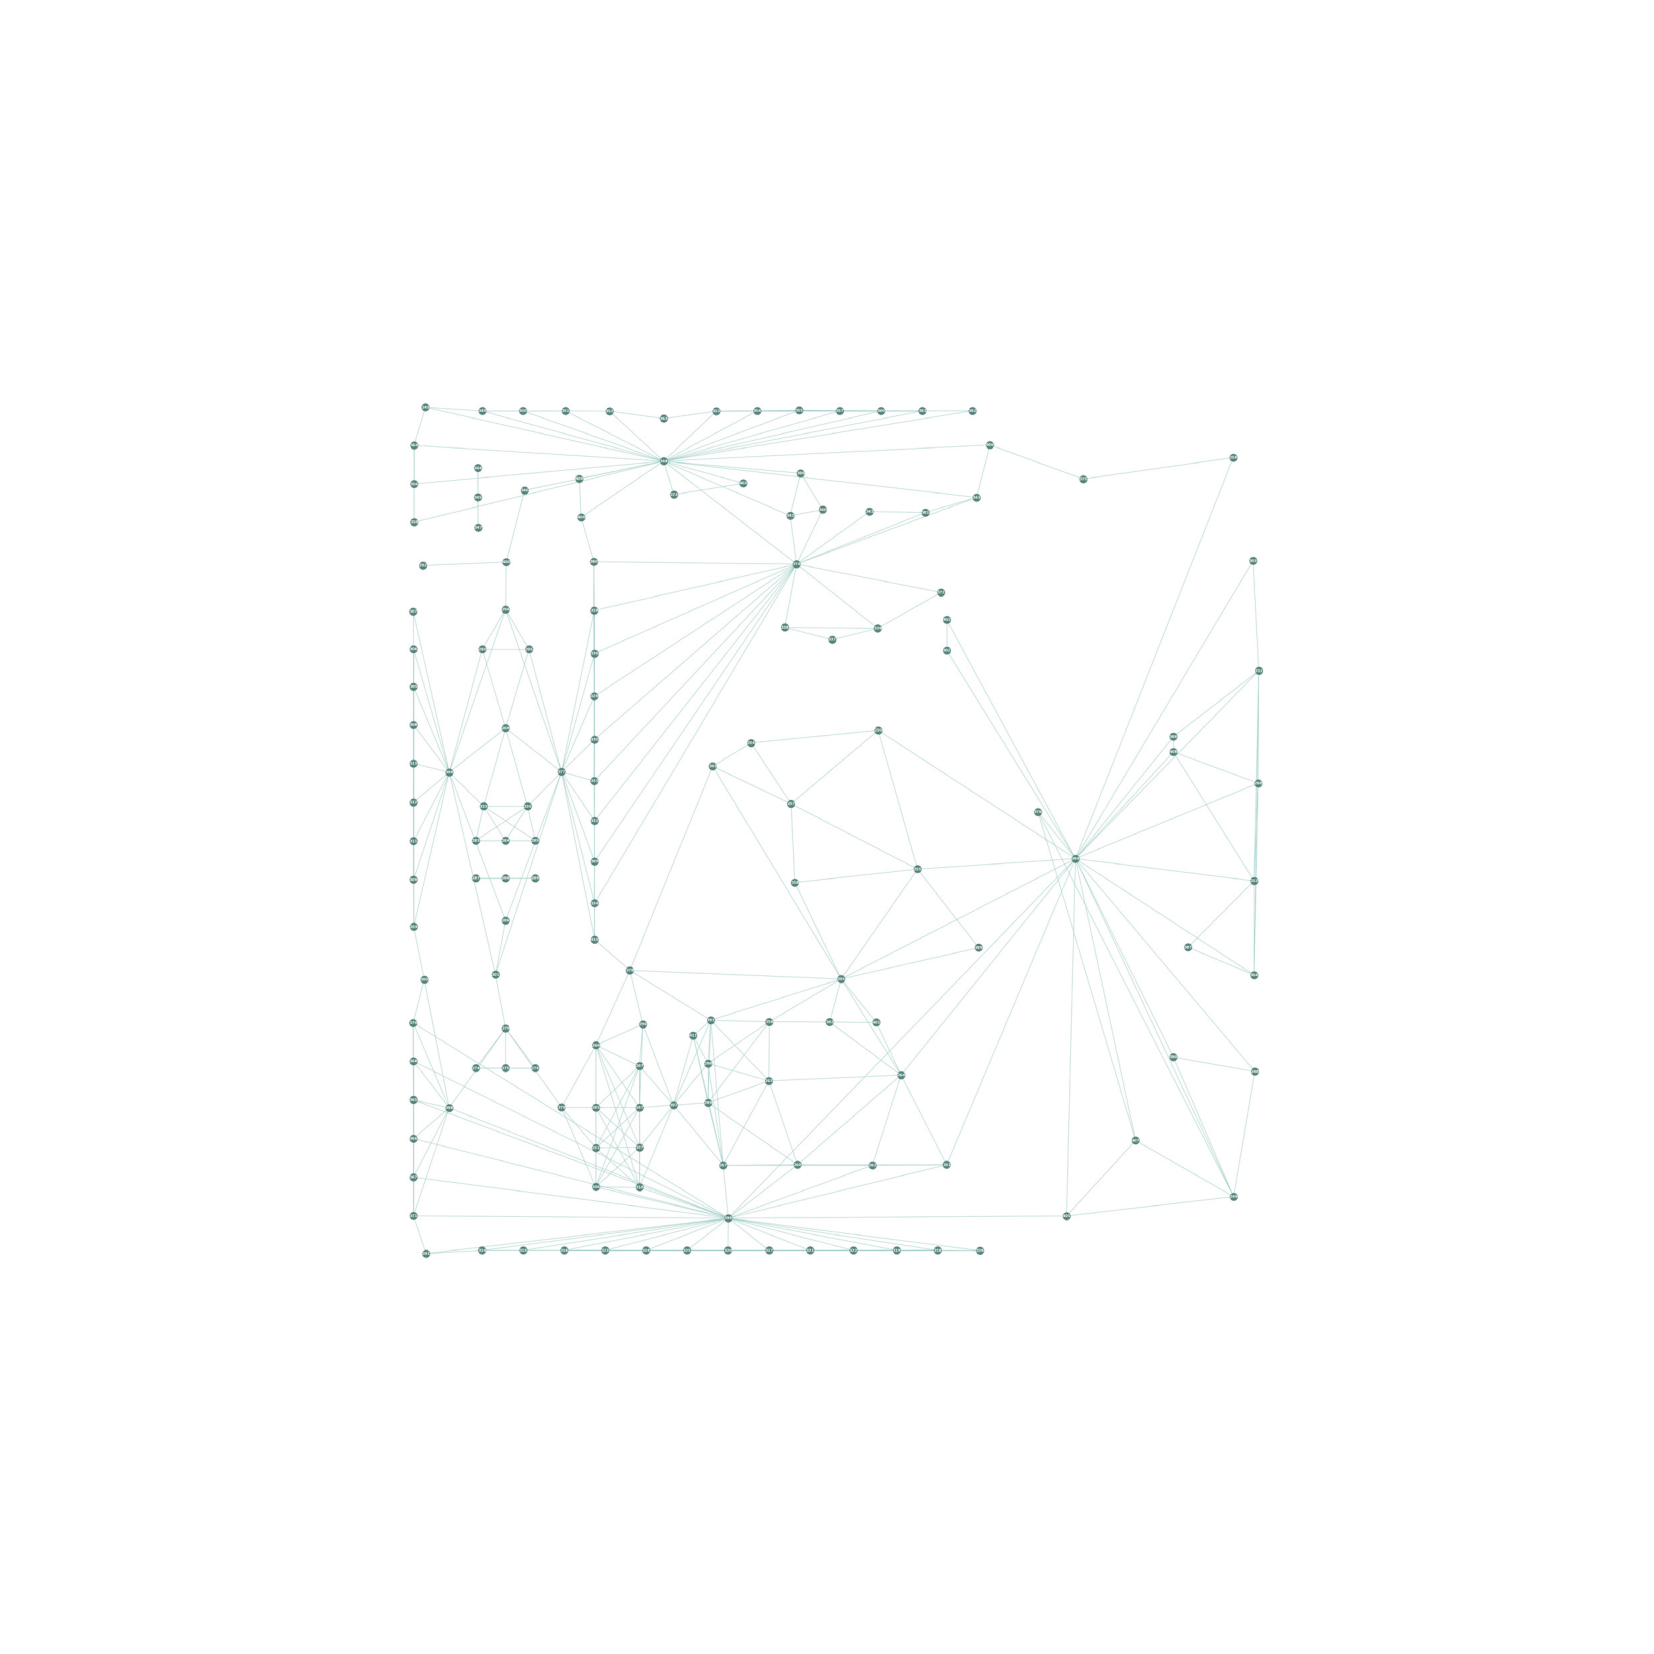
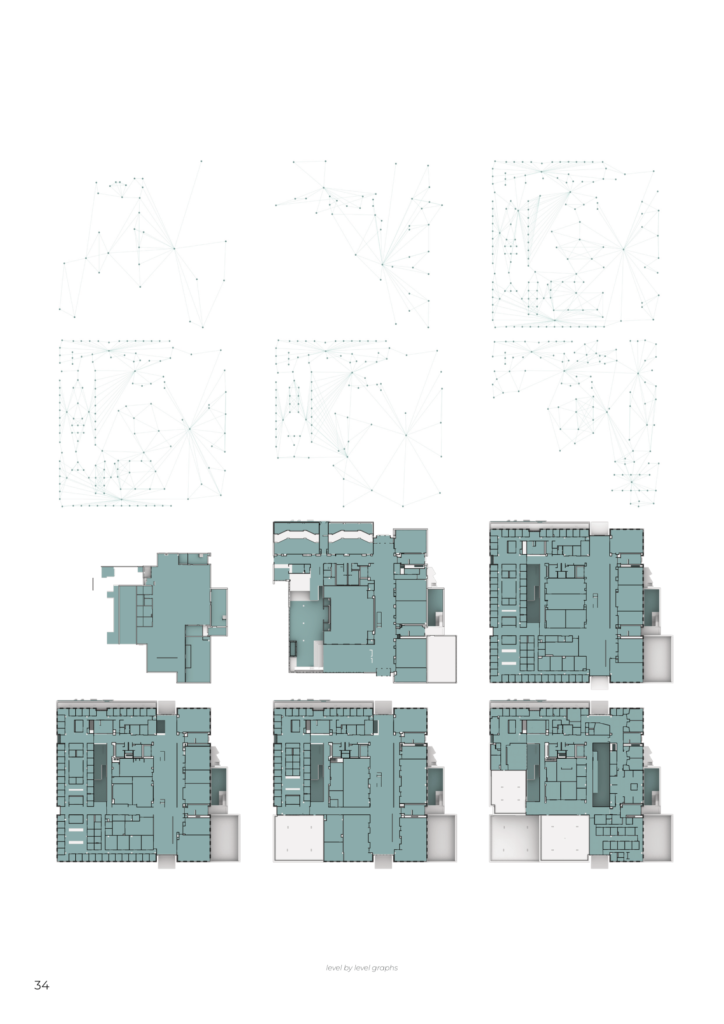
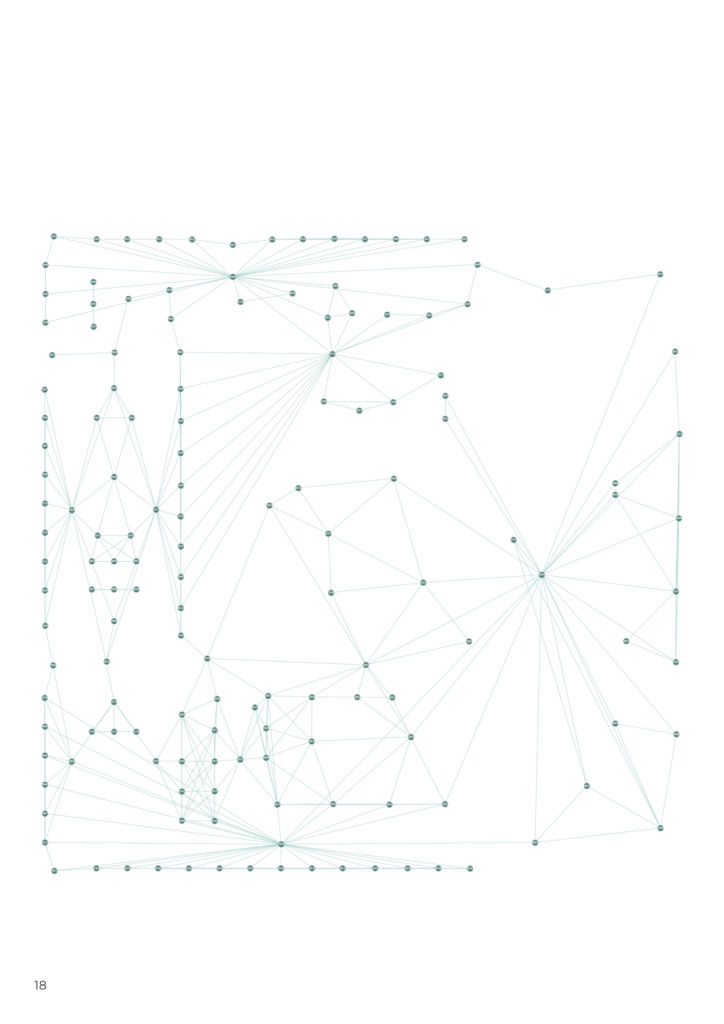
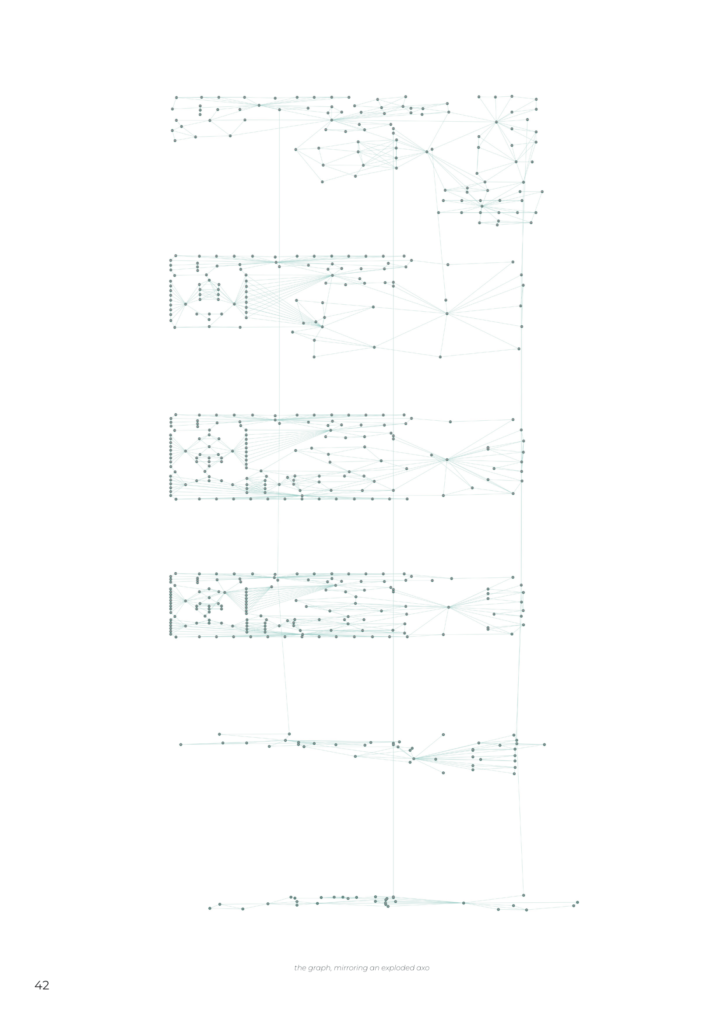
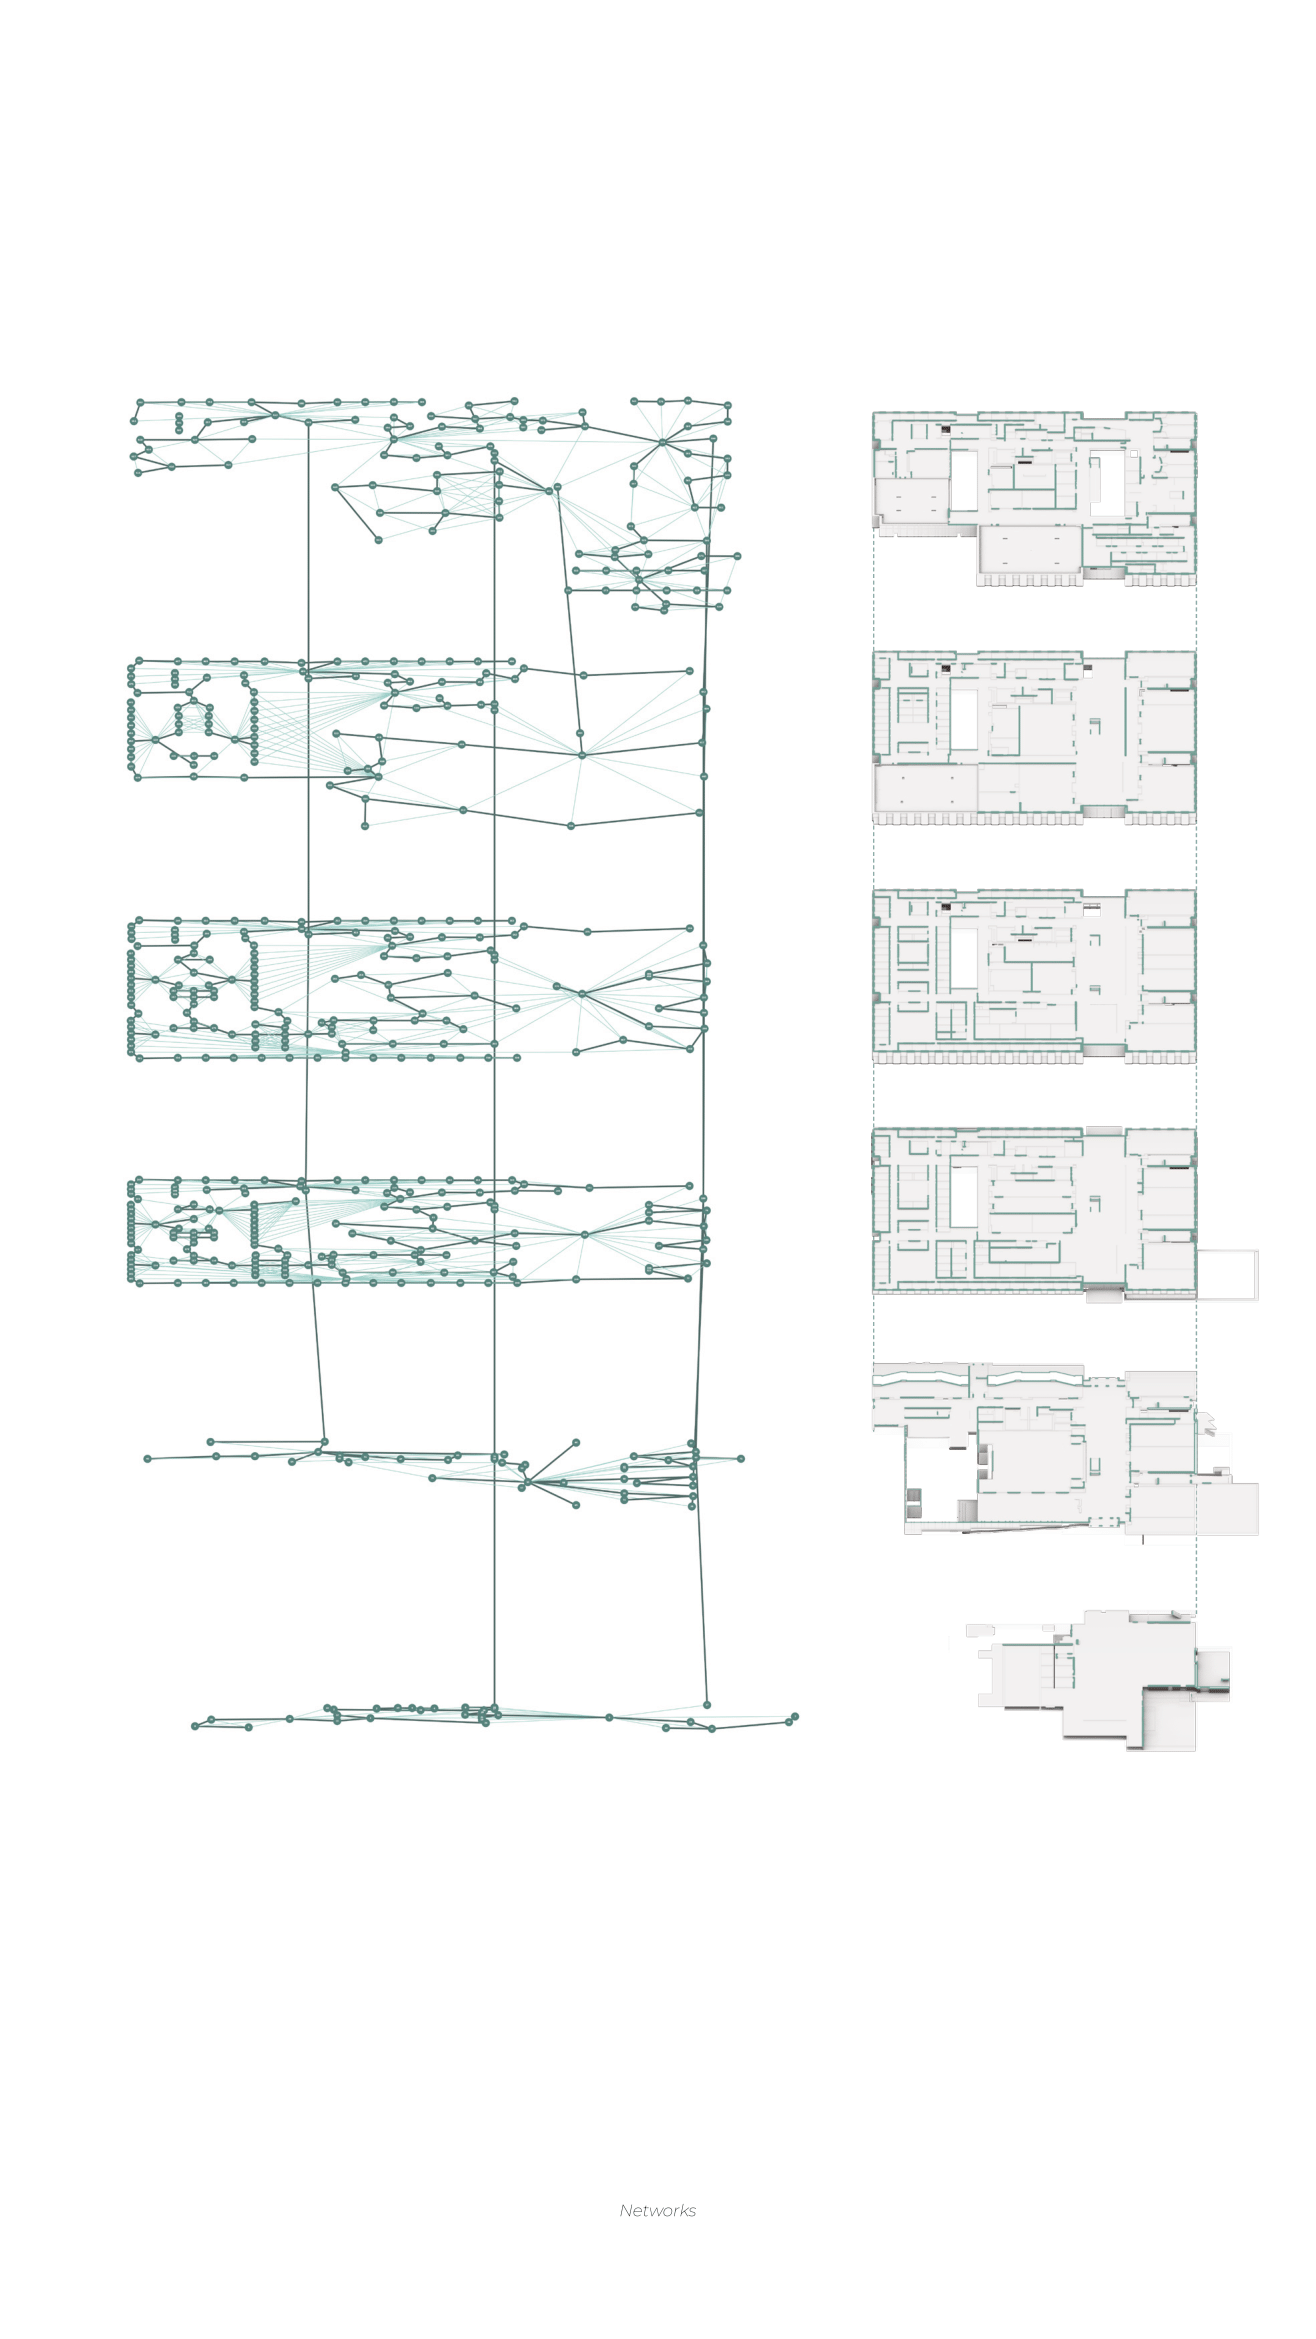
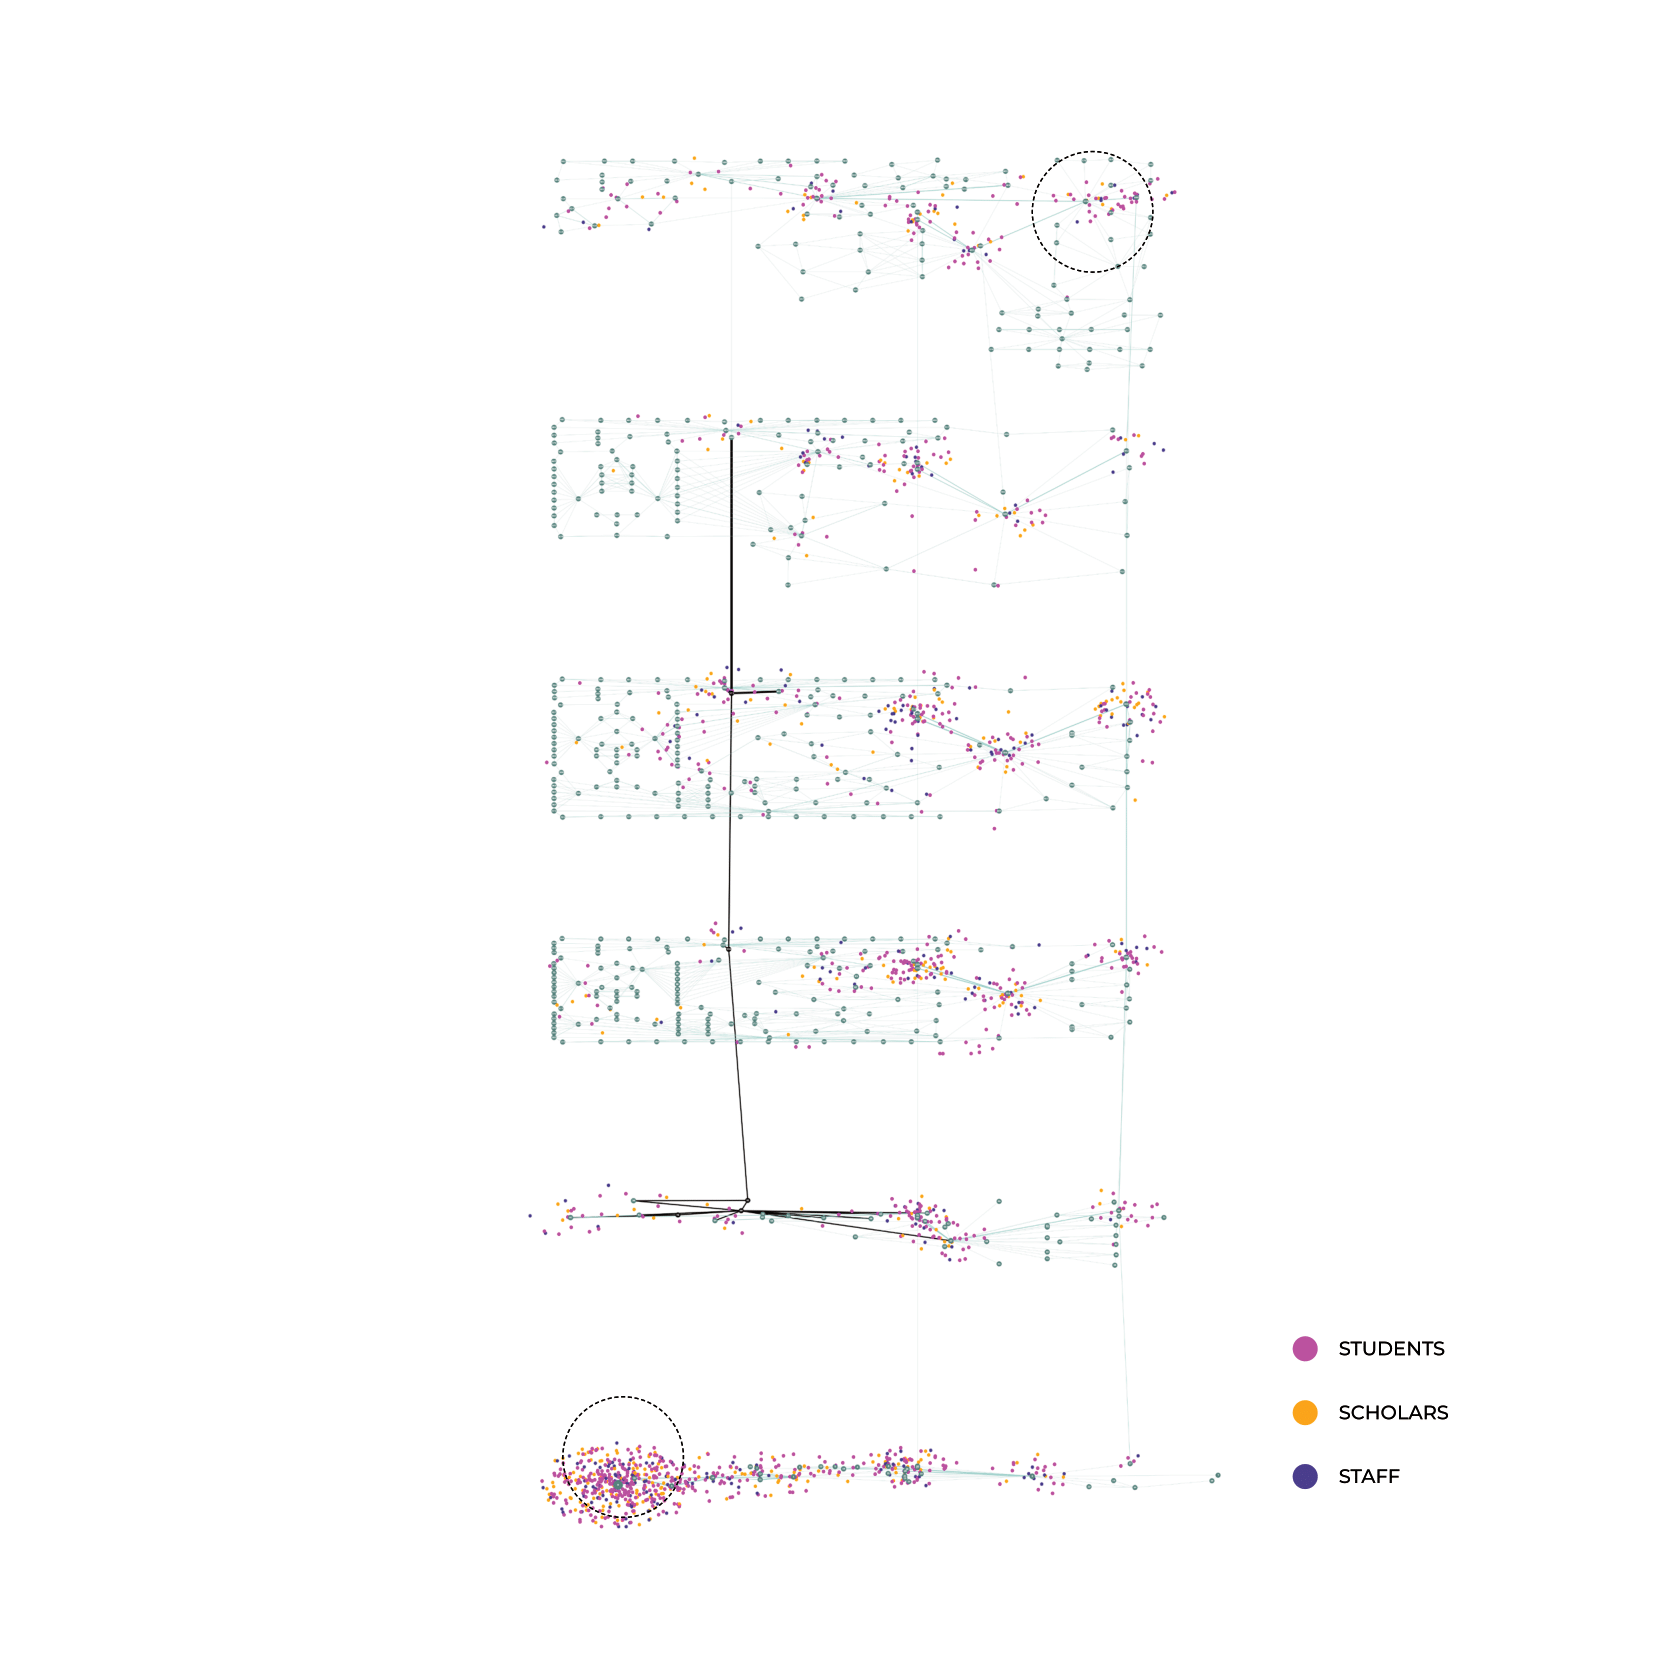
Hence, the graph layout used in the studies is fixed at one which resembles an exploded axonometric of the building. The study identifies the shortcomings of examining individual floors as isolated planar graphs. While such an approach can yield insights, it inherently lacks the capability to encapsulate the building’s full complexity. Therefore, the research adopts a multi-scale analytical lens by overlaying these planar graphs to form a 3D architectural graph utilizing vertical connections as the stairs and the elevators of the structure.
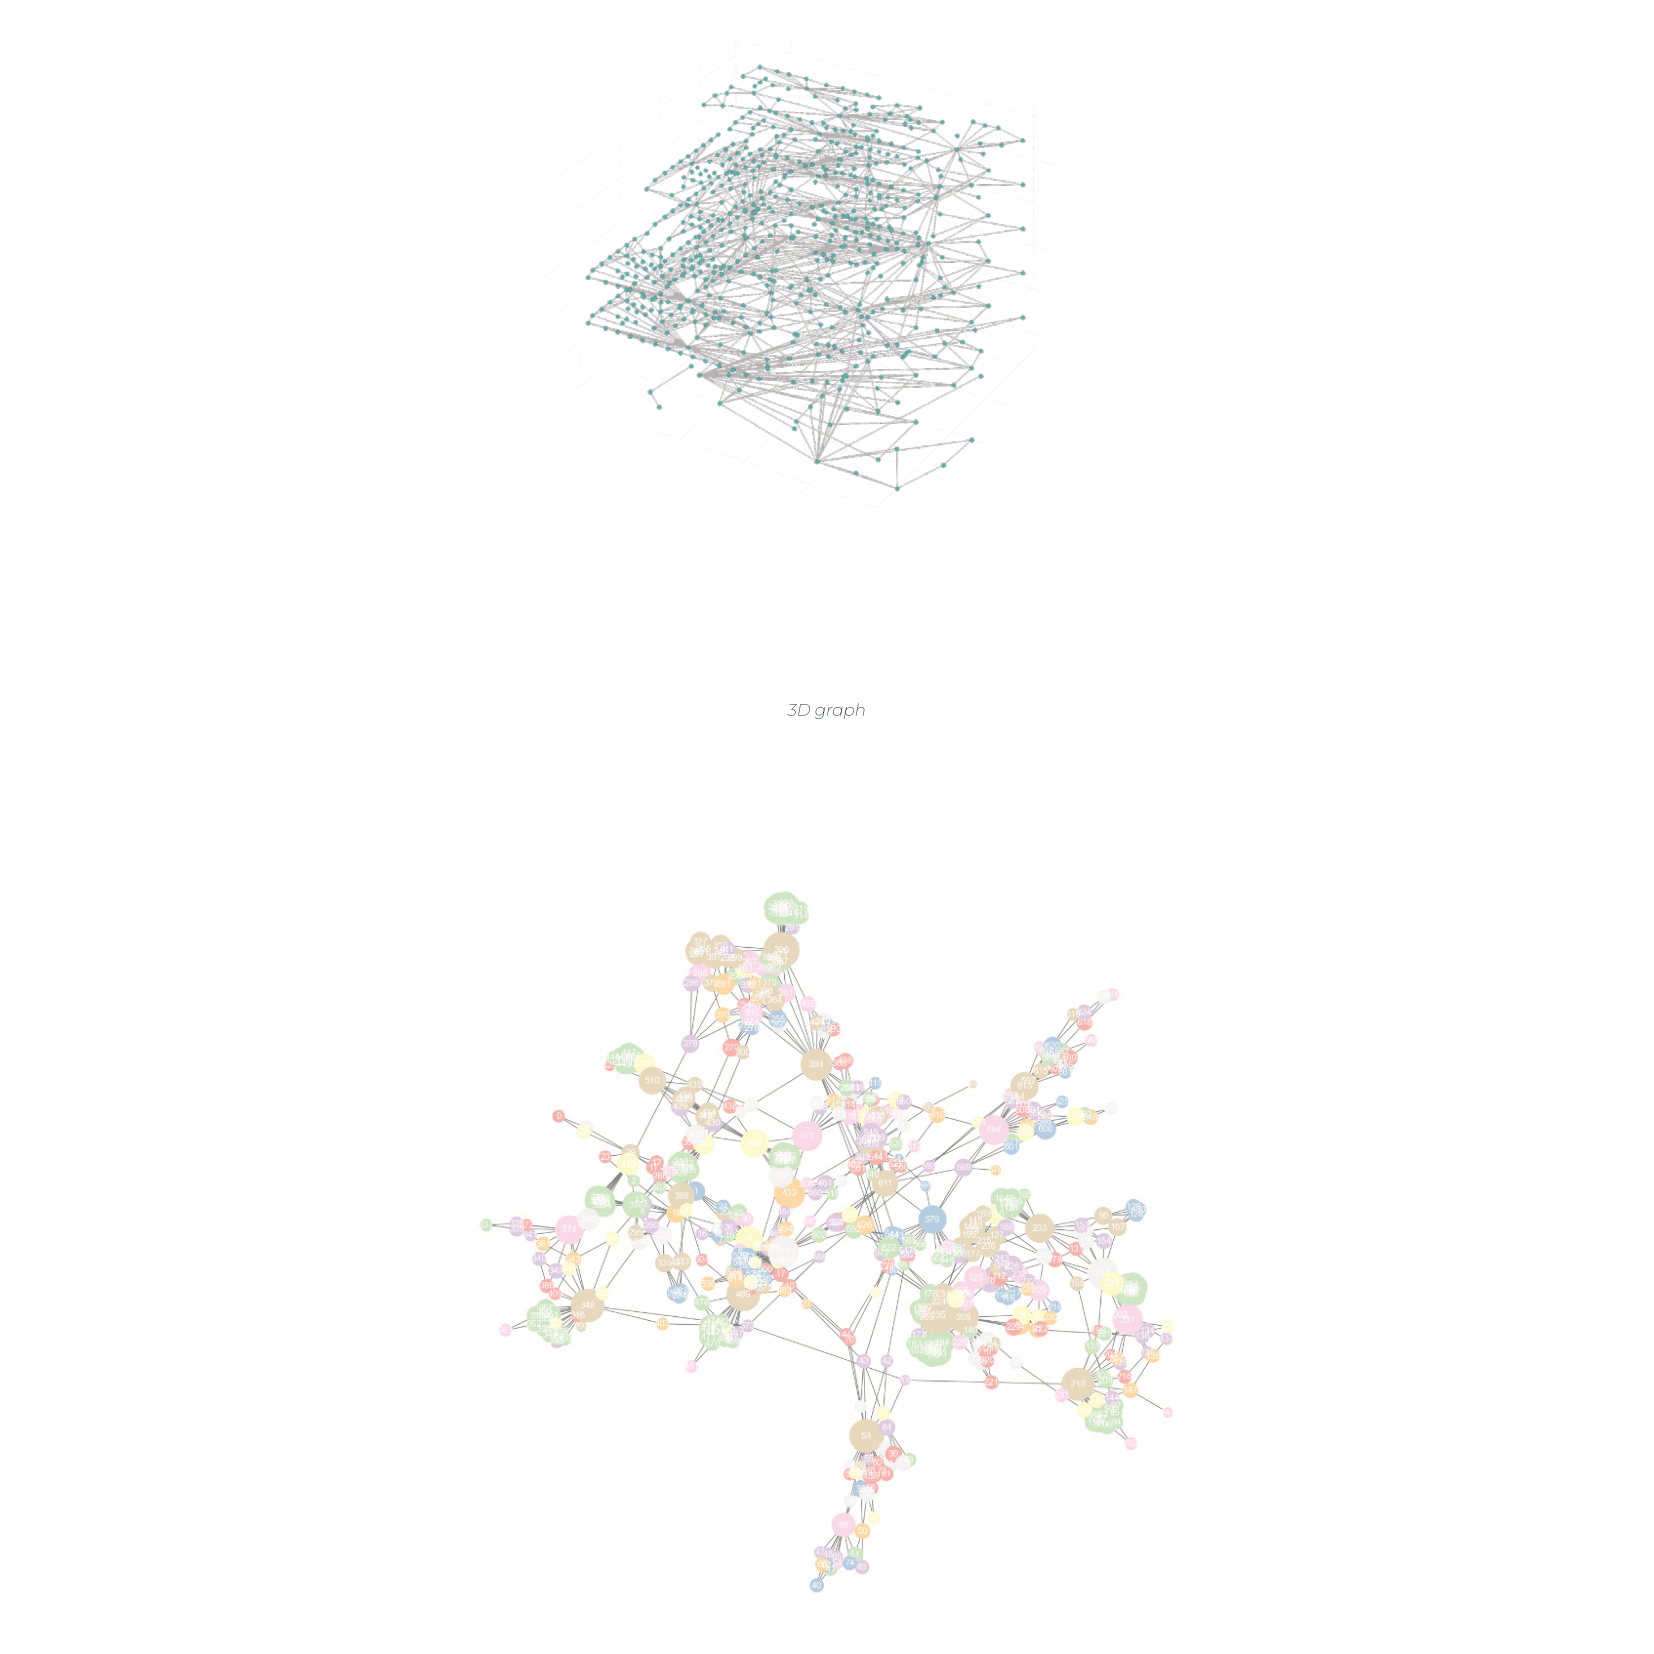
The research transcends the limitations of individual floor-based analyses by aggregating these planar graphs into a cohesive 3D structure. The vertical circulations such as stairways and elevators serve as the bridges that stitch these separate layers into a comprehensive model.
This approach results in a unified graph where one building is succinctly represented as a singular graph entity, while a subgraph network with the edges that permit accessibility is naturally structured.
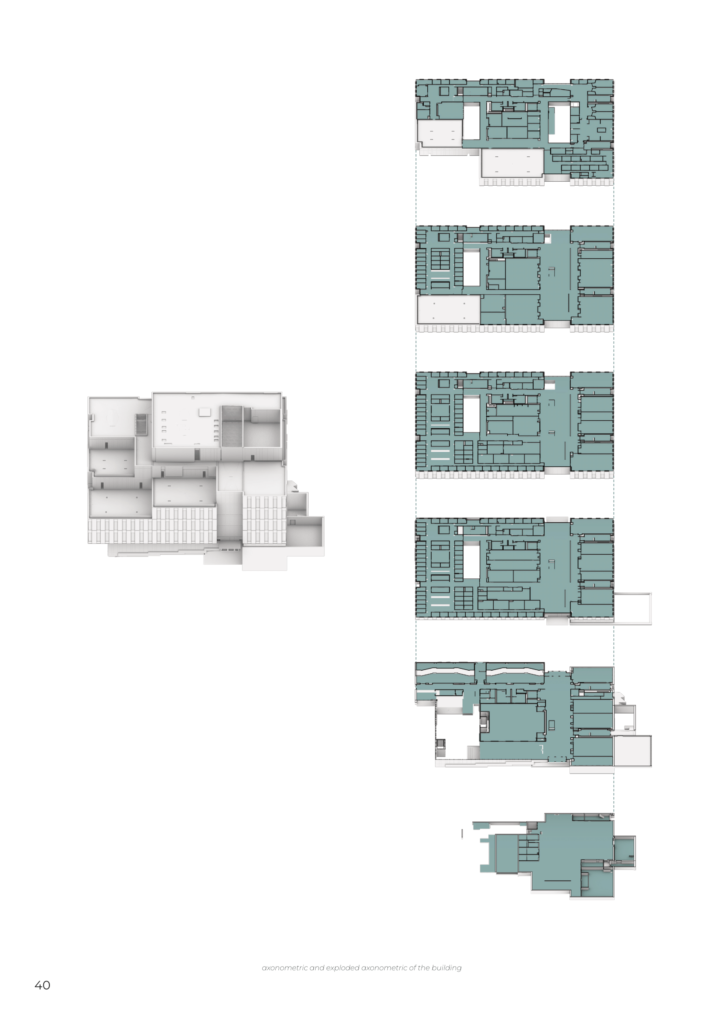
To facilitate reading and understanding the graph, we were interested in exploring a relationship between the graph and an exploded axonometric drawing, which also enables visualizing multiple parts of the building at once.
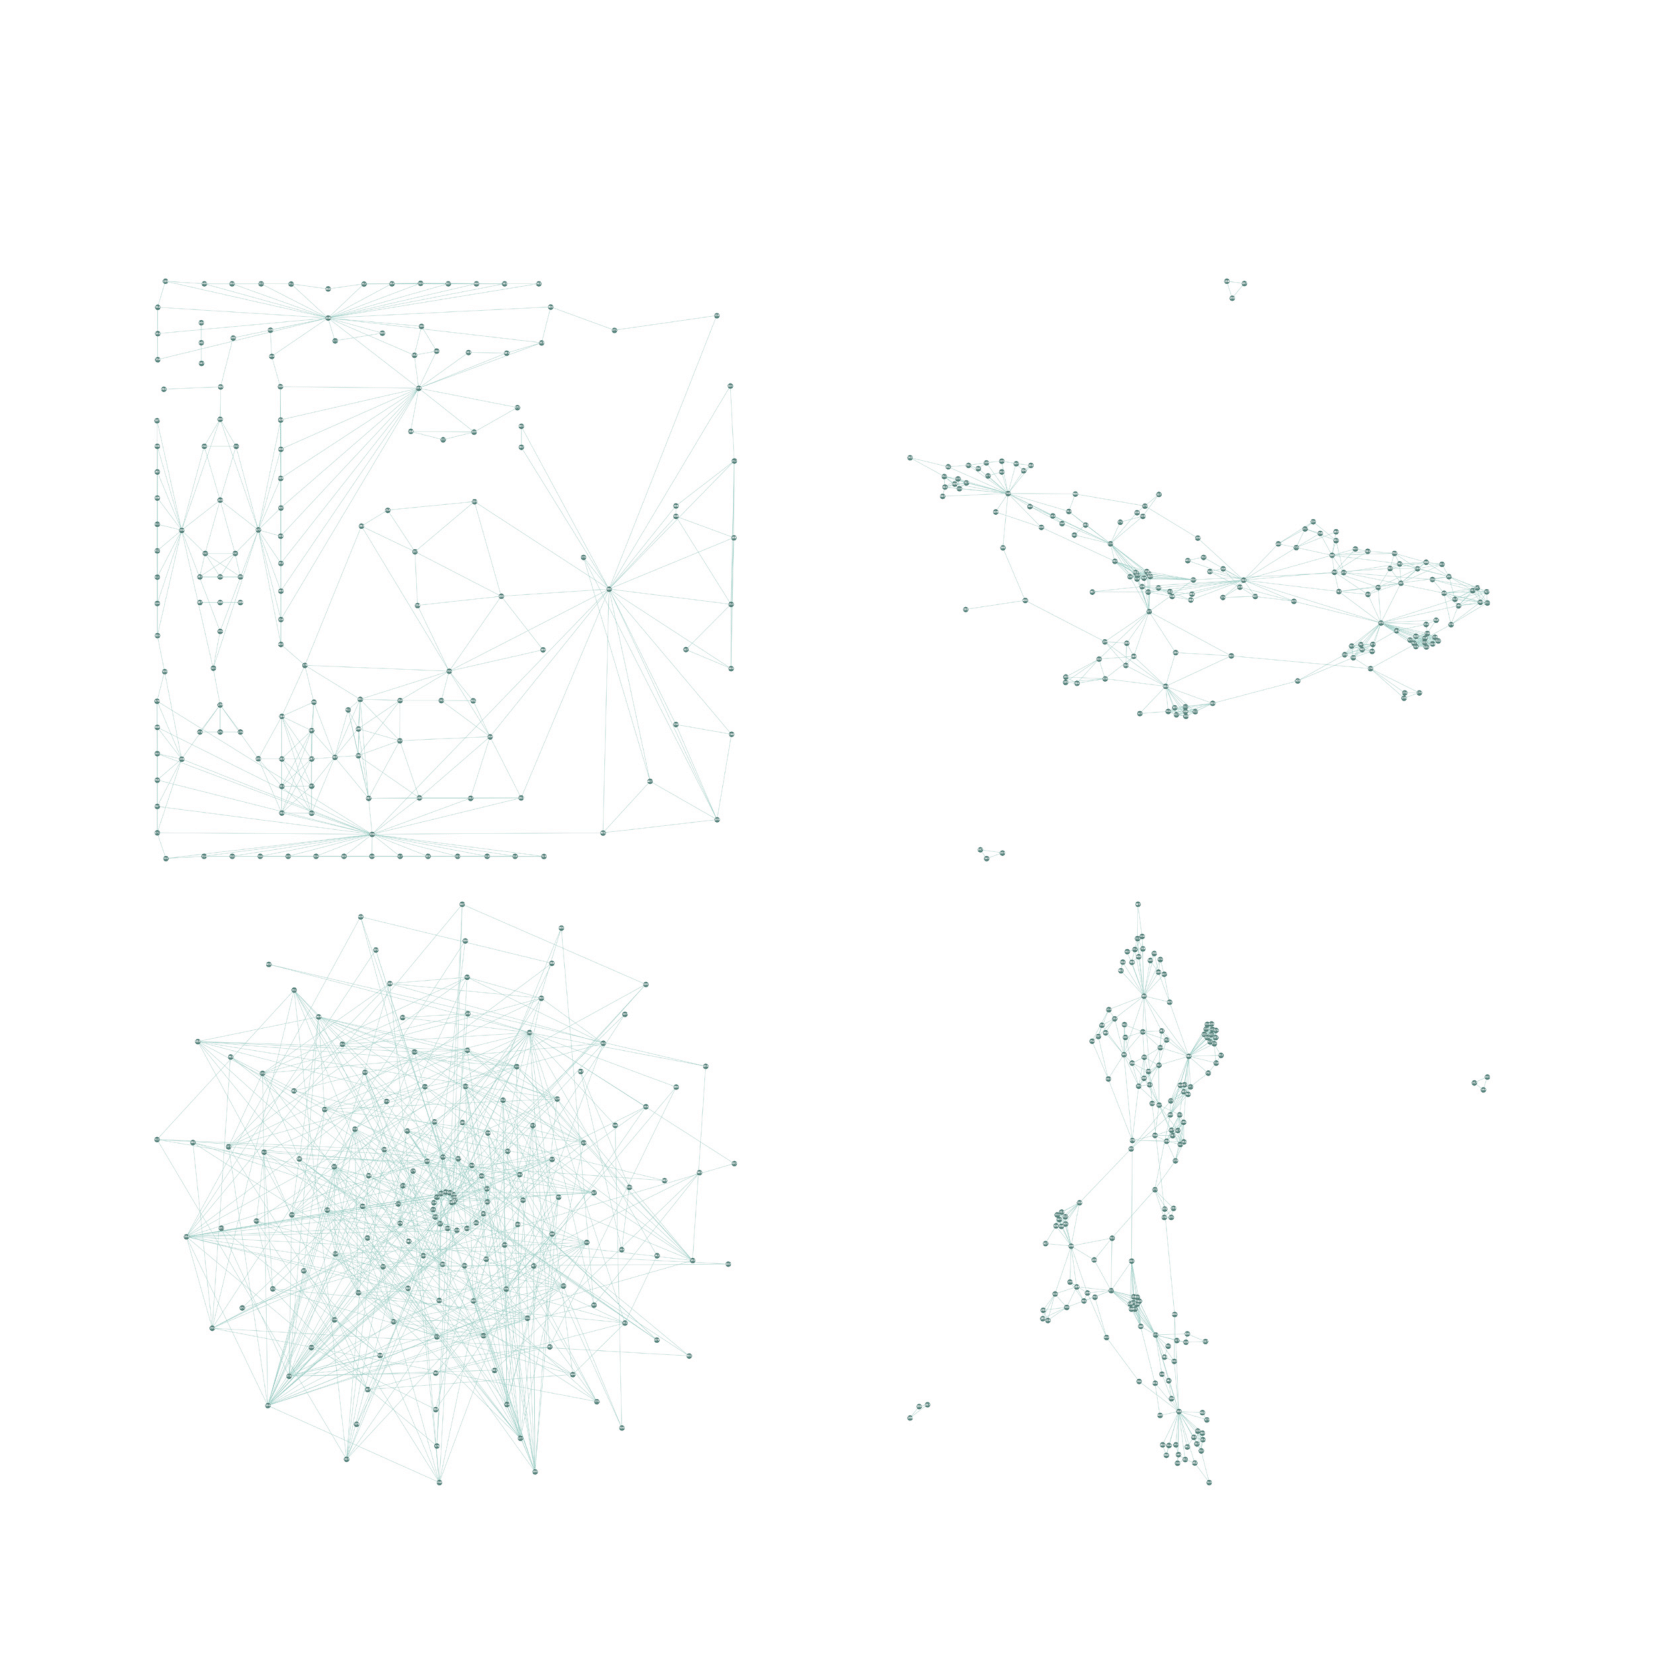
Graph Interactivity
While the graph may initially appear less intuitive in its visual language, there are strategies we can employ to enhance its connection to the architectural context. One approach involves crafting representations that evoke the building’s axonometric view, bridging the gap between the abstract graph and the tangible structure. Furthermore, interactivity plays a pivotal role in facilitating comprehension. By enabling users to interact with nodes and edges, such that additional information is revealed upon hovering for example, we offer a dynamic and informative experience that facilitates in understanding the graph’s intricacies. Moreover, user-friendliness remains a paramount consideration. Leveraging Natural Language Processing and word recognition code, we can streamline the process of querying data from the graph and customizing representations for specific analyses. For instance, a user’s desire to visualize the graph while considering node centrality, with the ability to set minimum and maximum node sizes, can be fulfilled in under a minute. This seamless integration of technology and user-driven customization ensures that the graph not only serves as a powerful tool but also as an accessible and adaptable resource, fostering a more profound connection between the abstract representation and the architectural reality it encapsulates.
Graph as Analytical Tool
By embedding data and features in the nodes and edges, the graph can be used to understand and analyze the building in different ways. Some examples of what can be done are in the following pages. One of the defining features of our graph-based approach to architectural analysis is the categorization of nodes based on the levels they occupy within the building. This vertical stratification allows us to understand spatial interactions and hierarchies across different planes, offering a nuanced look into the building’s complexity that goes beyond the traditional 2D floor plan. In our architectural graph, nodes are colored and sized based on their betweenness centrality—a measure indicating how frequently a node serves as a “bridge” along the shortest paths between other nodes. Understanding betweenness centrality is pivotal as it helps to pinpoint crucial zones that regulate flow and connectivity within the building network. Degree centrality, on the other hand, reveals the nodes with the highest number of connections, thereby unearthing hubs of activity or influence within the network. These hubs can often correspond to communal areas like lounges, or critical junctions that serve multiple functions, thereby indicating zones that may require special design considerations. Isovist area measurements enhance our spatial understanding by quantifying visibility and wayfinding capabilities from any given point in the space. This metric is invaluable for planning sightlines, ensuring security, and enhancing the user’s spatial awareness. The integration of bioclimatic metrics such as the Daylight Factor and Sunlight Hours serves as an indicator for sustainable design. These metrics not only quantify the amount of natural light permeating indoor spaces but are also direct indicators of thermal comfort, energy consumption, and even potential for vegetation growth. Predicted Mean Vote (PMV) gives us an insight into the average thermal comfort preferences of a large group of people, thereby guiding the design of spaces that optimize productivity and well-being. The Minimum Spanning Tree (MST) offers a skeletal structure that reveals the minimal set of edges connecting all nodes without any redundant connections. This representation is paramount in understanding the most efficient pathways within the architectural network. During the data filtering phase, edges that do not feature doors are classified as non-passable and are visualized distinctly in the exploded axonometric view. This segmentation contributes to a more accurate representation of navigable and non-navigable spaces within the building. We also employ algorithms for shortest-path network calculations, which illuminate the most frequented paths within the building. Such insights are invaluable, for instance, in calculating the shortest path between an office room and one of the main storage rooms. Visualizing these pathways can inform efficient layout design and can be instrumental in emergency planning. By weaving together these varied metrics and analytical tools, we construct a multifaceted graph that serves as a comprehensive analytical and design tool, capturing both the architectural and human-centric nuances of the building space.
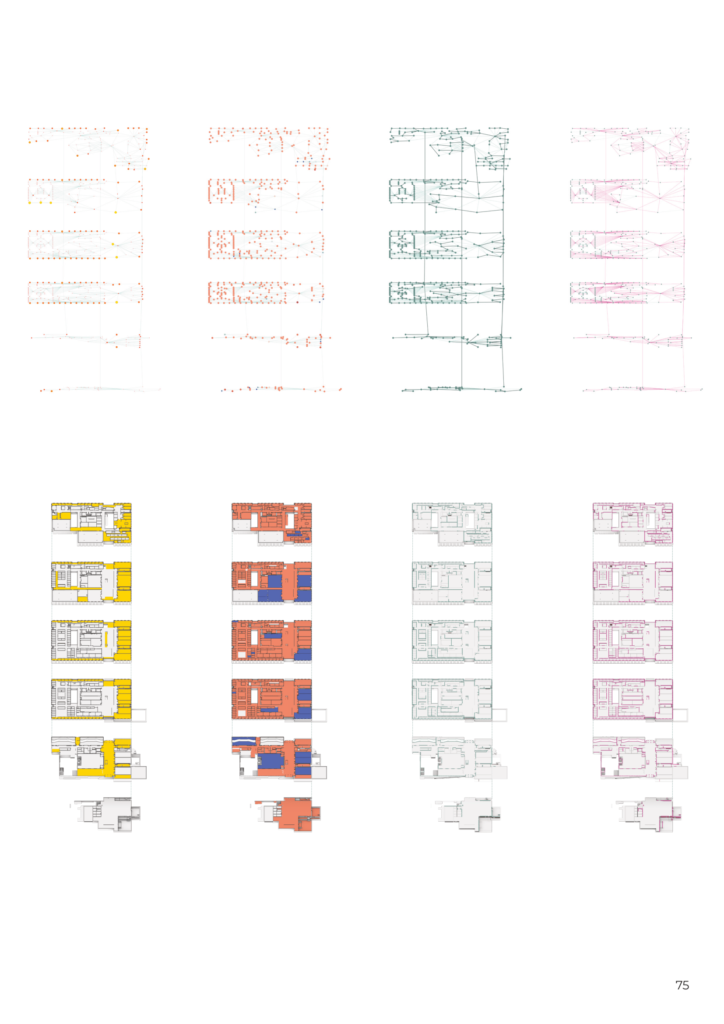
In summary, the potential for embedding an array of diverse information and data types within the graph is virtually limitless. As illustrated in our previous examples, we’ve demonstrated the integration of data pertaining to geometry, network connectivity, and energy dynamics. When we harmoniously juxtapose the graph alongside axonometric representations, we embark on a journey of enriched understanding, where the graph illuminates the axonometric view and vice versa. Moreover, amidst the myriad analytical possibilities, it is crucial to recognize that the graph’s utility in architecture extends beyond mere visualization. It emerges as a potent tool for supporting architectural evaluations, providing invaluable design assistance, and facilitating effective management and strategic planning. In this holistic role, the graph not only enhances our perception of architectural information but also actively contributes to informed decision-making and innovative architectural solutions.
Graph for Design and Planning
The versatility of a graph in design and planning transcends the life cycle of a building. Its utility spans across various phases, commencing in the construction phase, where it aids in design-related tasks. As the building comes to life, the graph continues to operate during the operational phase, offering indispensable support for logistical considerations. Furthermore, it extends its relevance into the post-operational phase, facilitating adaptive reuse
strategies and predictive analyses.
In the following sections, we will delve into four distinct scenarios that underscore the practicality of employing graphs in architectural endeavors. These scenarios encompass networks, restrooms, circulation patterns during routine and emergency situations. Notably, each scenario is examined through multiple lenses, including those of engineers, architects, administrators, coordinators, and the student body, highlighting the diverse perspectives that can harness the power of graphs for enhanced decision-making and informed design and planning strategies.
Networks
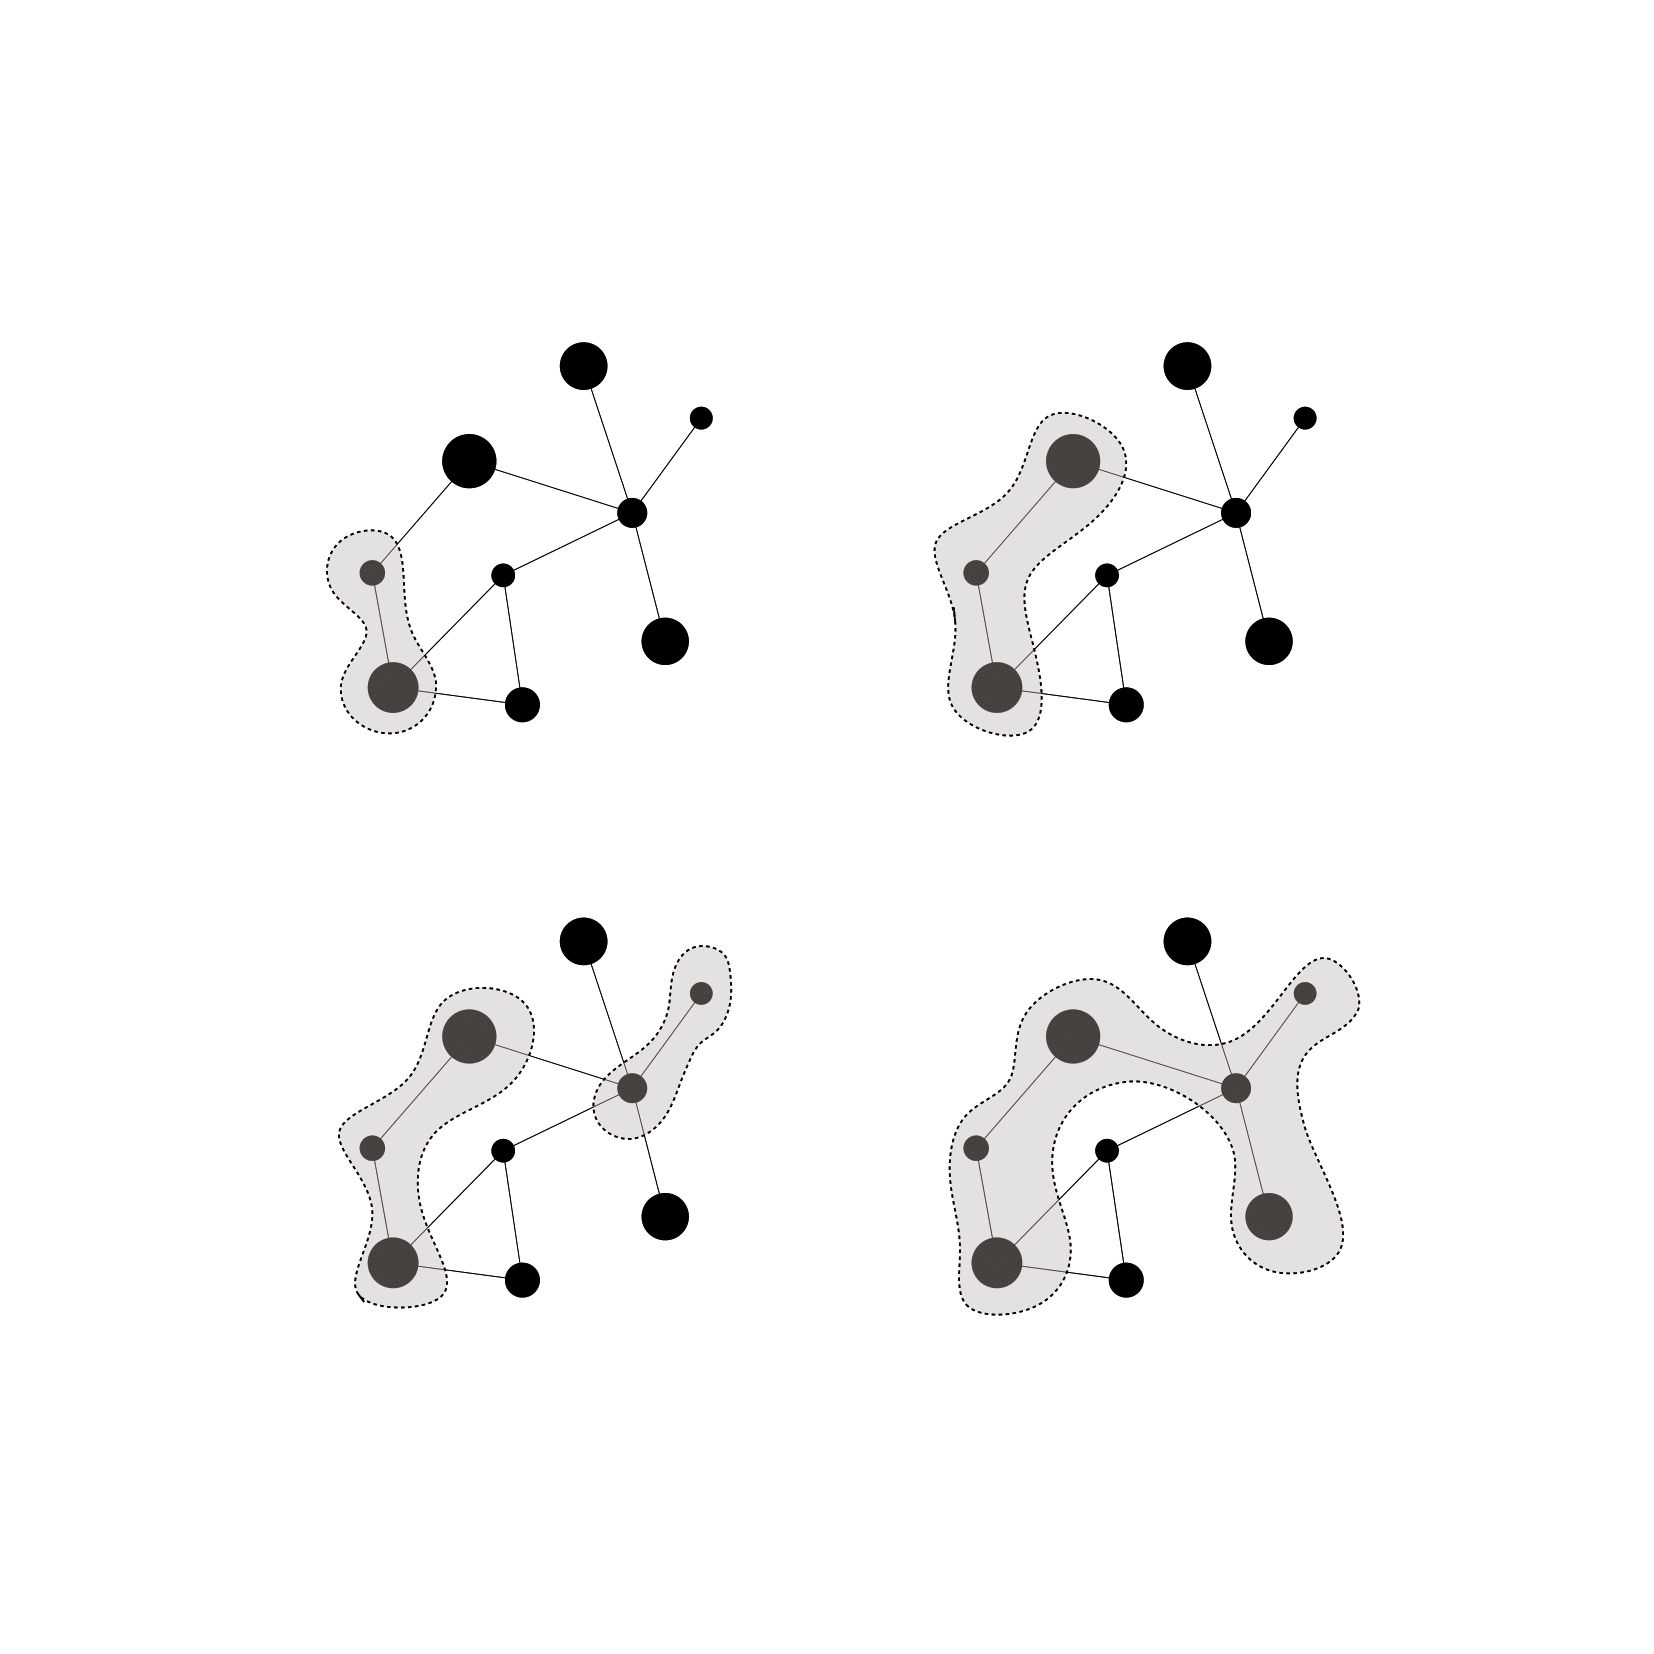
One particularly insightful application of the minimum spanning tree graph lies in the realm of infrastructure planning. In this context, engineers can rely on the edges of this graph as a guiding framework for optimizing the placement of cables within an electrical layout. By leveraging this graph, engineers can achieve a delicate balance, minimizing costs while simultaneously maximizing operational efficiency.
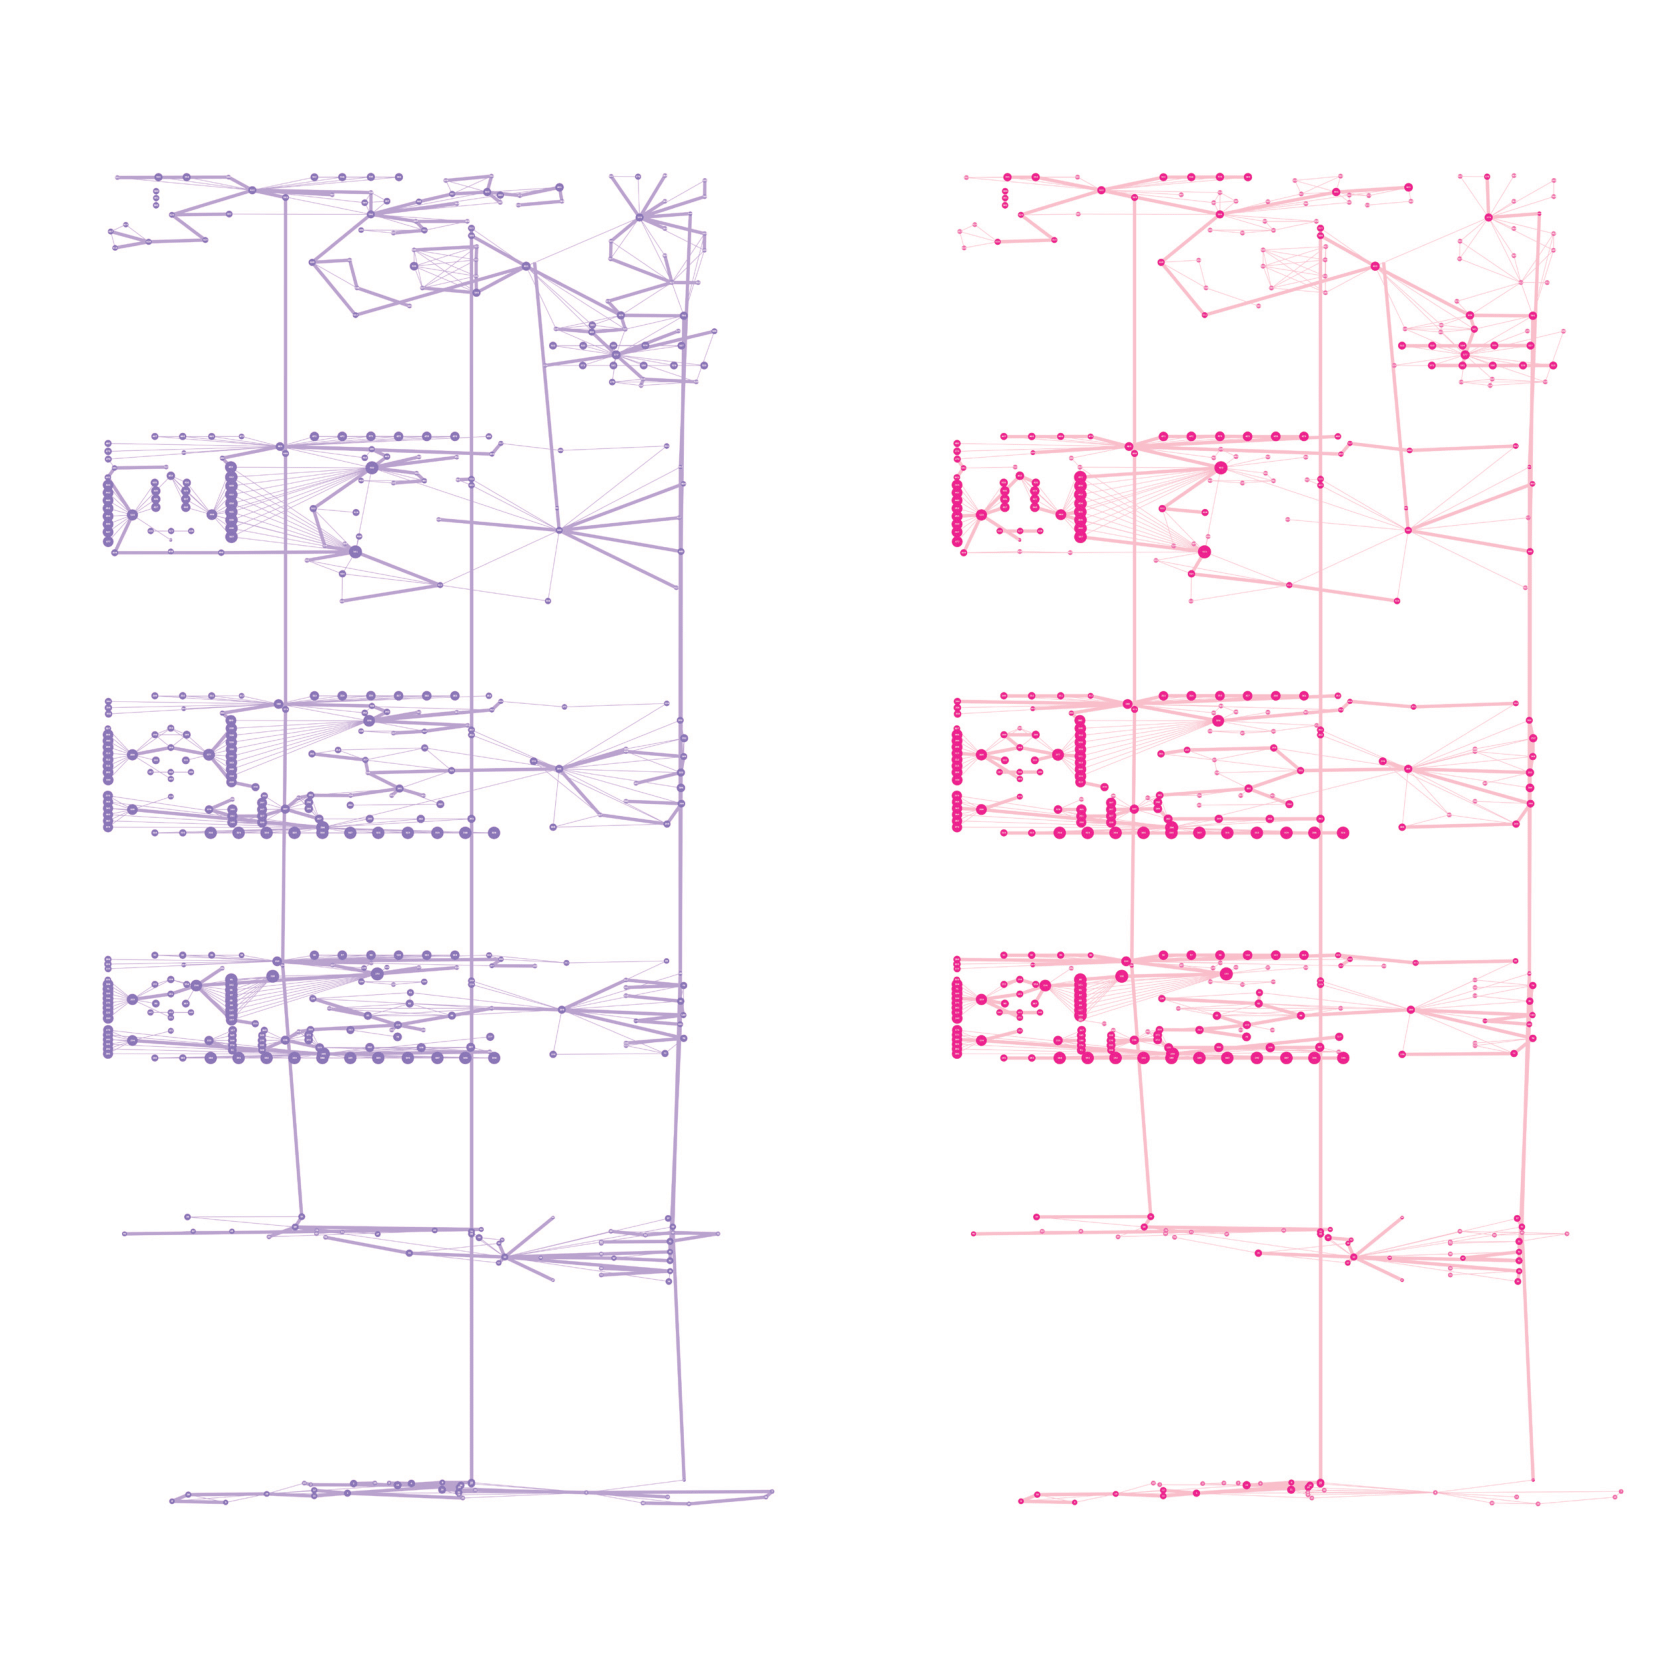
Toilets
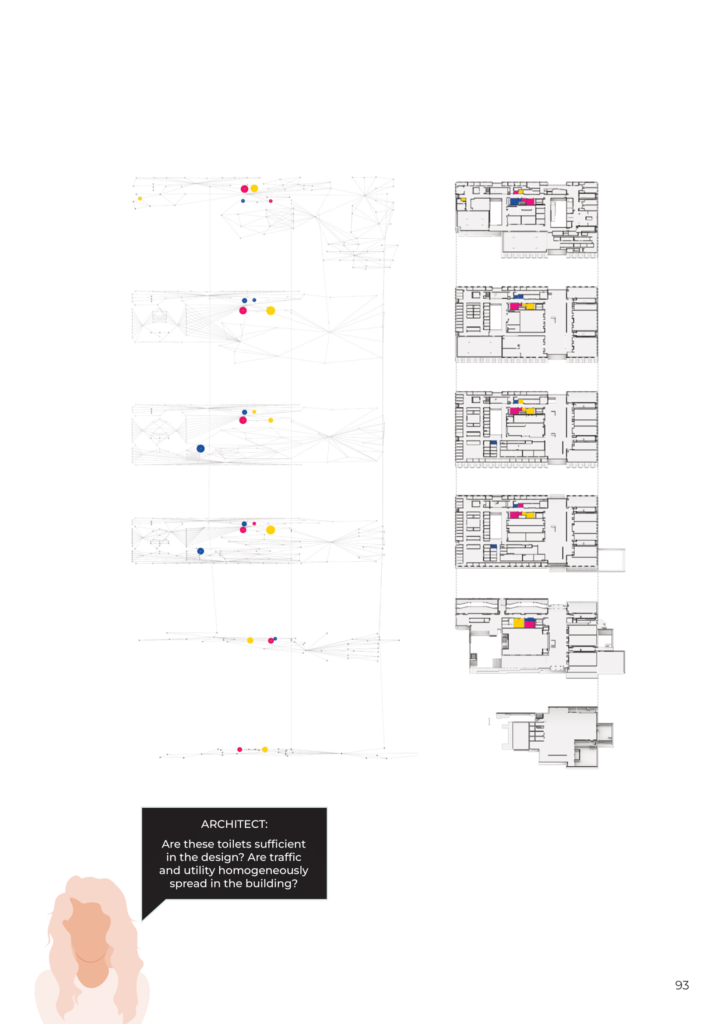
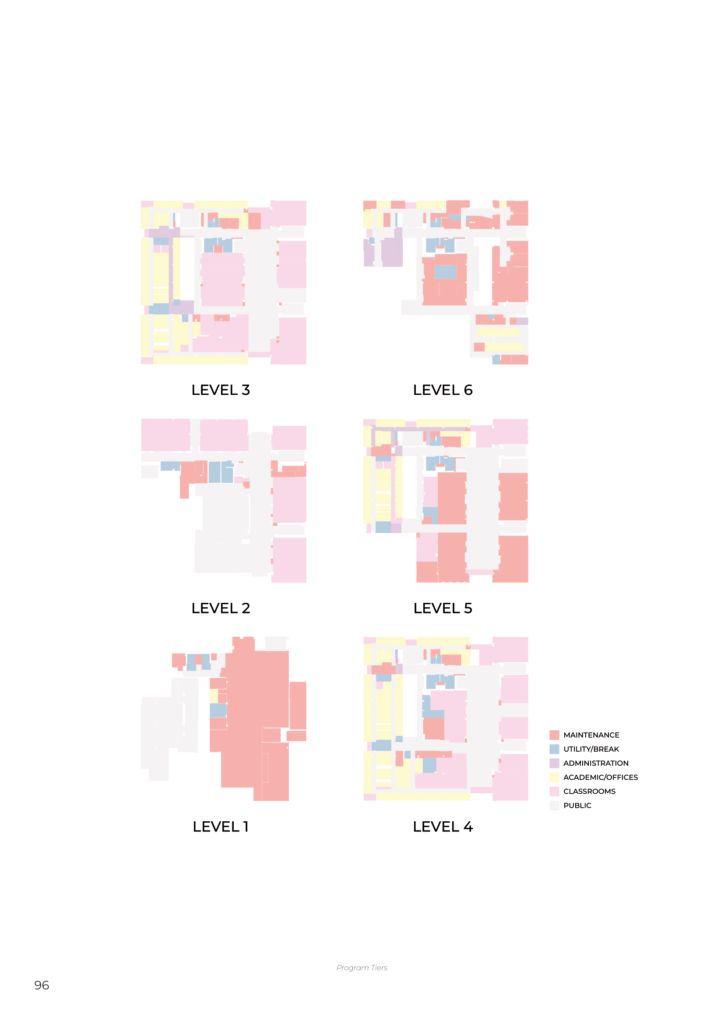
For an architect, an insightful use of graphs comes into play when evaluating the operational efficiency of the building’s restroom facilities. By mapping each toilet with a distinctive color, an intricate image emerges. This mapping allows us to discern which rooms each toilet serves, shedding light on traffic patterns and overall utility.
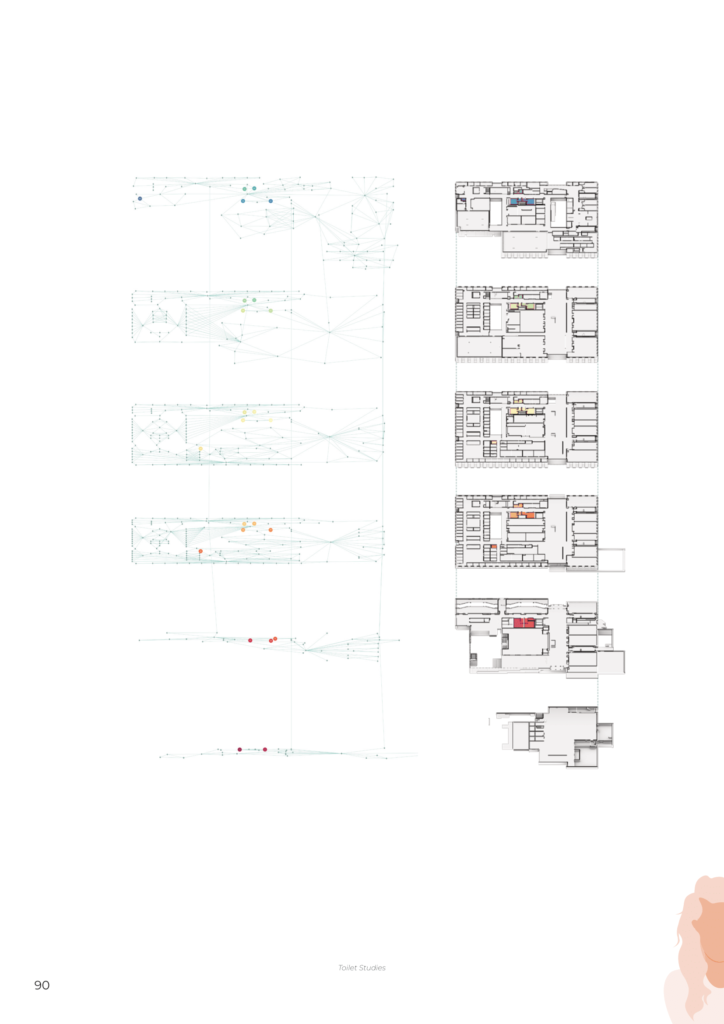
For instance, upon analysis, it becomes apparent that toilets labeled as #134 and #461 experience a notably high occupancy rate. In response, the architect
can strategize by adding additional toilets nearby to distribute the usage load more evenly. Furthermore, this wealth of information extends its usefulness to building
management. It can guide decisions, such as determining which toilets require more frequent cleaning due to higher usage. Looking ahead, the graph also becomes a valuable asset for long-term planning. It can assist in categorizing maintenance and renovation efforts, effectively phasing them into manageable stages, as illustrated here, where we’ve divided them into three distinct phases.

Circulation on a Typical Day
Prior to initiating the simulation, a classification schema was developed for the diverse assortment of room names within the model. Super-groups, including maintenance, utility, administration, academic spaces with offices and classrooms, and public spaces, were thereby constituted.
The landscape of the graph was employed as the milieu for agent-based movement, wherein three distinct classes of agents were identified:
- Students, whose objective encompasses classroom occupation and, in instances of high occupancy, the identification of the shortest path to proximate workstation rooms.
- Academics, who either assist in student-occupied classrooms, form research group labs, or occupy corresponding offices.
- Staff members, who predominantly circulate within administrative quarters while occasionally conducting checks within utility-maintenance rooms.
Before the simulation’s commencement, algorithms with varying parameters were deployed to each class for ergonomic route generation. As indicated by the preliminary sketches, each class engaged in pathfinding towards the most ergonomically favorable nodes within close proximity like a cellular ingestion process.
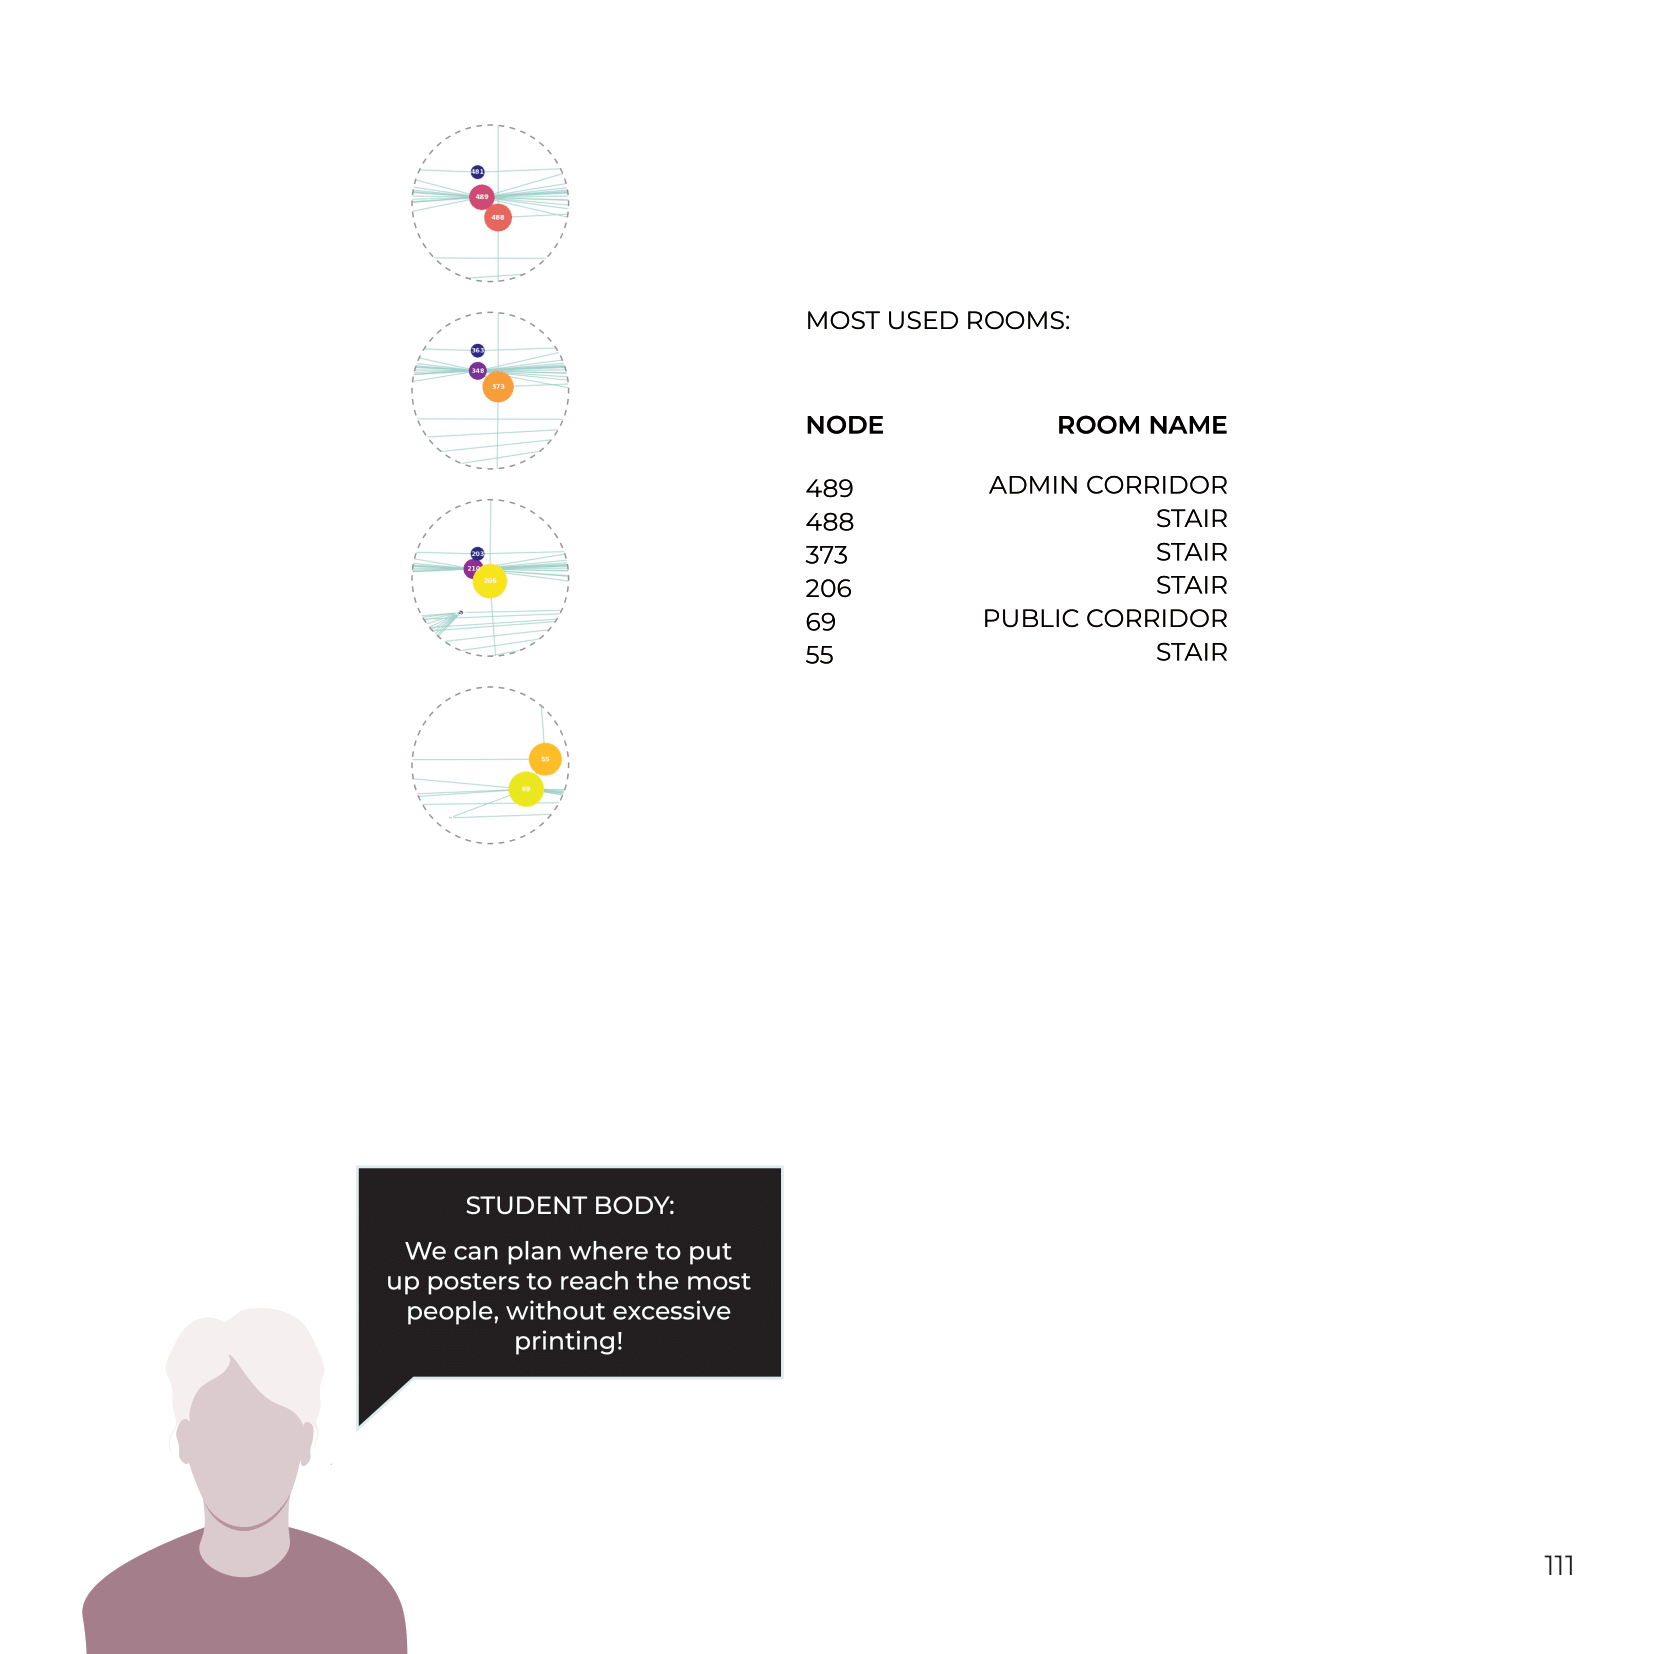
Data extracted from the simulation was employed for diverse applications, including but not limited to, planning announcements, event coordination, and poster placement. For emergency scenarios such as fire outbreaks, pathfinding algorithms were augmented with additional parameters for randomness, compact space avoidance, and preference for high centrality nodes.
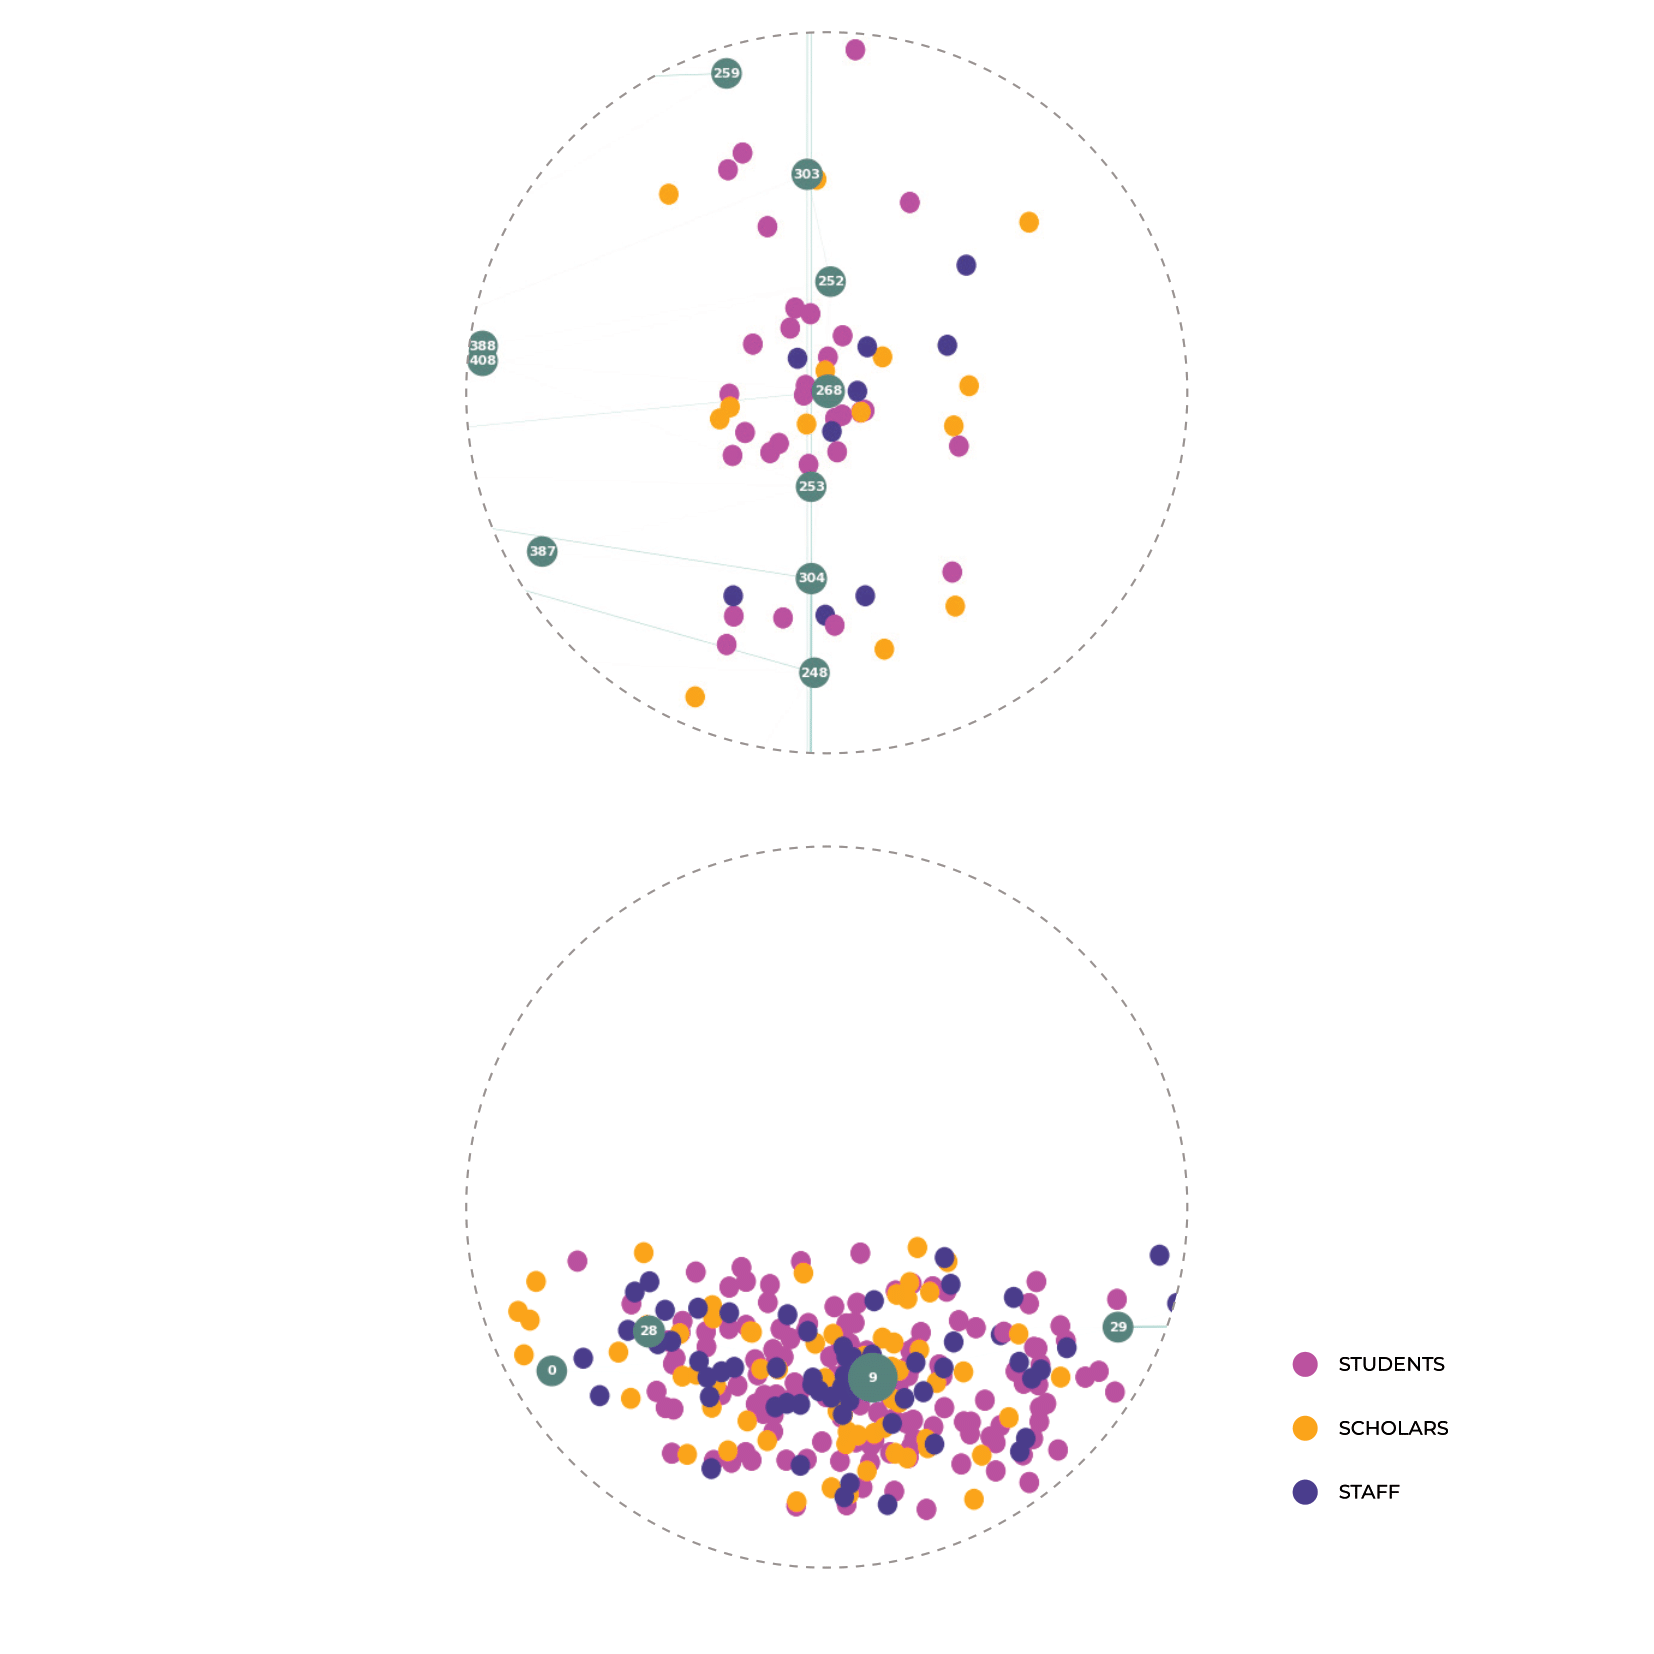
Class Time
In an endeavor to simulate a realistic spatial dynamic, agents are strategically positioned within an approximate radius of their assigned classrooms prior to the initiation of academic activities. Subsequently, both academics and students are systematically allocated to classrooms. In instances of high occupancy, students recalibrate their paths to relocate to proximal workstation rooms, thus availing themselves of remote lecture viewing facilities nearby.
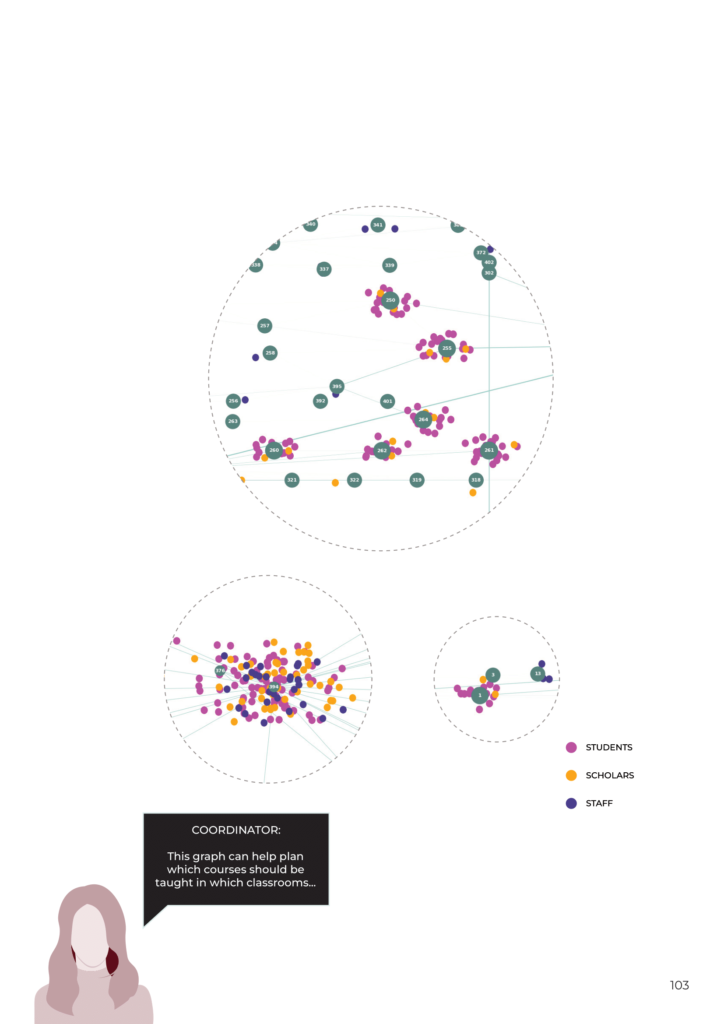
Lunch Time
A particularly intricate challenge lay in the formulation of a catalog encapsulating the varied behavioral tendencies of agents during lunch intervals. To address this, a two-tiered preference system was designed. Initially, agents demonstrate pronounced preferences across three categorical domains: environmental (those with an affinity for sunlight), spatial (those requiring specific geometric configurations), and social (those necessitating interpersonal interactions).
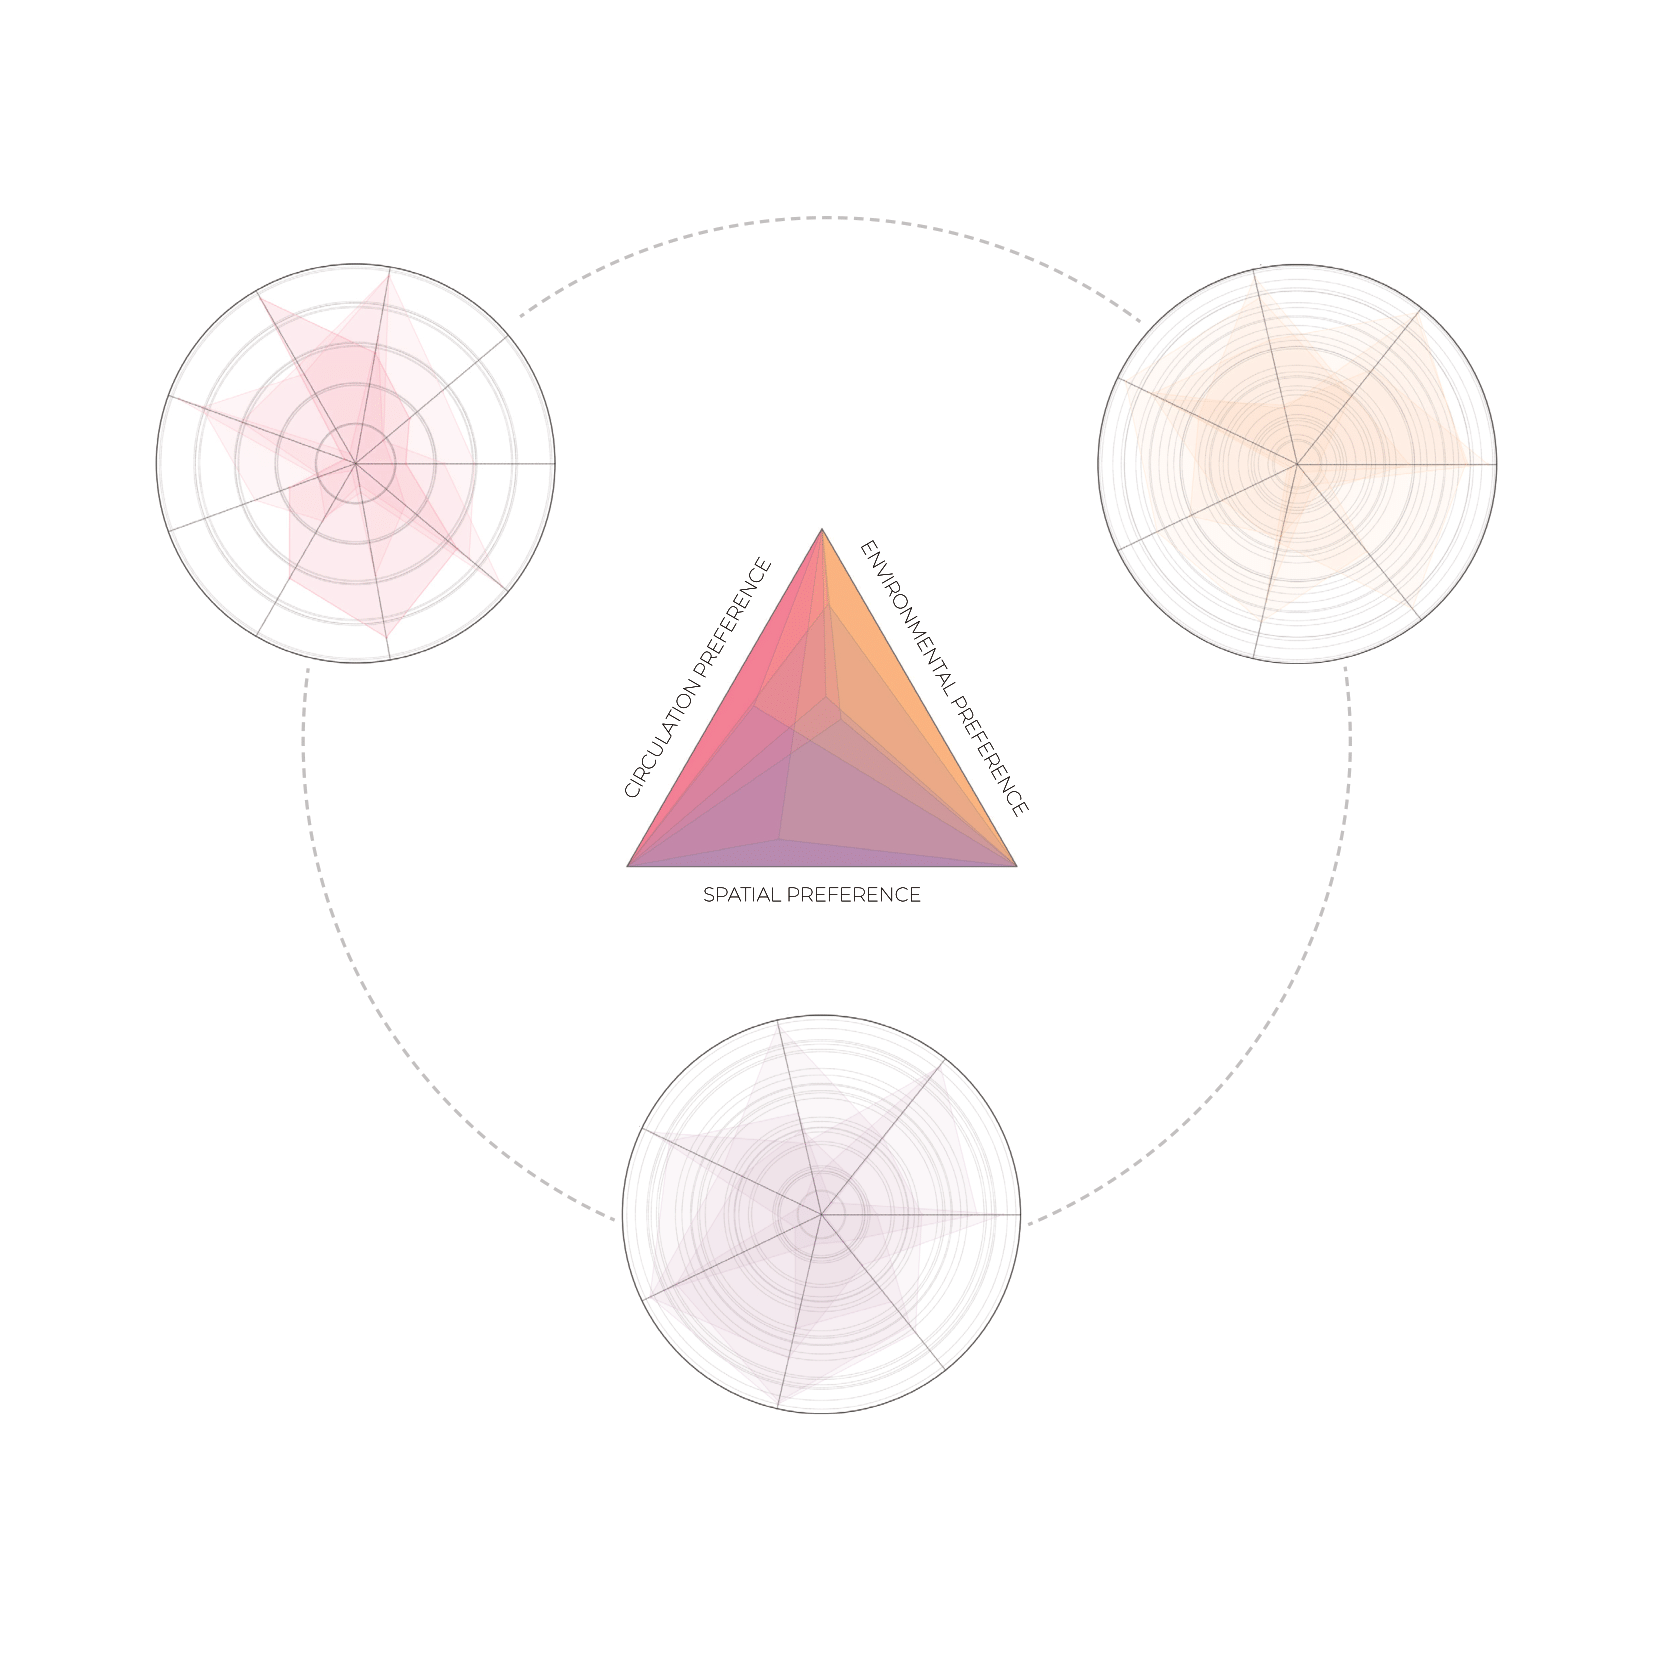
Subsequent to this initial classification, each agent is attributed a unique composite of preferences, synthesized from relevant attributes within the aforementioned categories extending for each agent to have a favorable space. Due to large amounts of attributes and their given complexity a clustering was performed to locate the closest clusters of agents to the closest clusters of rooms since both have the same attributes (the agents in their target preference and the rooms as static conditions).
Notably, a palpable inclination towards sunlit spaces was observed, and rooms with extensive curtain walls and favorable indoor climates exhibited elevated levels of entropy, while some agents followed non-linear trips to their destined target. The dataset generated from these simulations offers a myriad of potential applications, including strategic planning for announcements and targeted marketing initiatives.
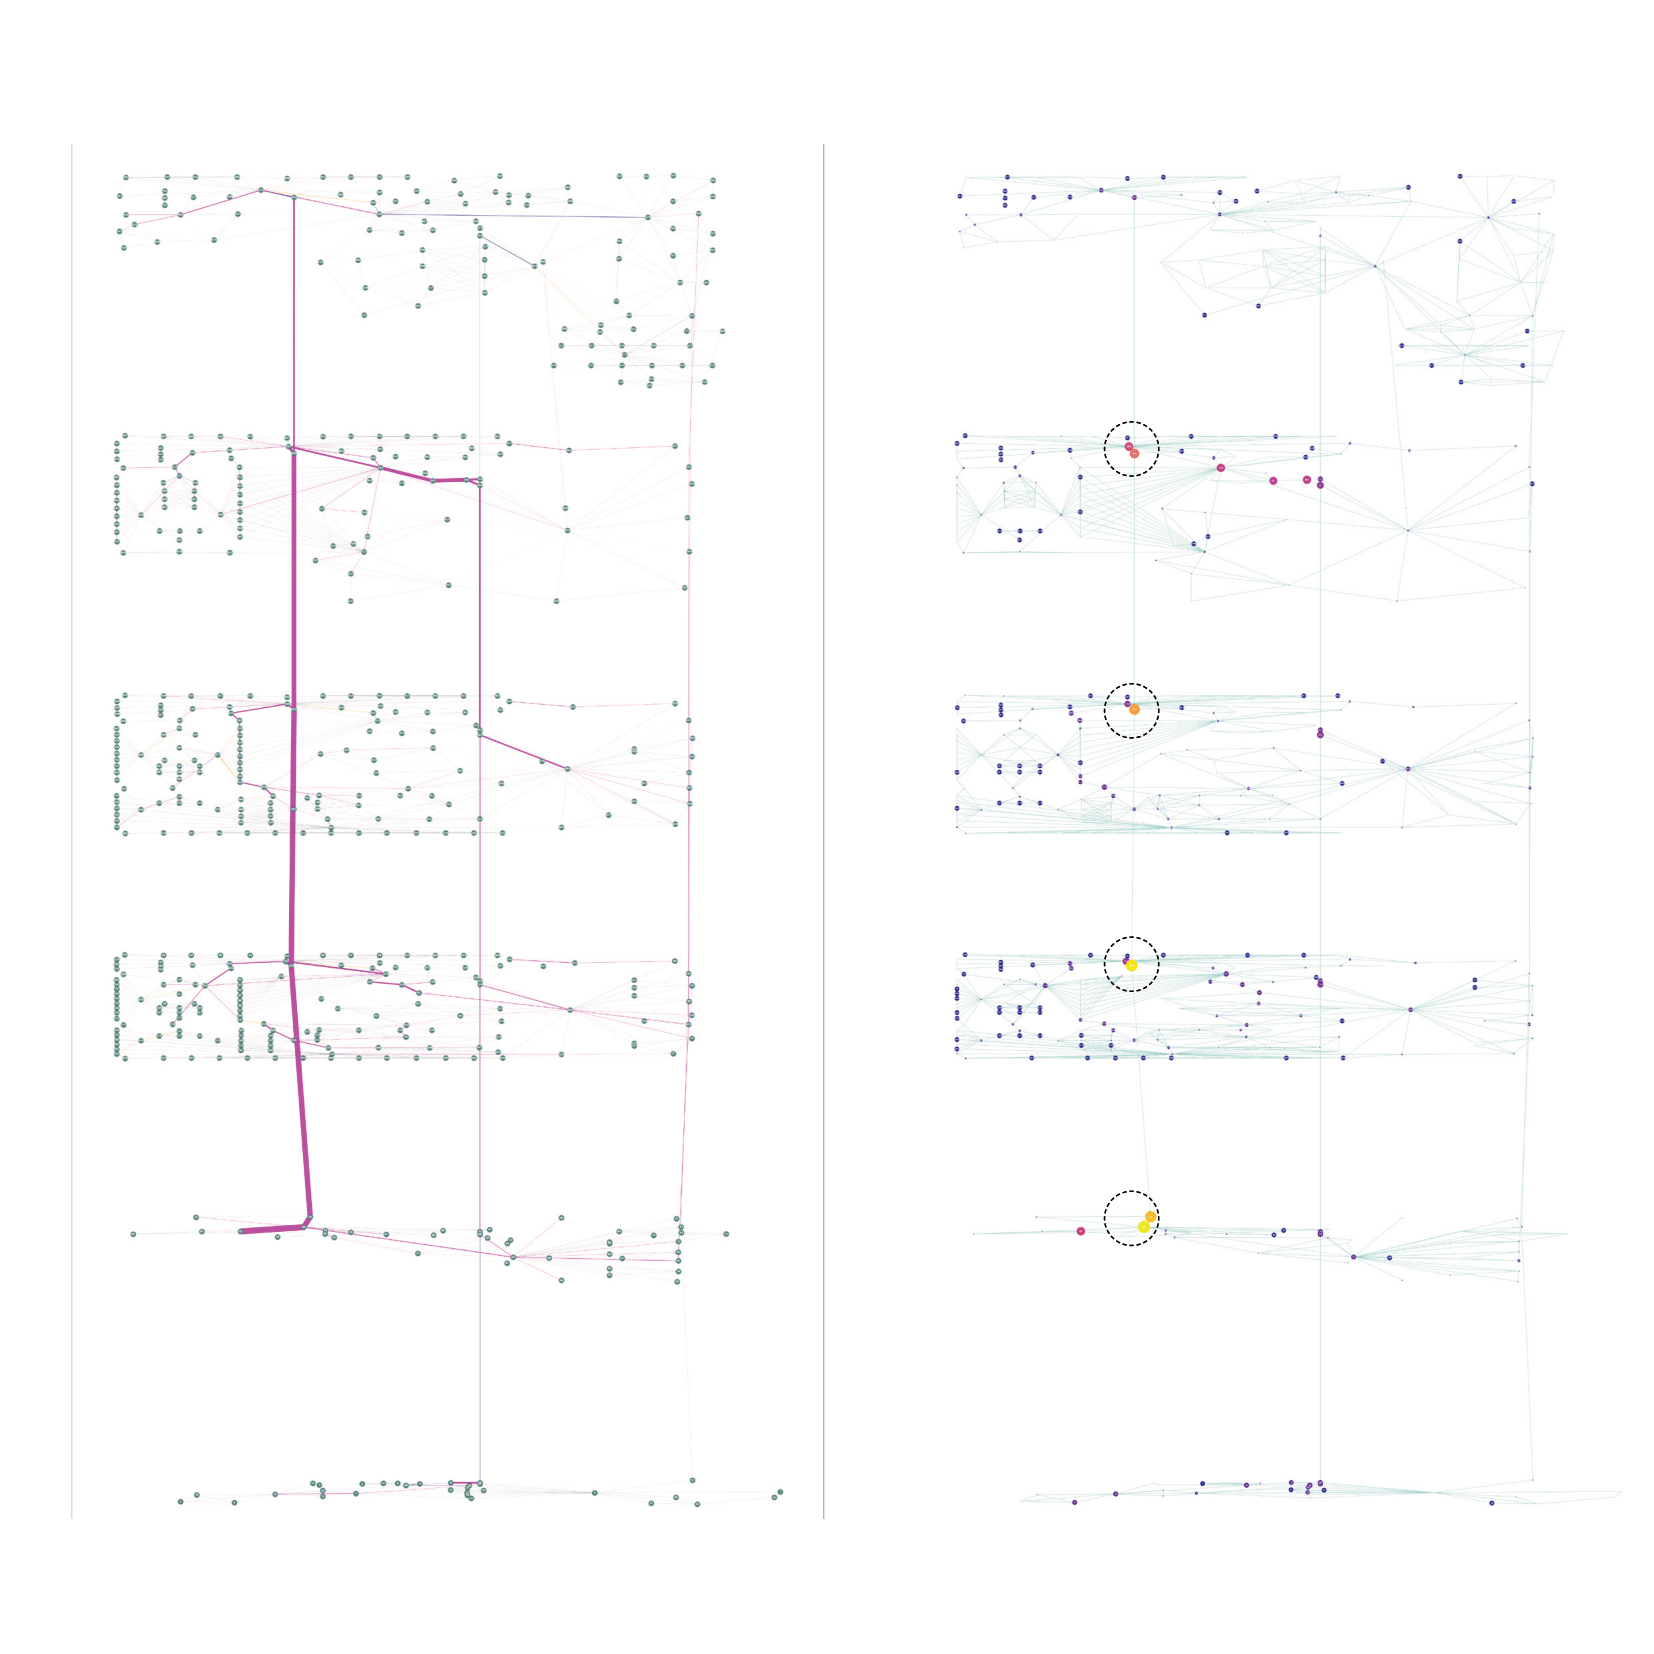
Most used edges / Node Usage
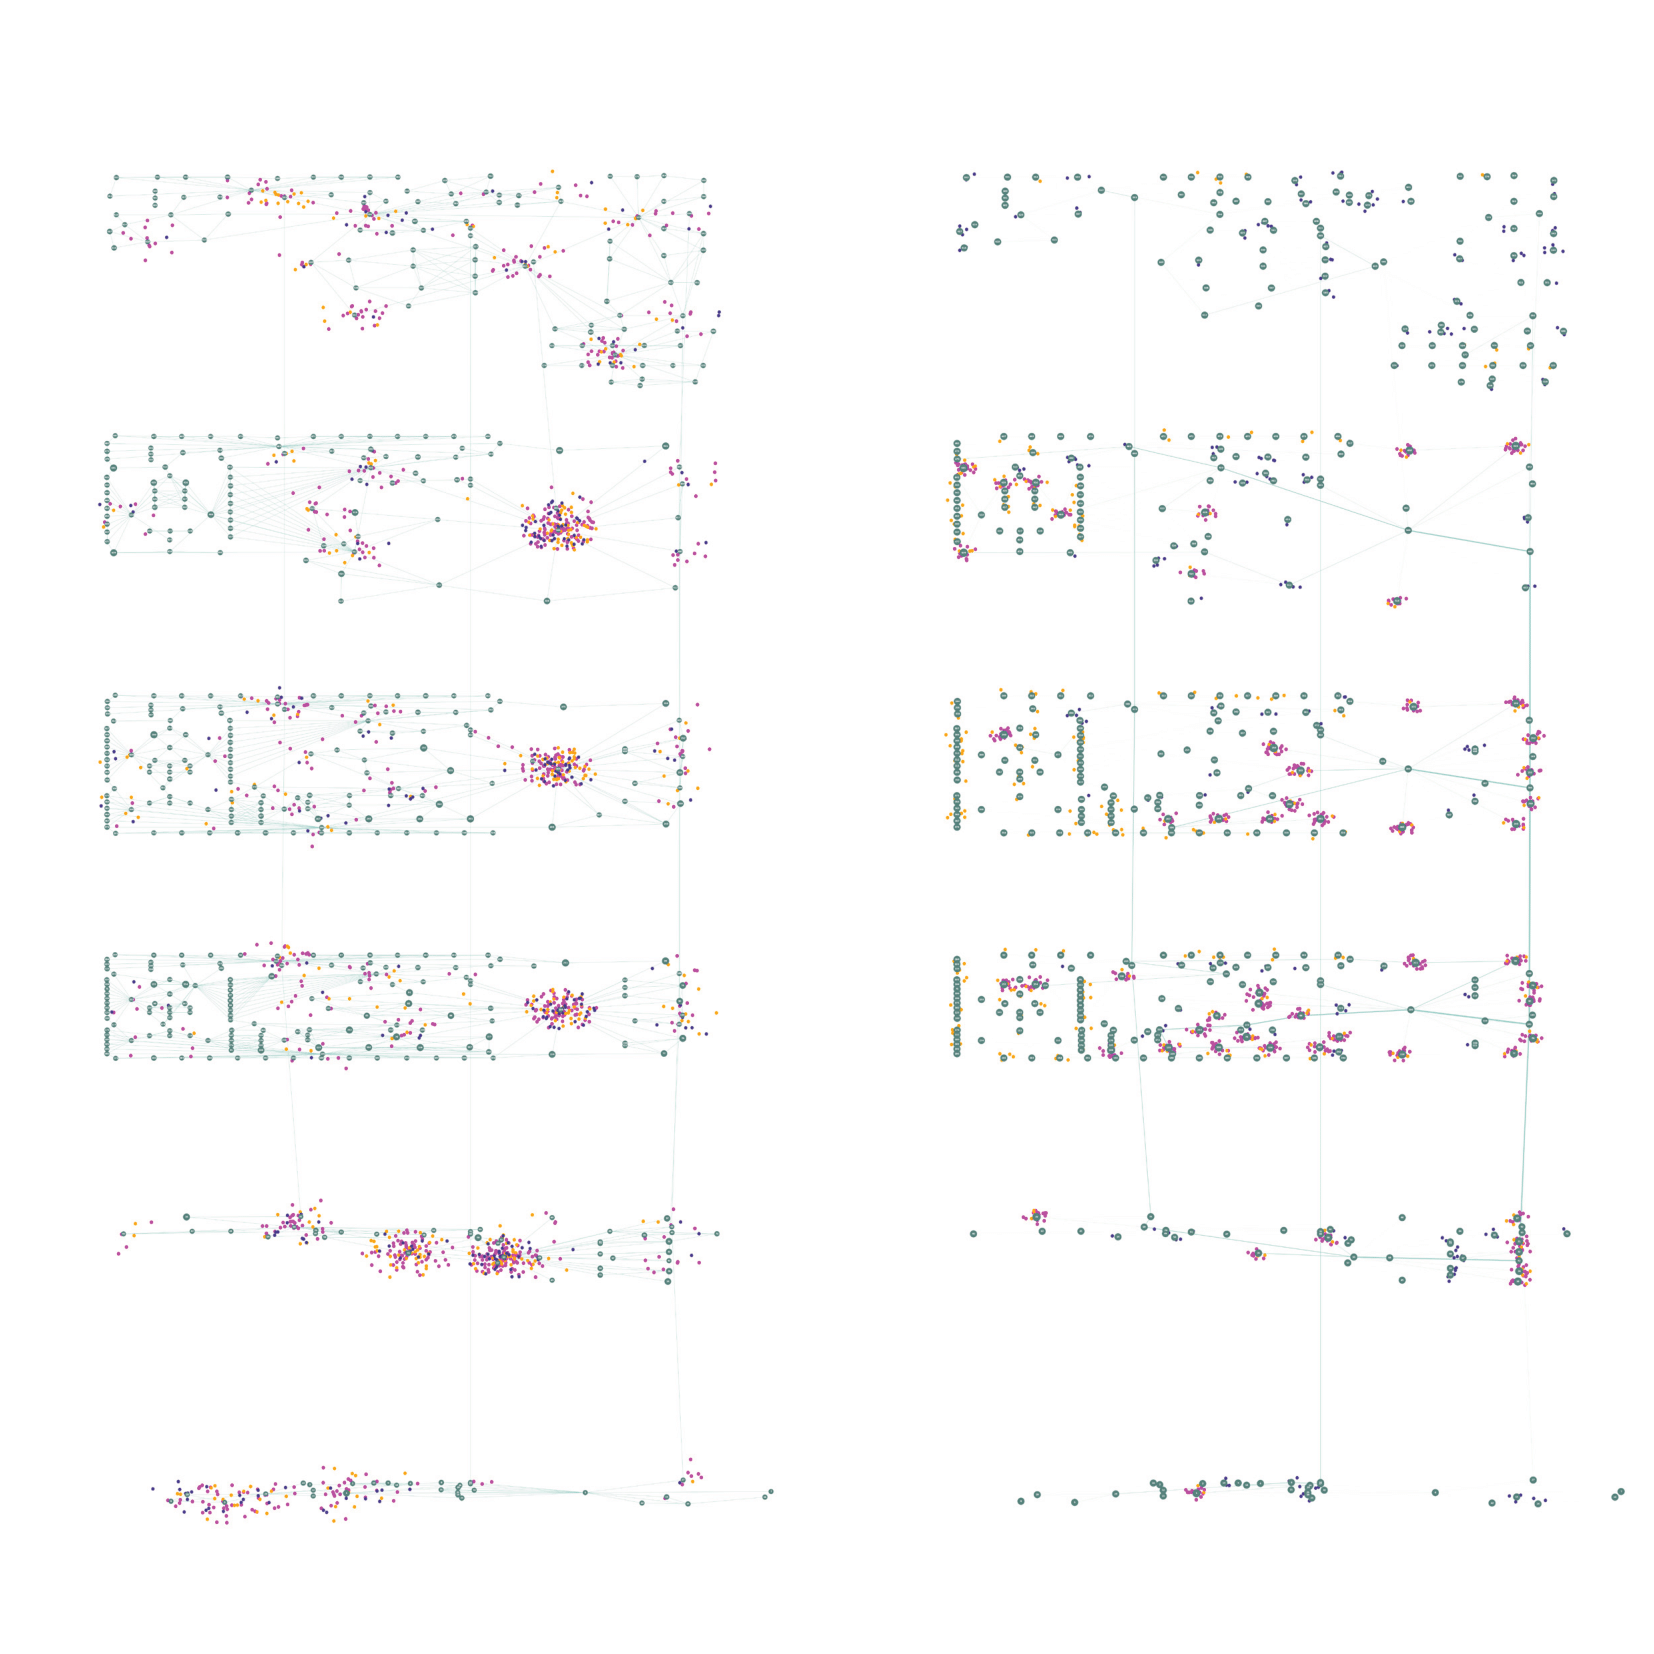
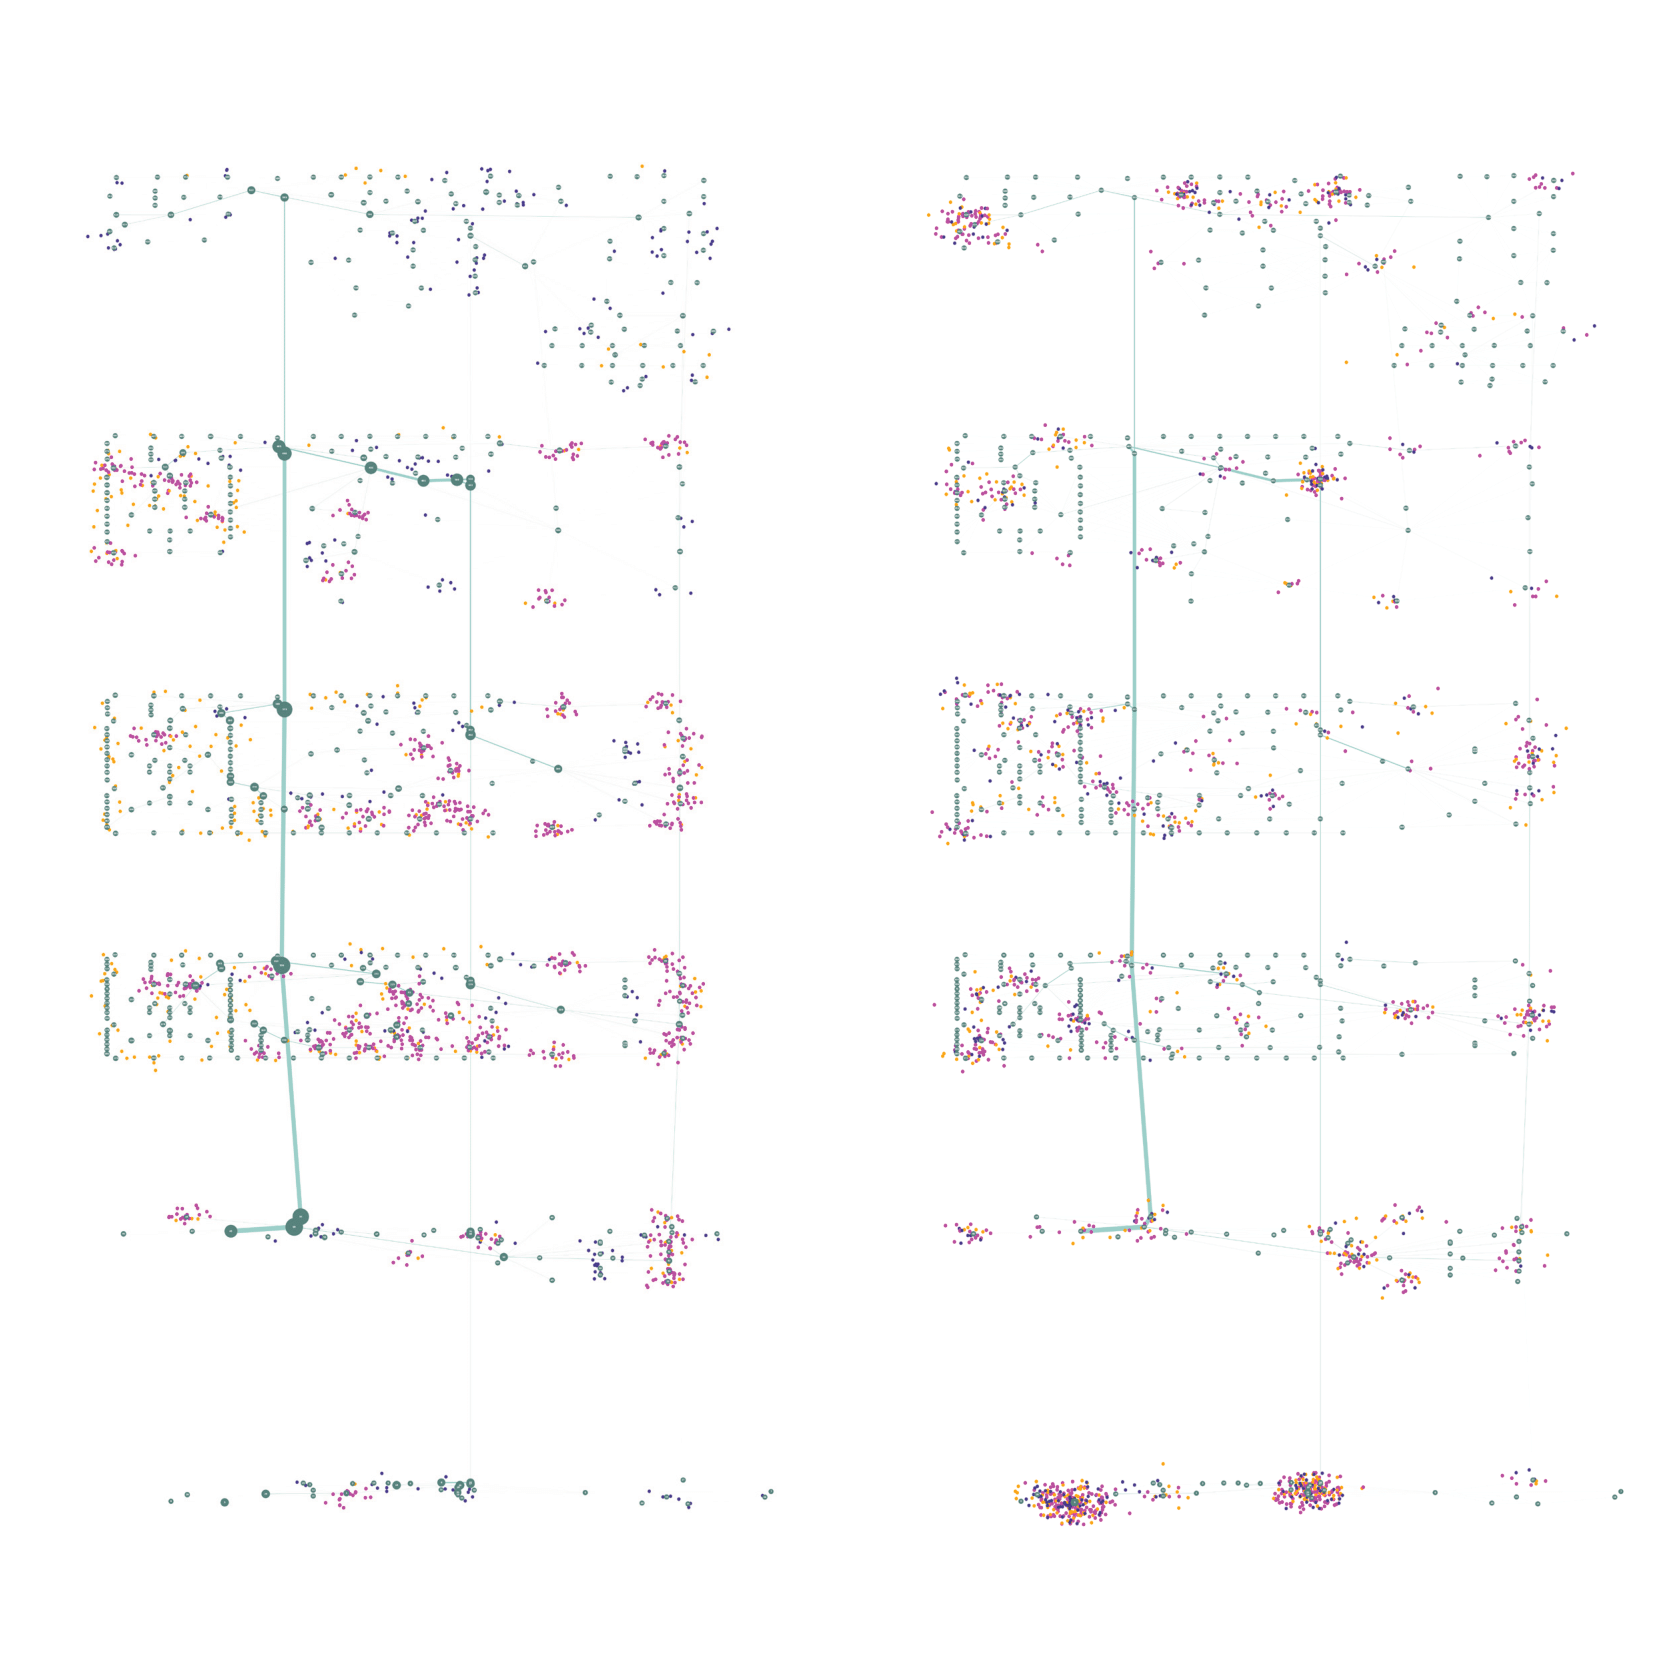
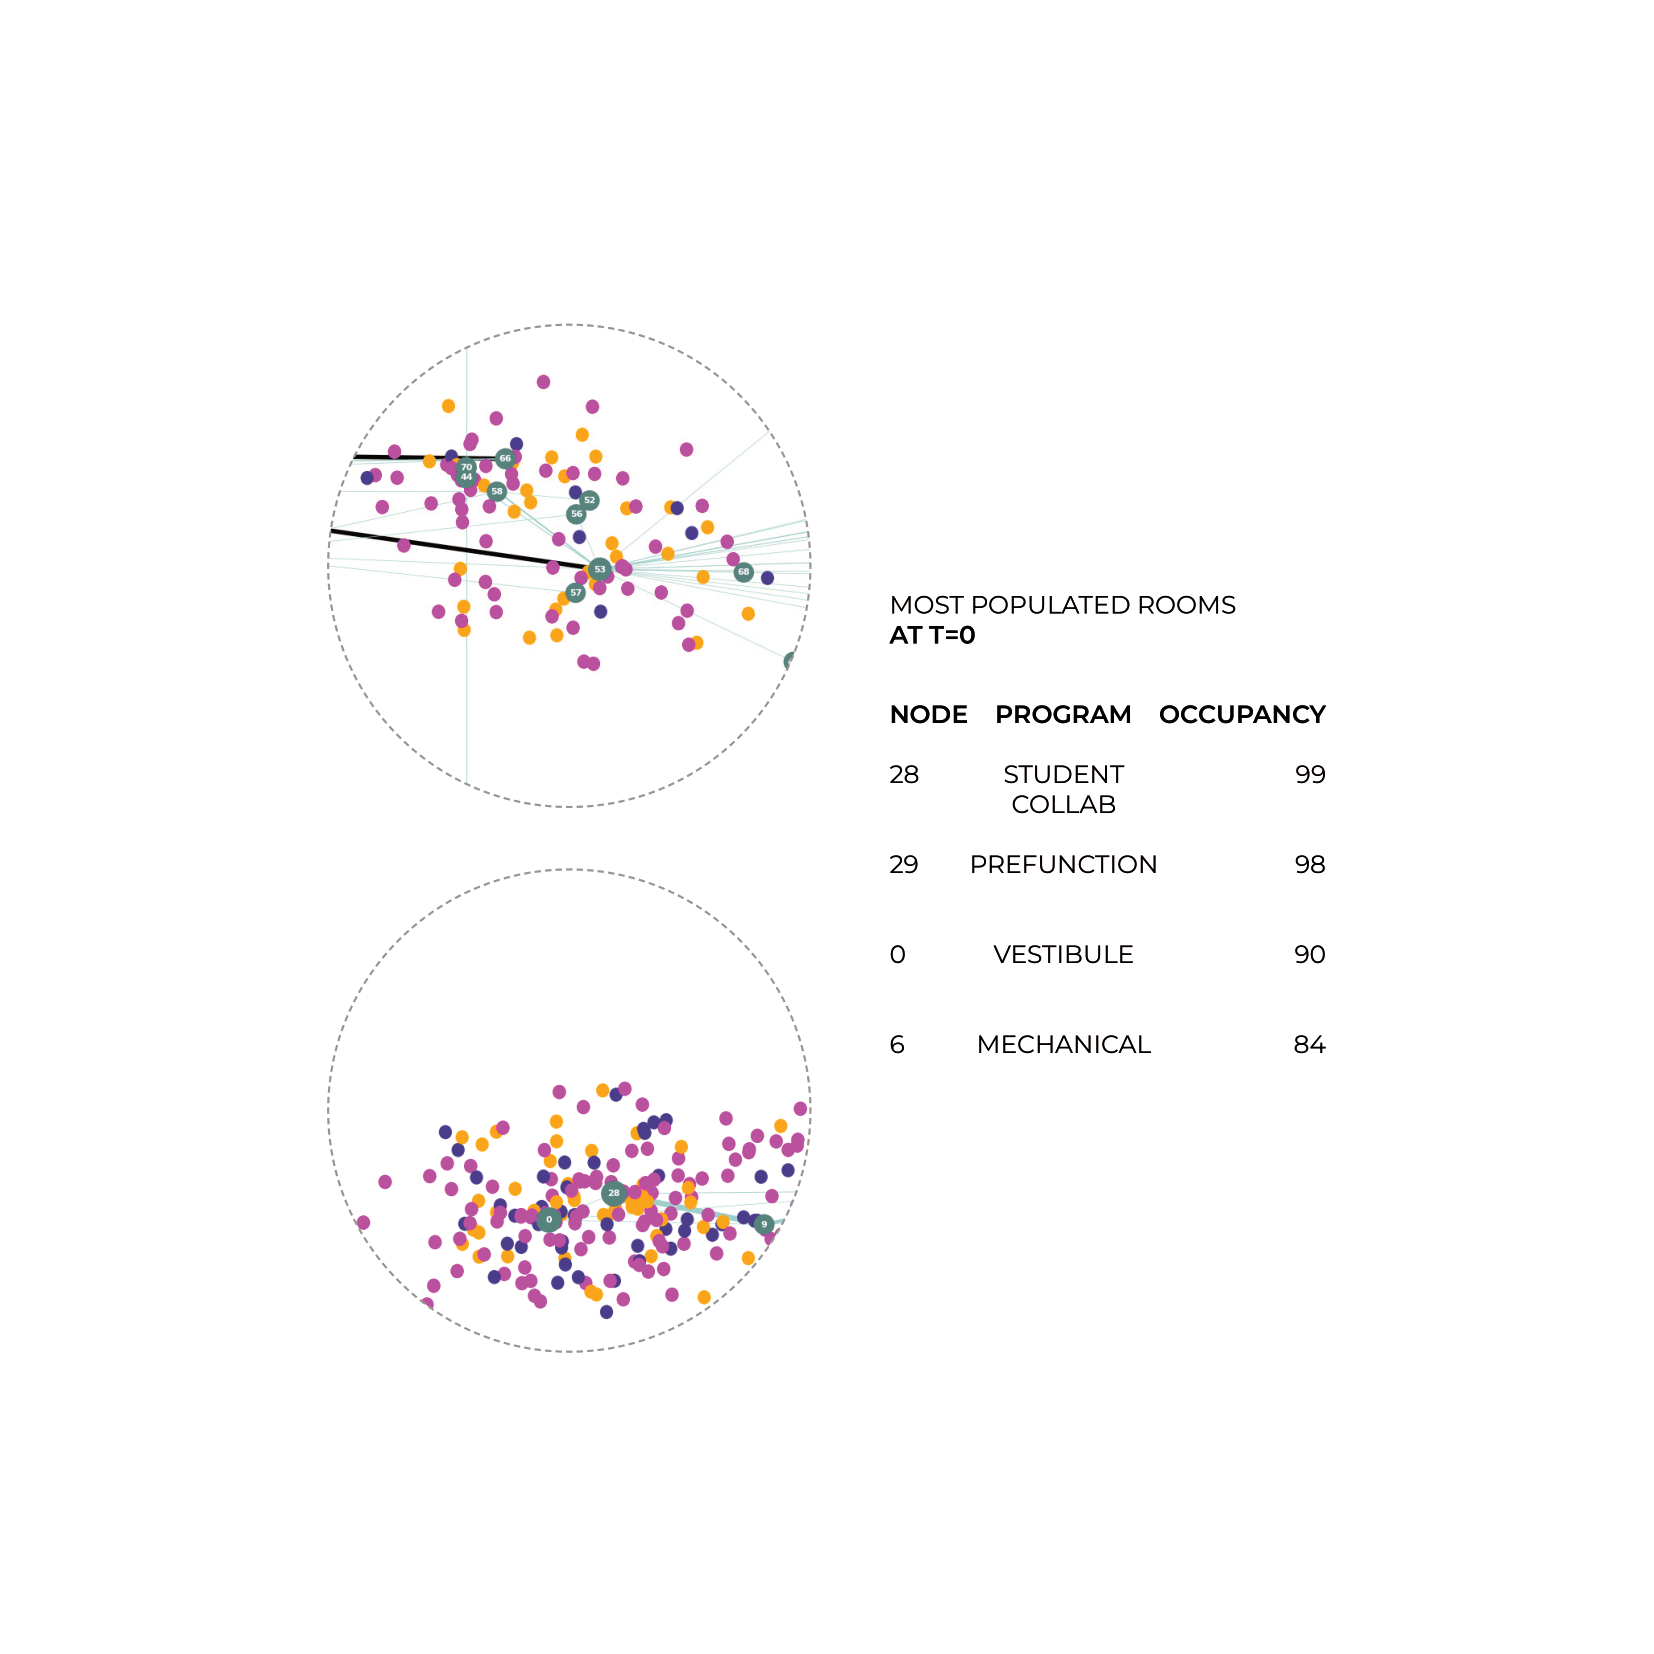
Circulation During an Emergency: Fire Evacuation
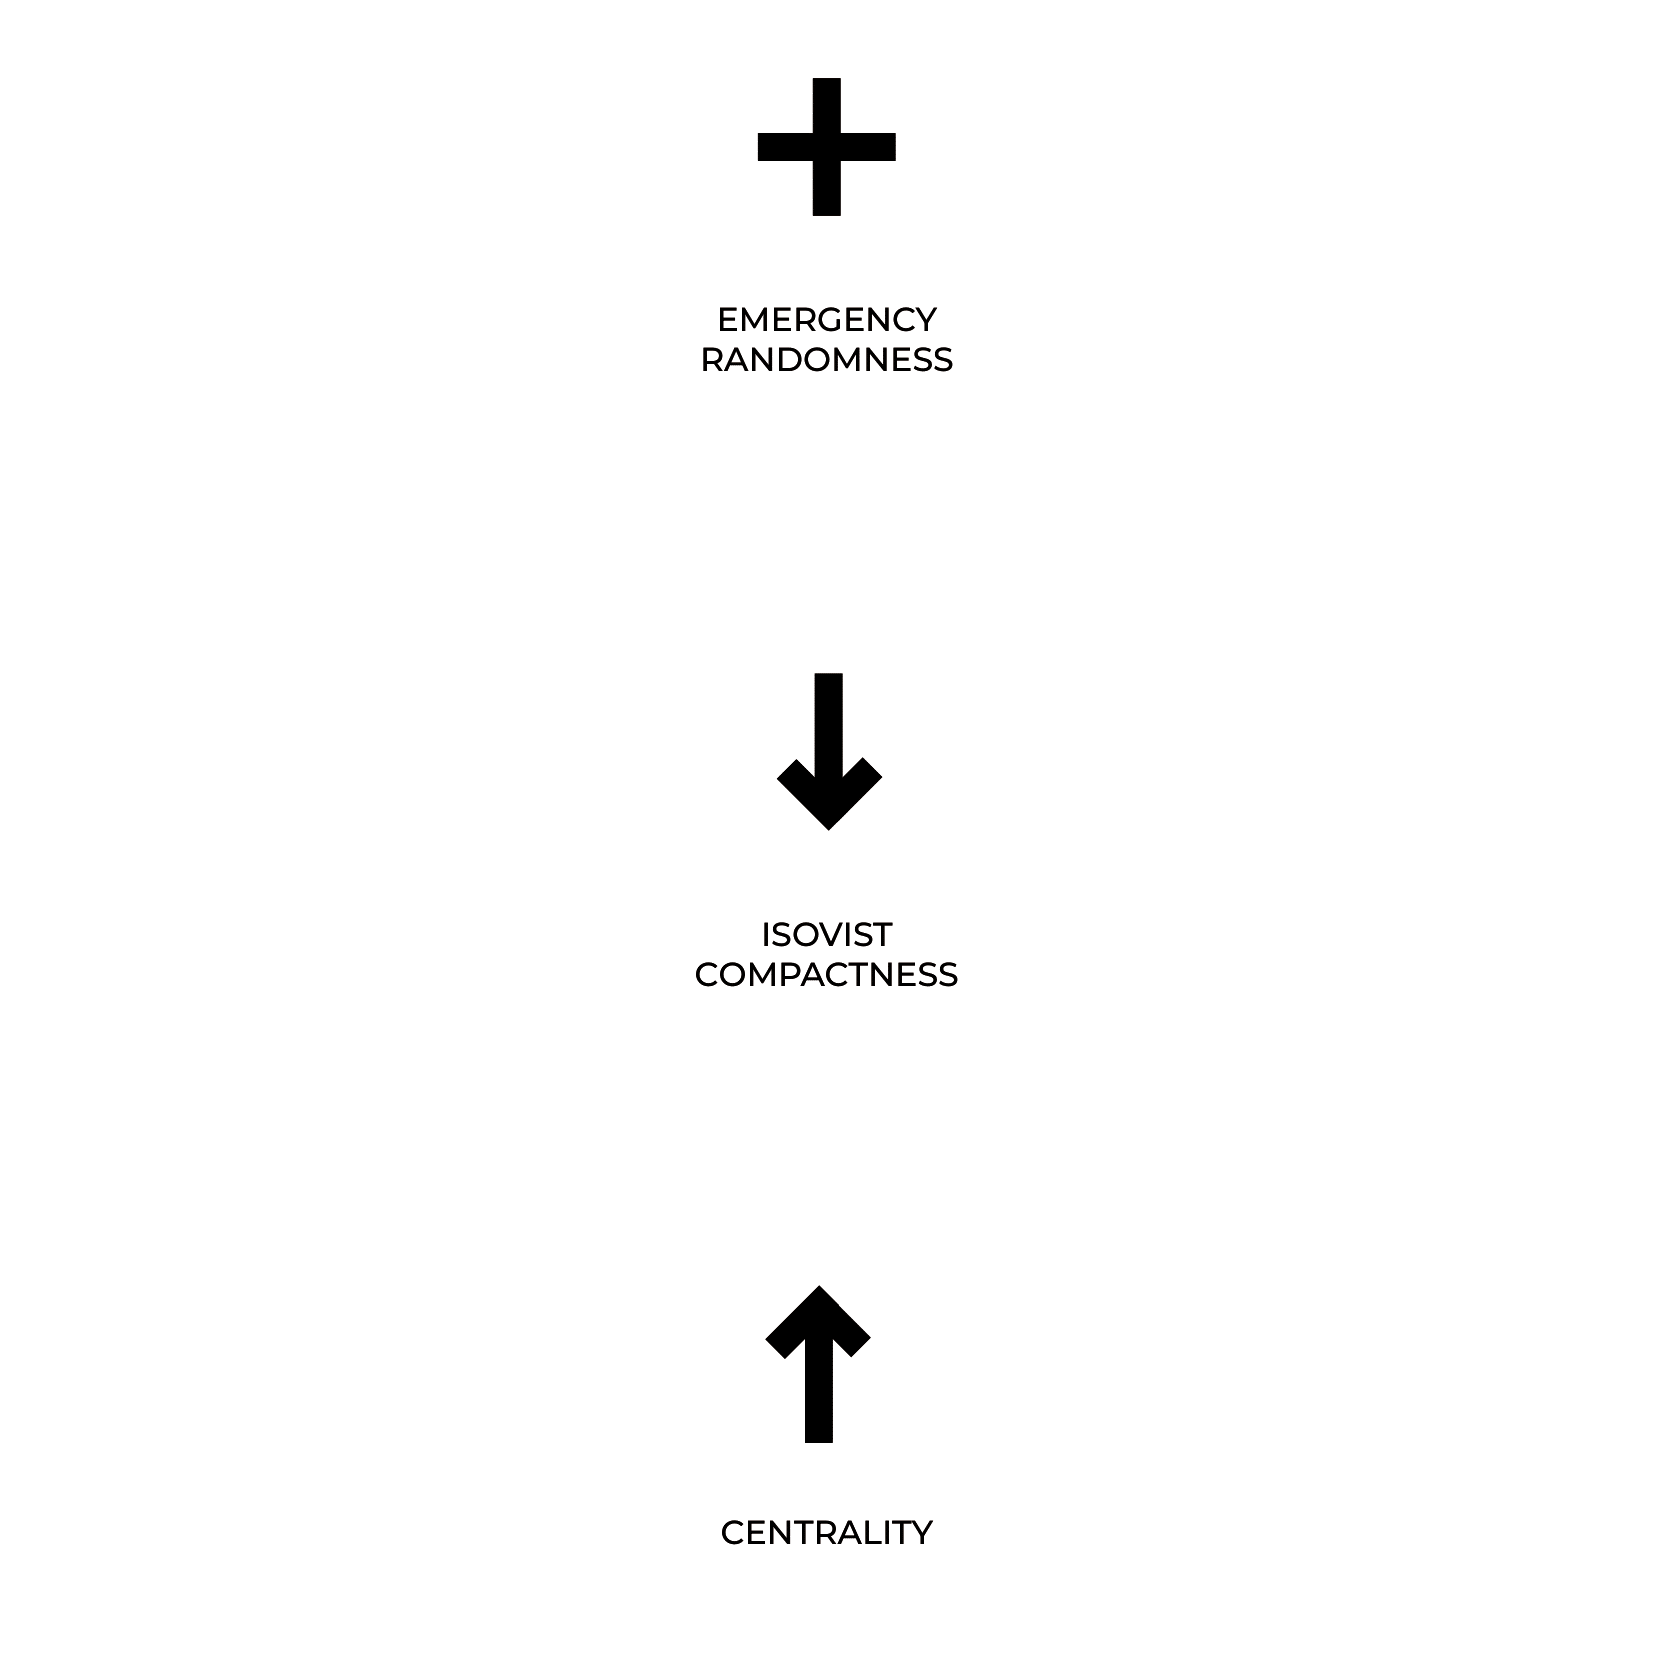
To simulate emergency evacuation procedures in the event of a fire, existing agent behaviors were modified to incorporate elements of stochastic pathfinding, spatial compactness avoidance, and a predilection for high-centrality spaces.
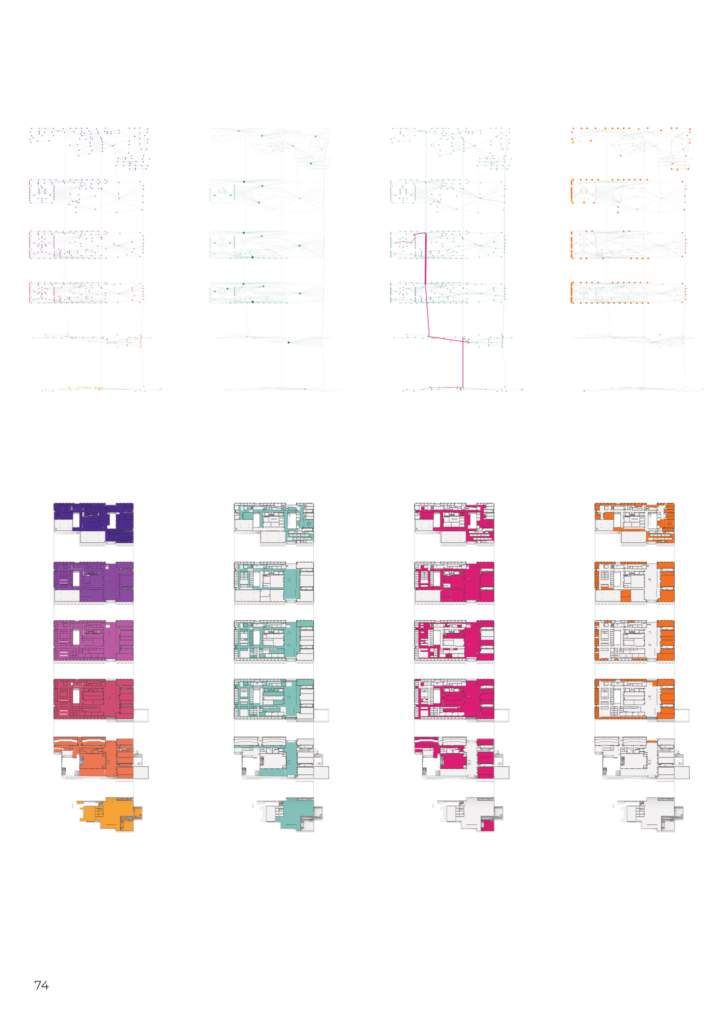
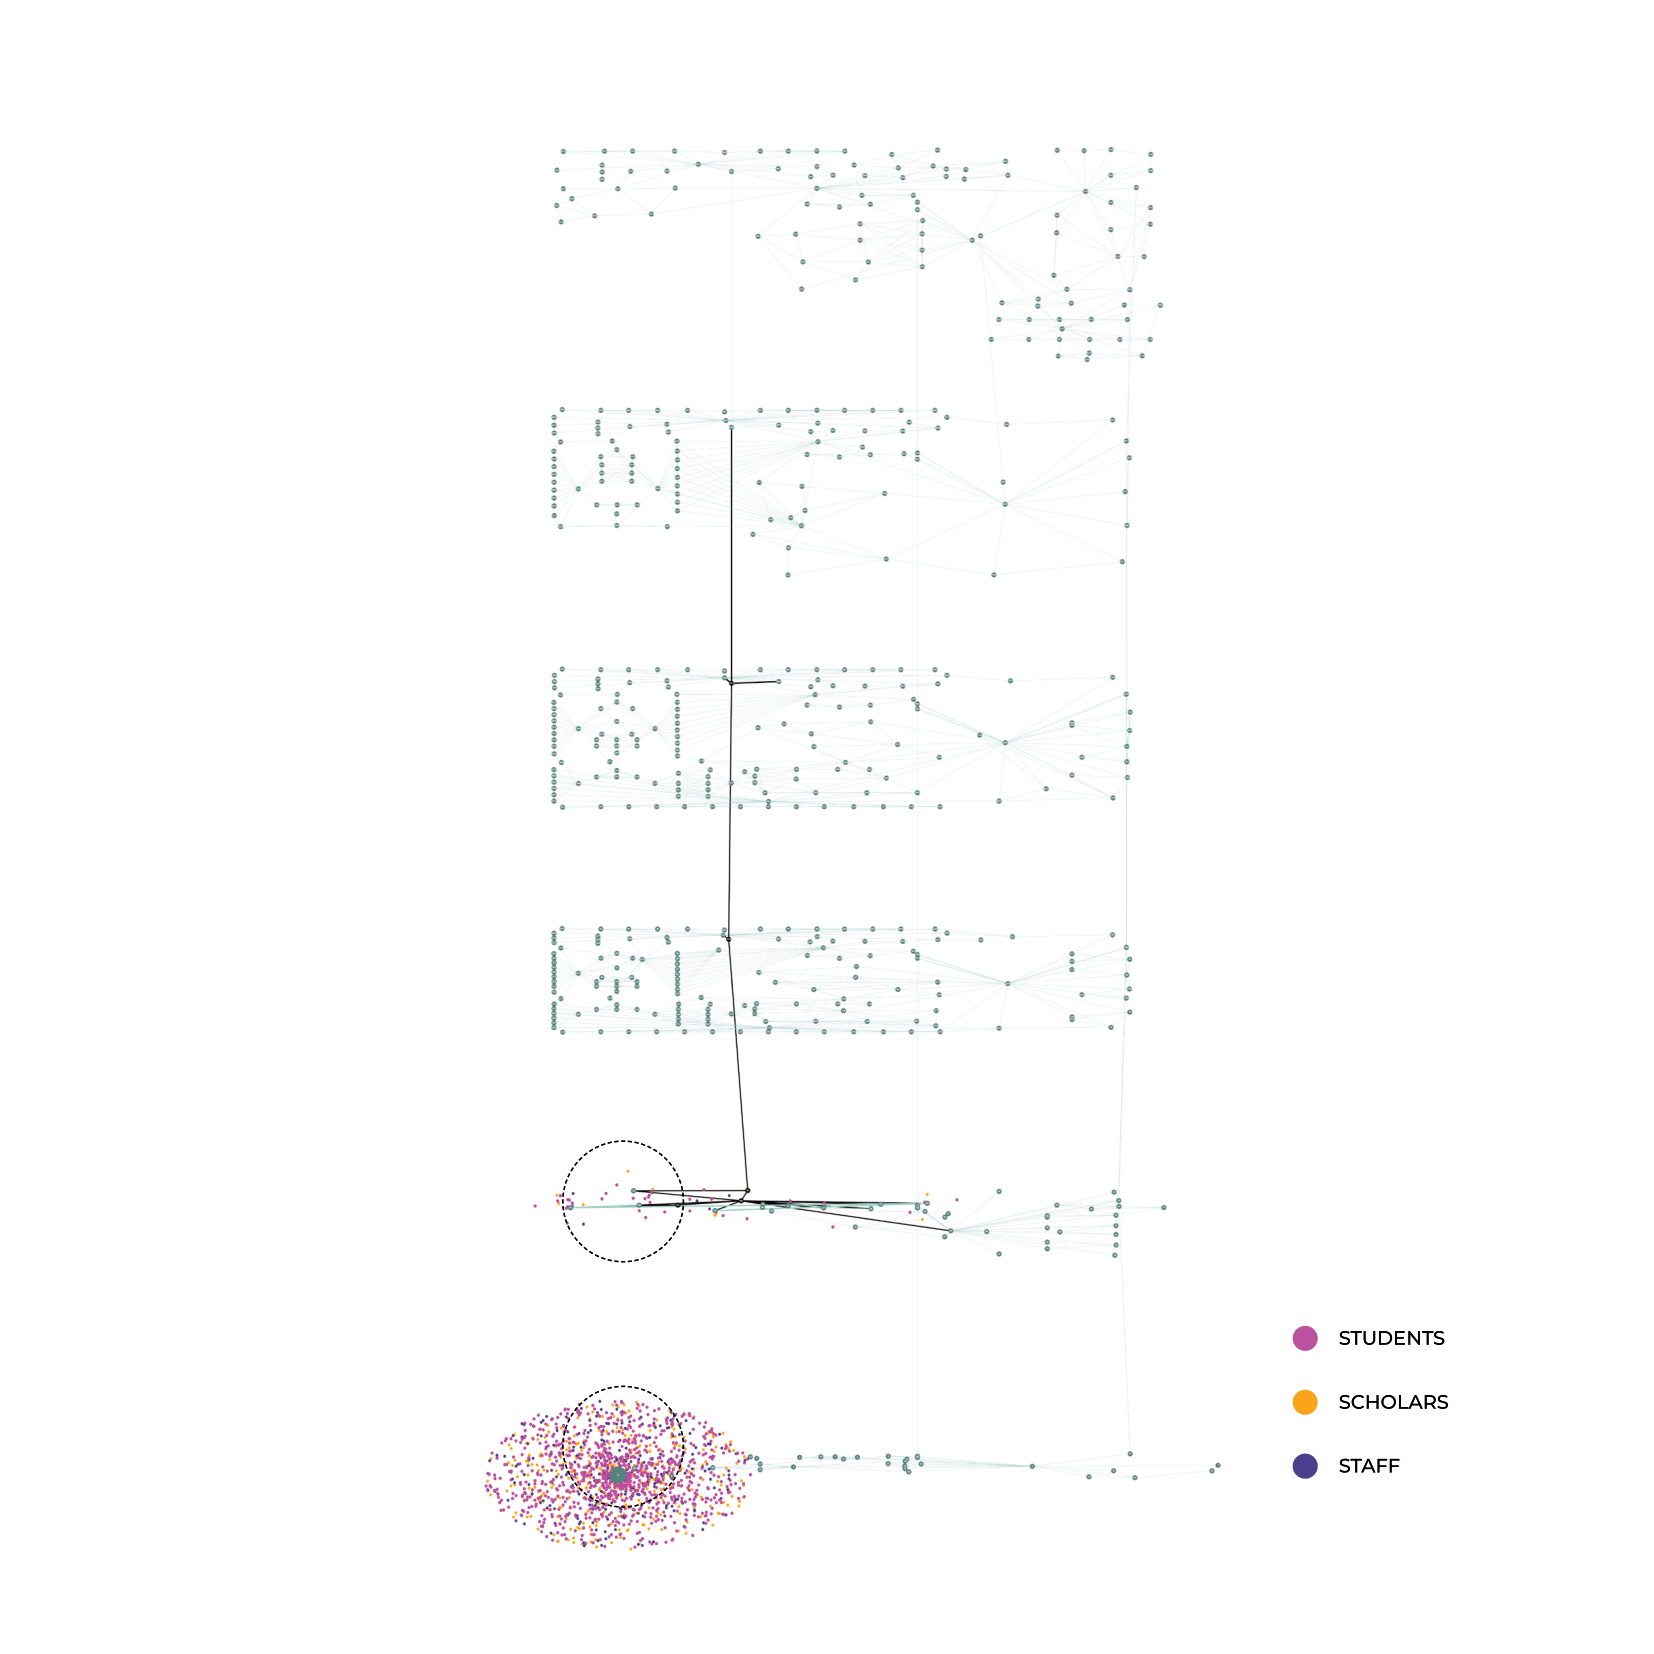
The simulation was segmented into three distinct temporal phases to depict the evolution of the emergency:
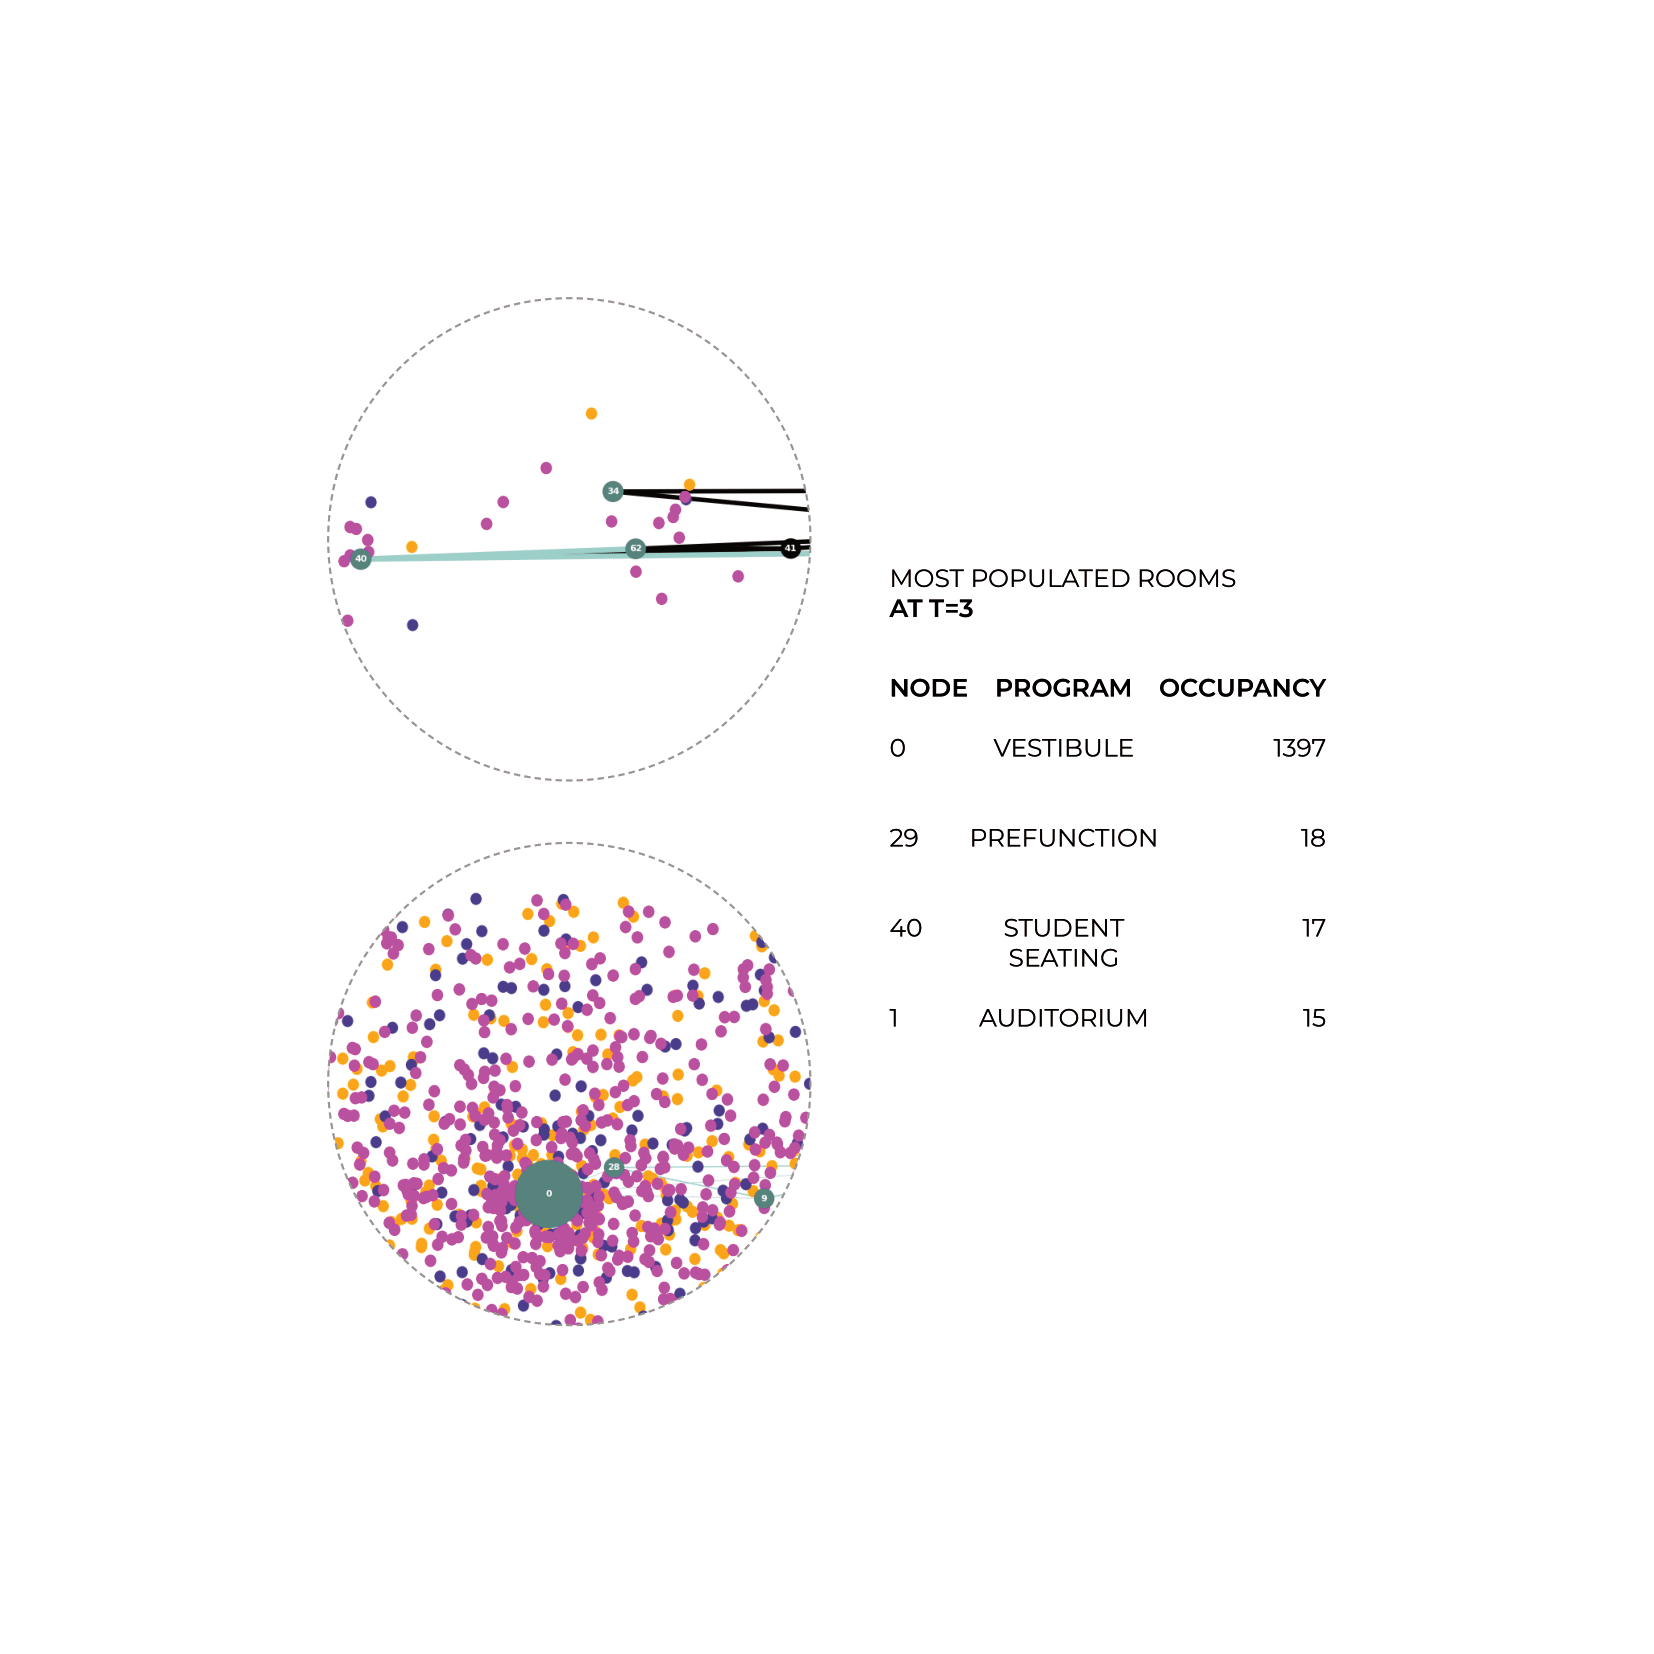
- Phase 1: The initial distribution of agents across various rooms is presented in a tabular format, highlighting areas of high occupancy.
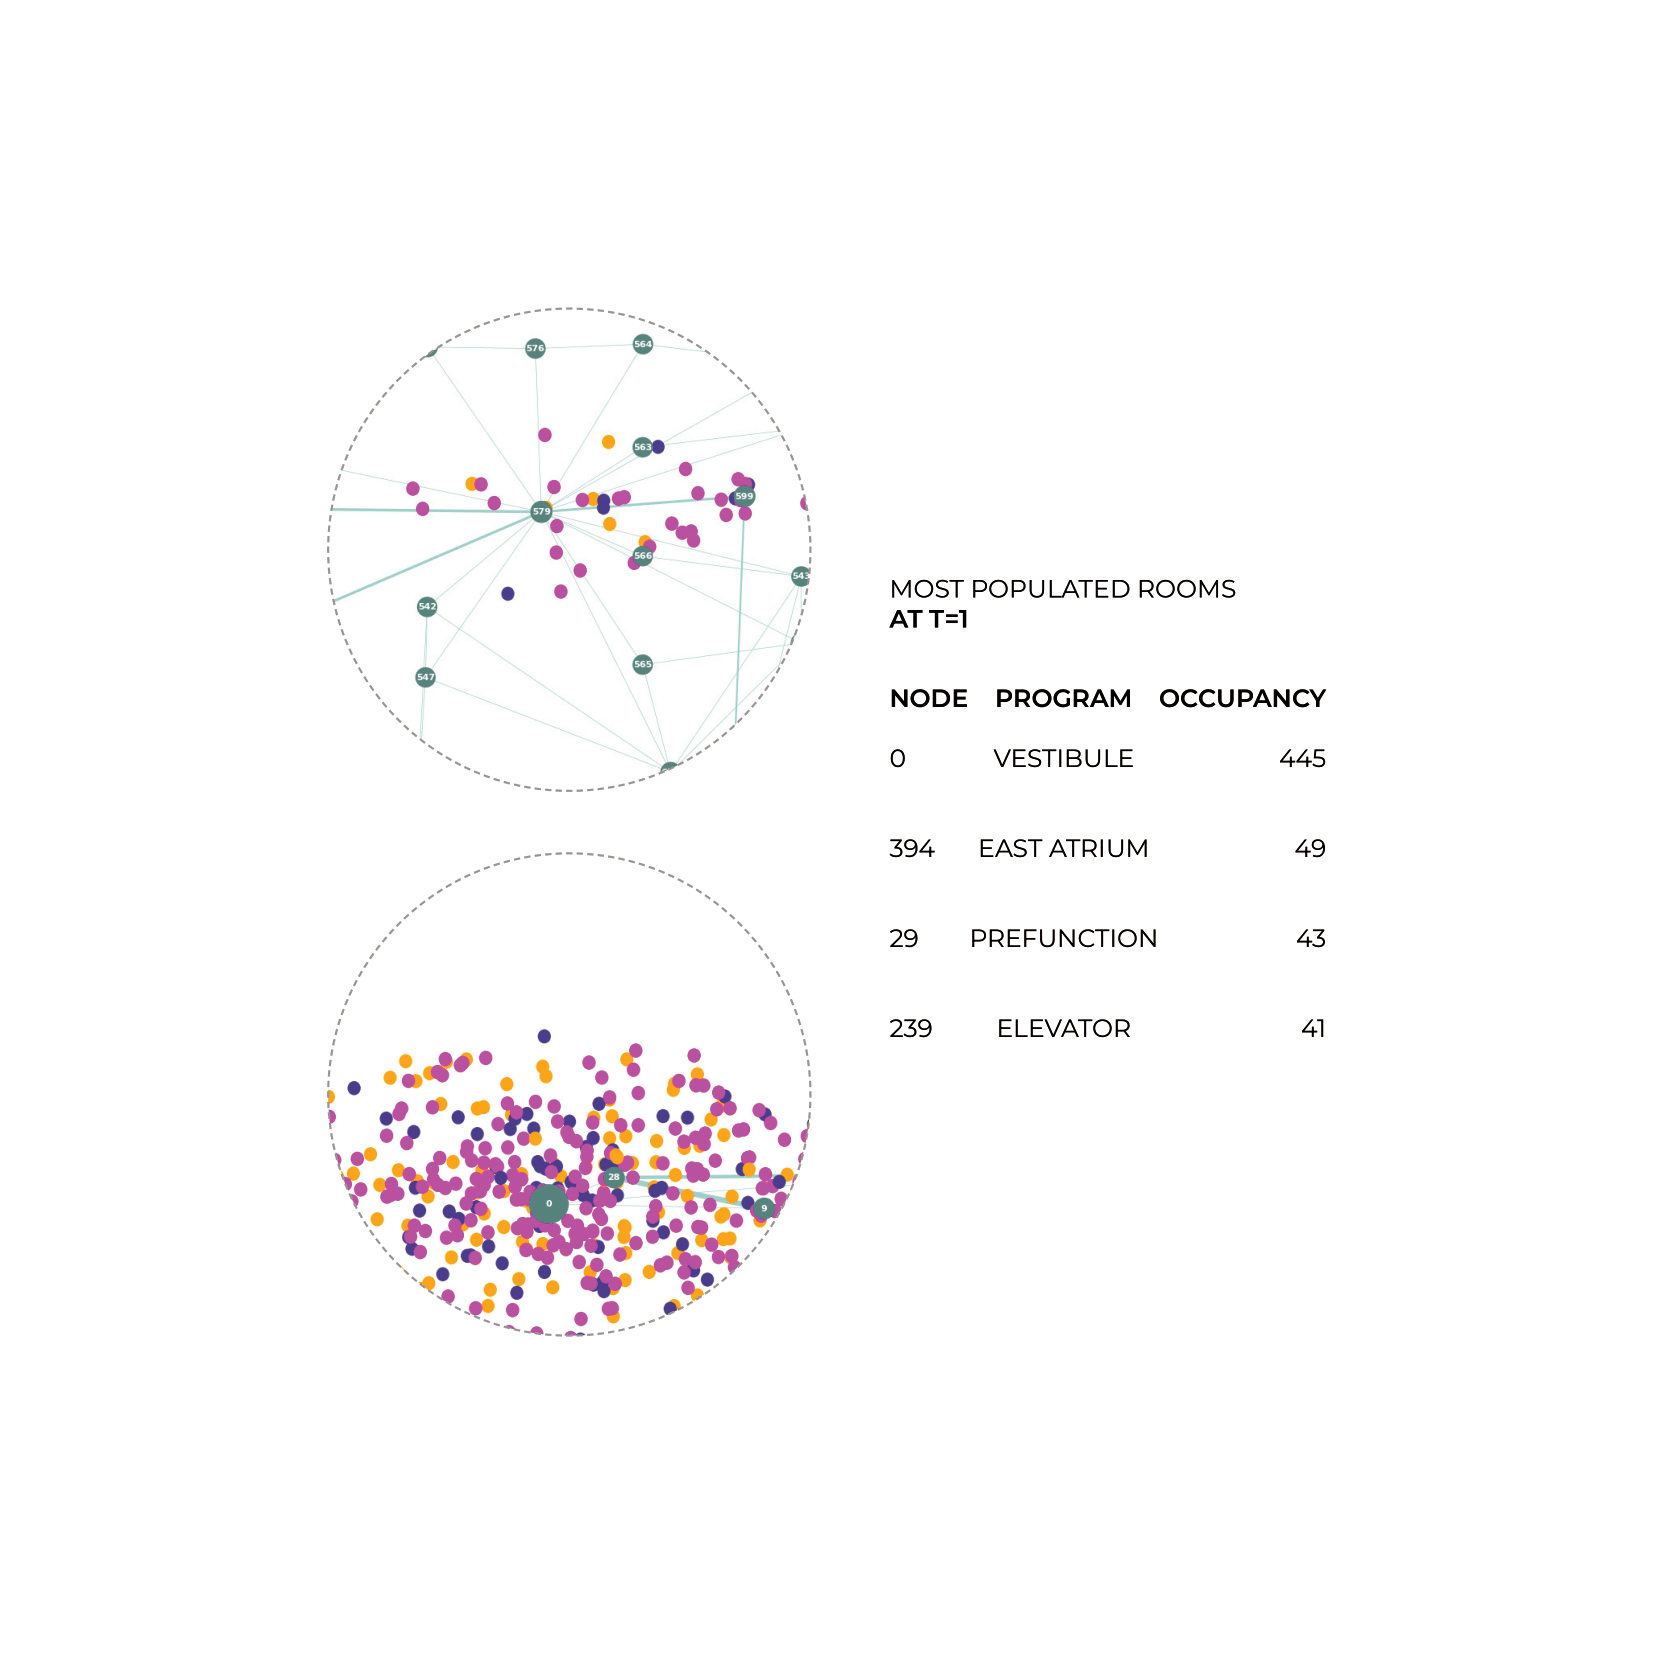
- Phase 2: In this phase, agents situated in upper levels of the building, having been duly alerted, commence the use of secondary evacuation routes.
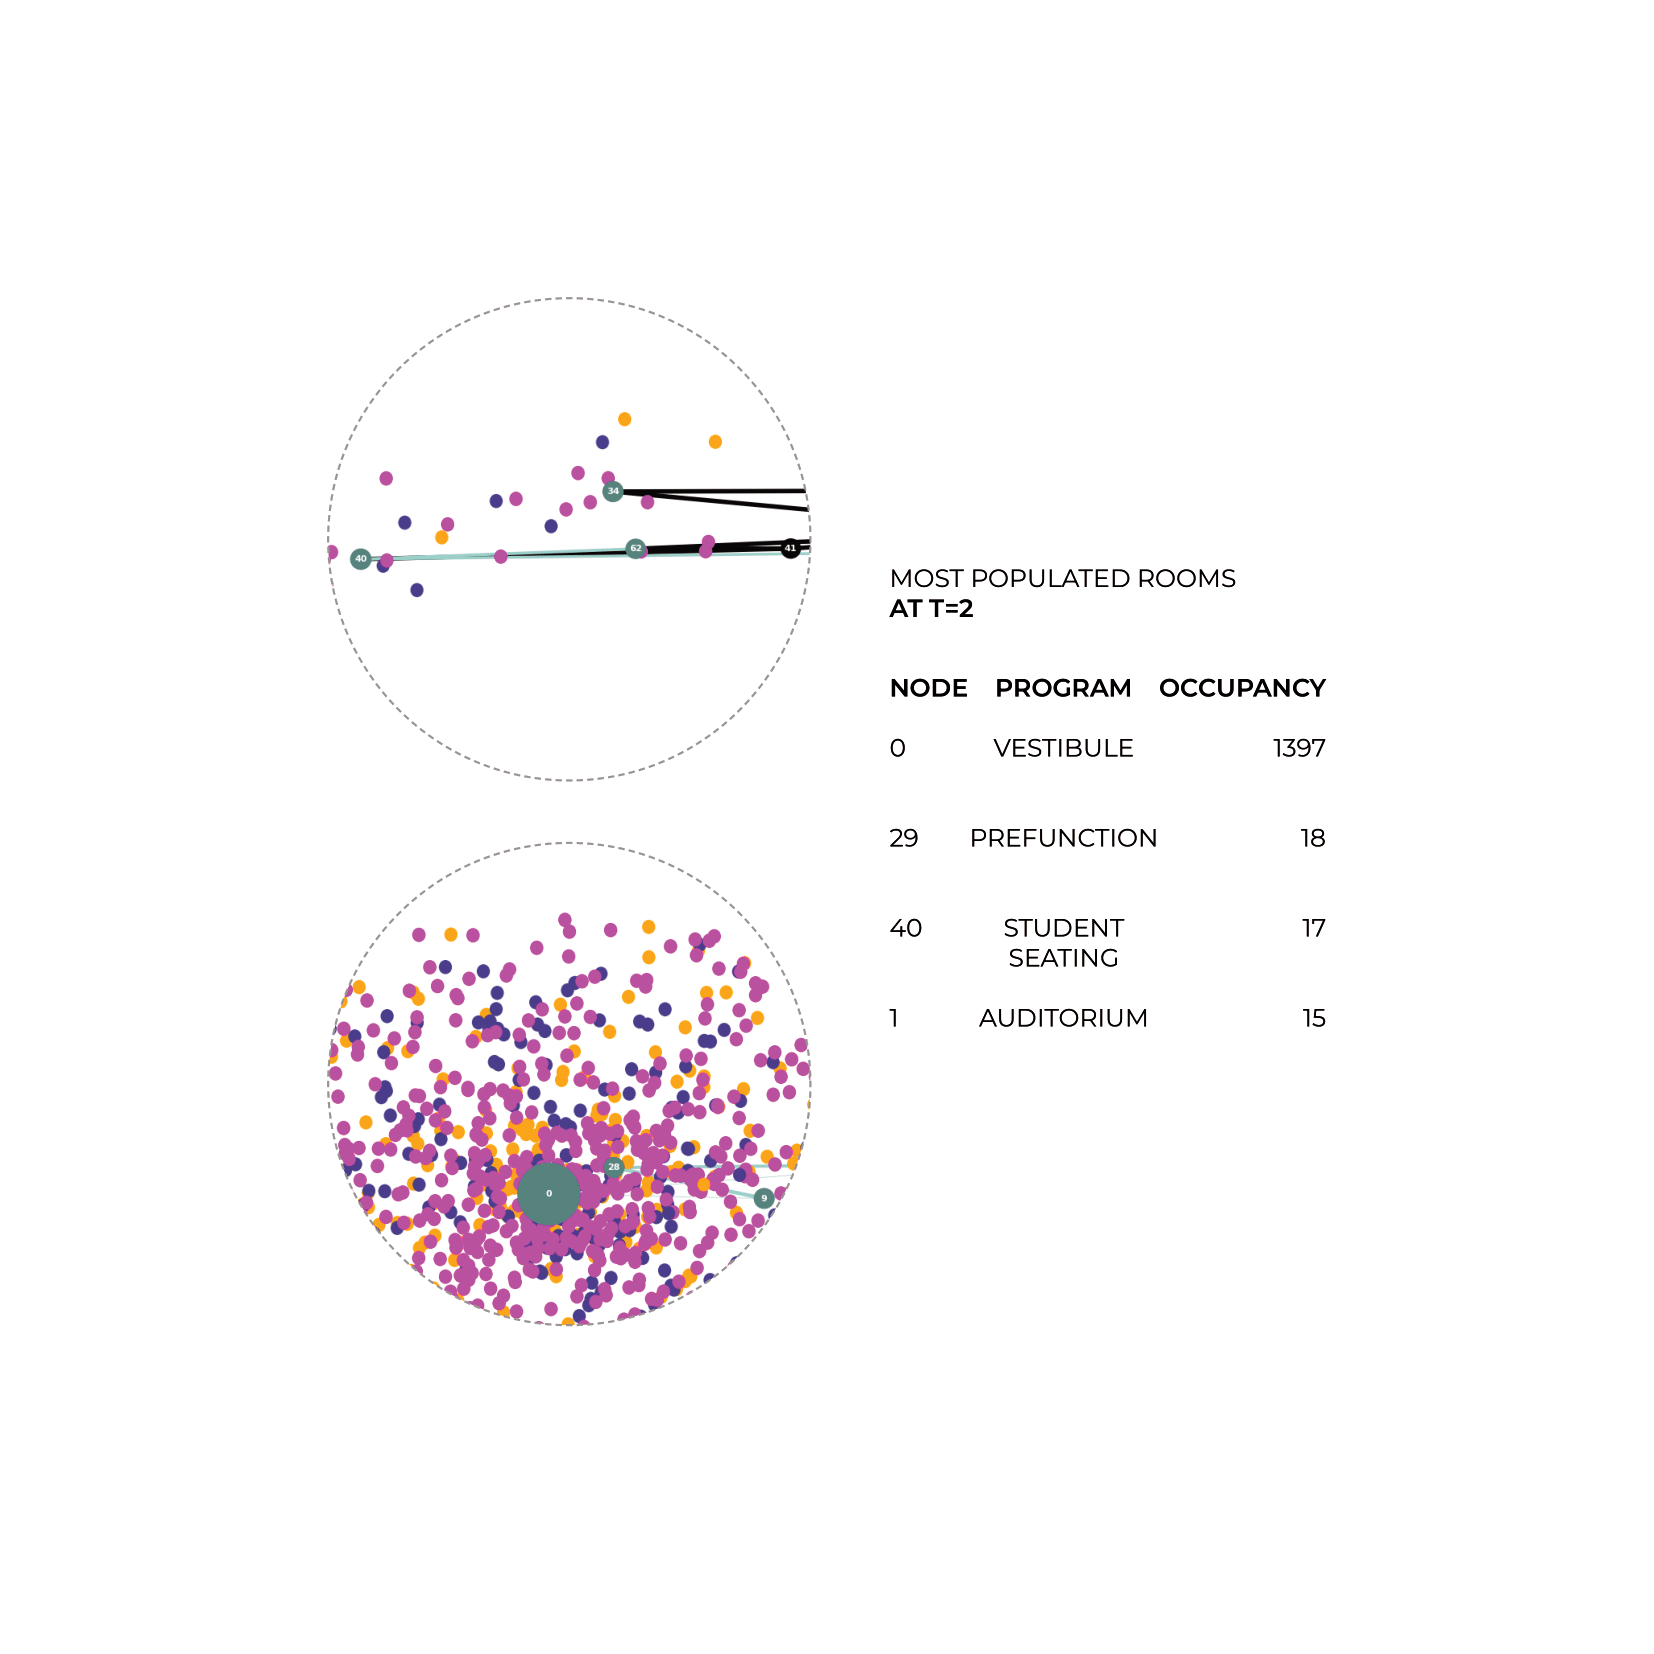
- Phase 3: A significant congregation of agents is observed at the building’s entrance. It becomes imperative to identify the building’s nodes still containing occupants, thereby flagging them as last to be evacuated—a crucial metric for architectural decision-making.
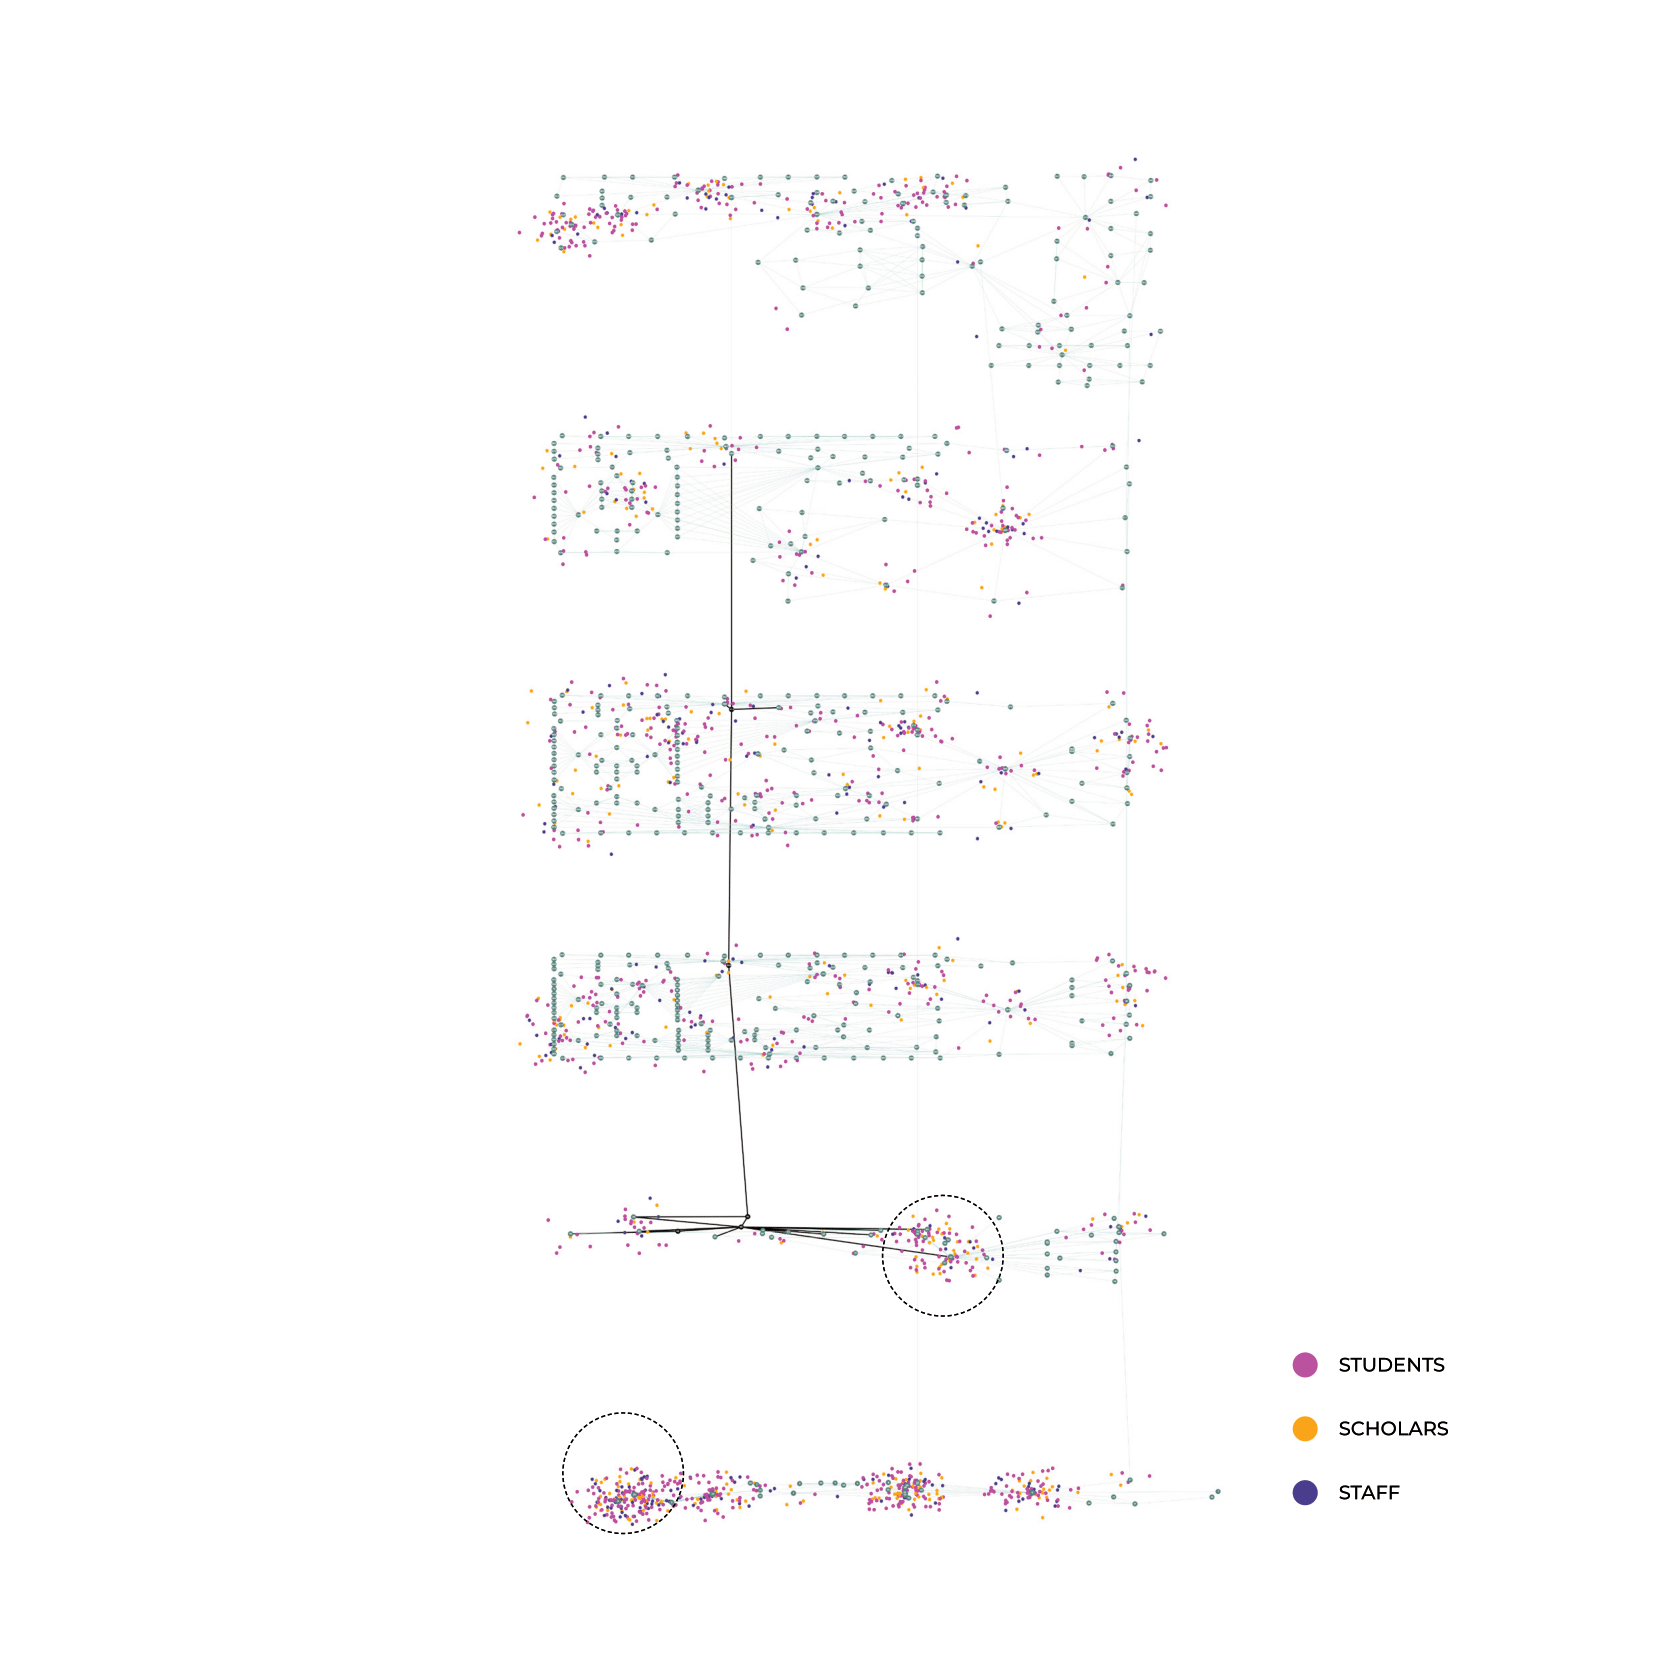
This multi-faceted simulation provides invaluable insights for both regular operations and emergency scenarios, thereby contributing substantively to the field of computational architectural analysis. Analytically the flows of people reacting to a sudden change in the building daily program can be demonstrated and its dynamics interpreted regarding slow versus fast sub-cluster nodes as can be visualized by the dots’ entropy.
Insights into the most frequented nodes and edges within the building were gleaned, thereby informing areas necessitating enhanced fire reinforcement. A linear finalization step verified that the nodes most delayed in evacuation were predominantly situated on the right-hand side of the building. The presented research and case studies serve as multifaceted tools for architectural analysis, synthesizing spatial, environmental, and human-centric dimensions into a cohesive framework while essential nodes and edges are prevailing on each scenario giving opportunities for a new back and forth decision making process and evaluation.
Notable black edge is the fire location set in the identified main artery of the building signaling the most critical condition the team can examine in terms of circulation.
Fire Emergency T0 timeframe.
Fire Emergency T1 timeframe.
Fire Emergency T2 timeframe.

Fire Emergency T3 timeframe.
Conclusion
Due to the level of visual abstraction when moving from a building to a graph, architects might not gravitate towards graph integration at first… However; we believe that the graph is a relevant ‘right-hand’ tool in architecture. By embedding data in a structured manner, it paves the way for efficient iterations and decision making, design enhancement, and simulations. Being a tool that behaves as a data encoder, it also opens up the opportunity for scalability and machine learning for architecture.