
Opening a business is a bold investment. Factors (many out of business owners’ control) can determine whether or not local businesses thrive or struggle.
Location matters, especially for businesses that depend on foot traffic. But the bigger questions are tough to answer: where should the business open? What is a fair rent to expect? Which neighborhoods offer the best opportunities for target patrons? Typically, finding answers to these questions means dedicating hours getting to know different areas, talking to brokers, and trying to connect scattered bits of information to see a blurry image. Even then, there is no guarantee things will work out.
We use Barcelona as a case study and have built a dashboard that takes some of the guesswork out of location scouting by analyzing different datasets across districts in the city. This interactive dashboard combines four datasets from Open Data BCN into one map:
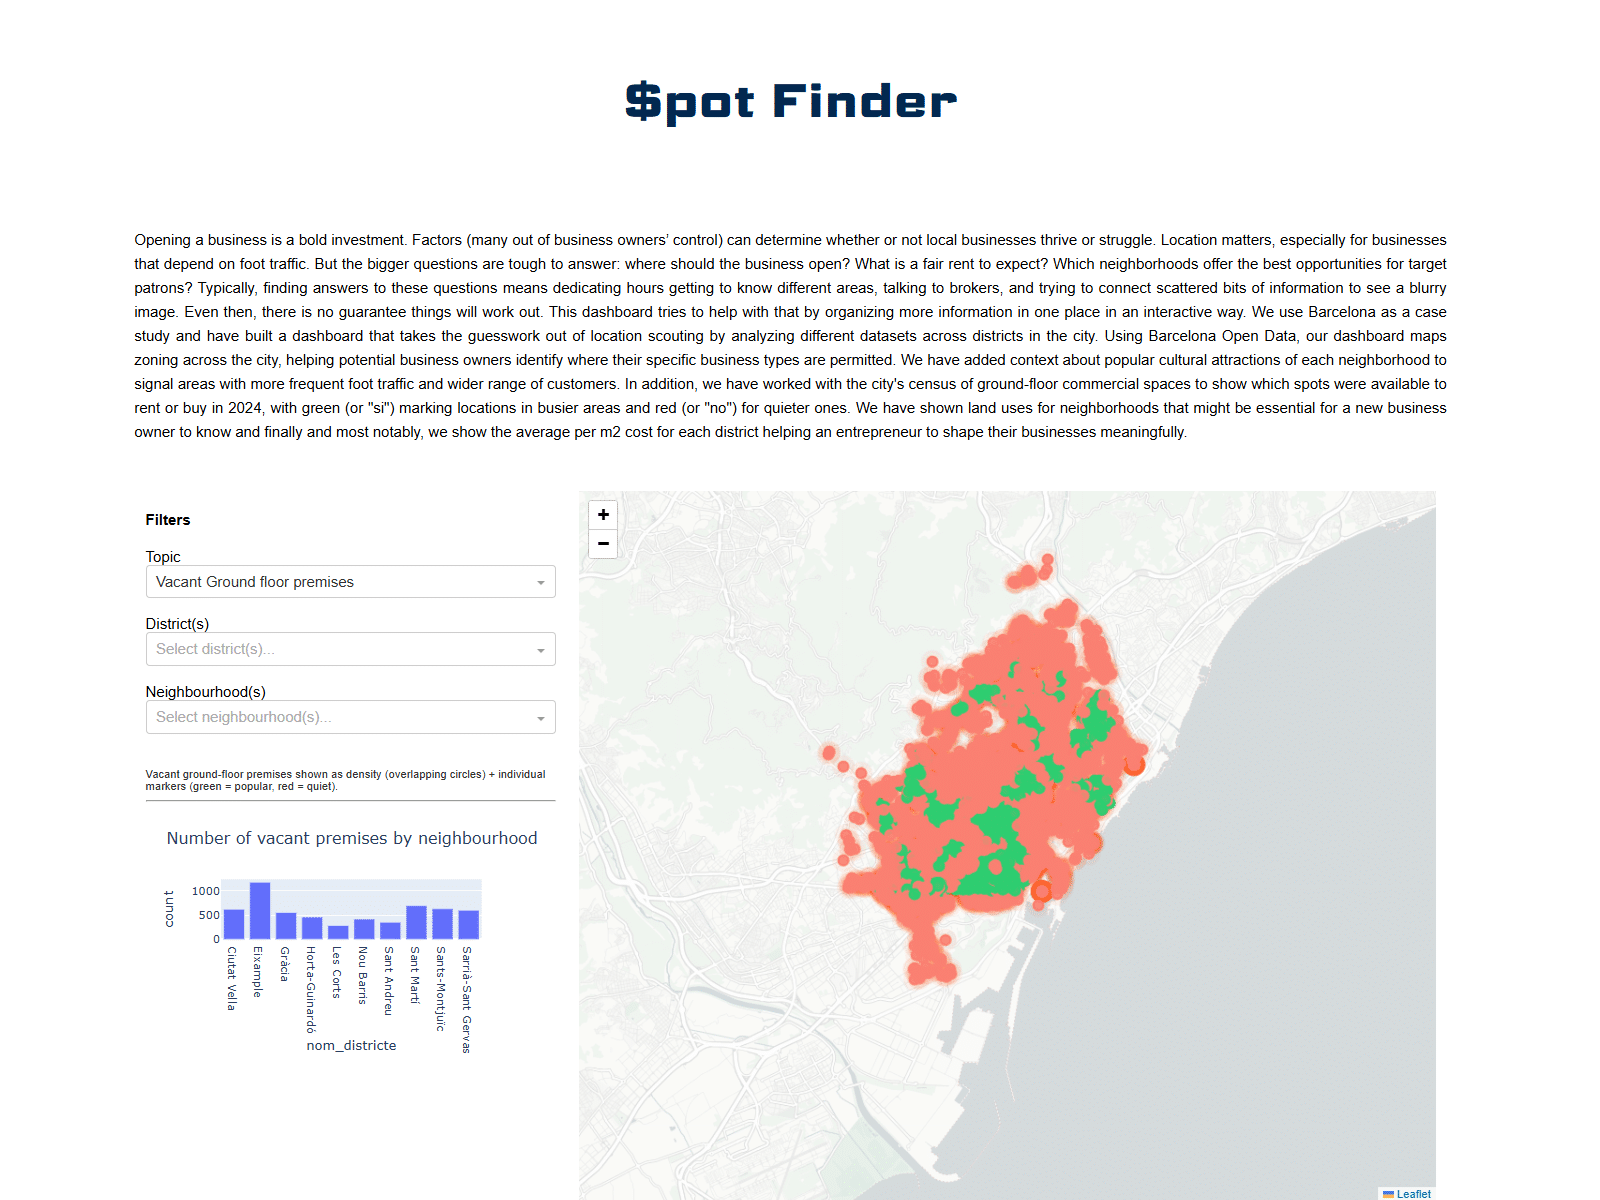
- Vacant ground floor premises for sale or rent
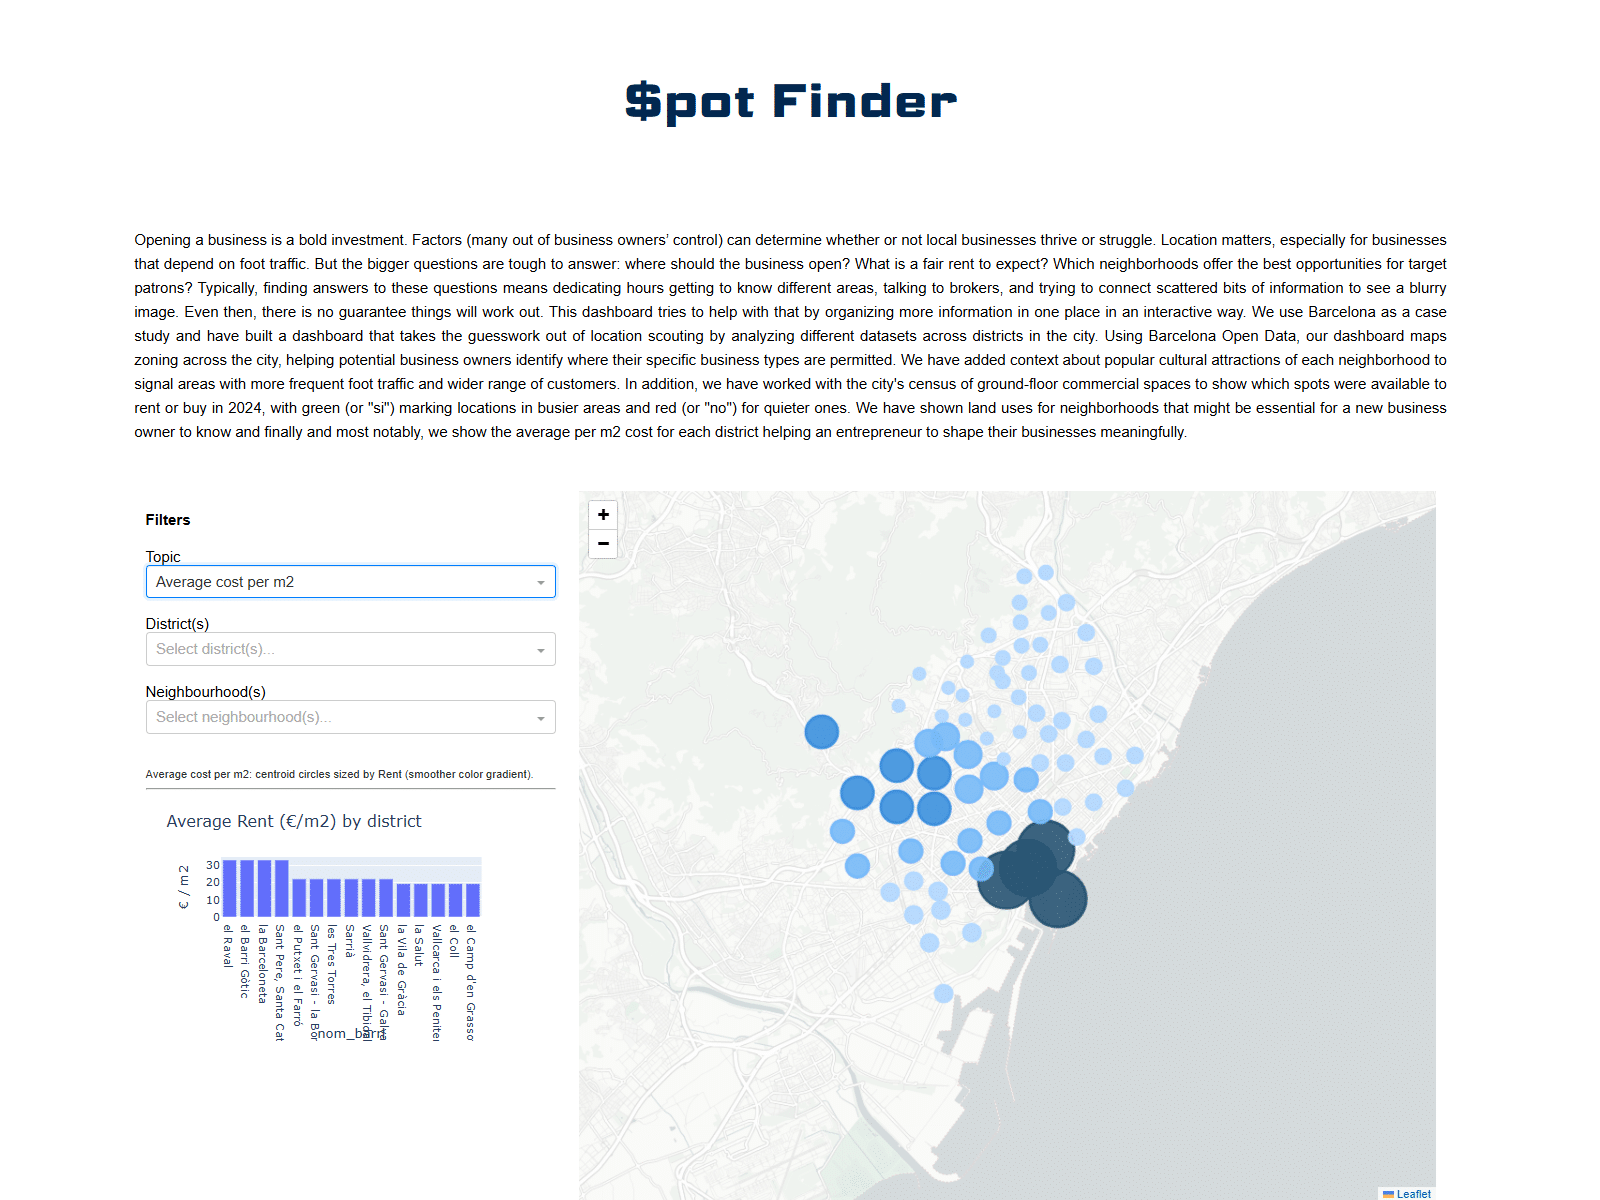
- 2024 average rental prices in euros per m2
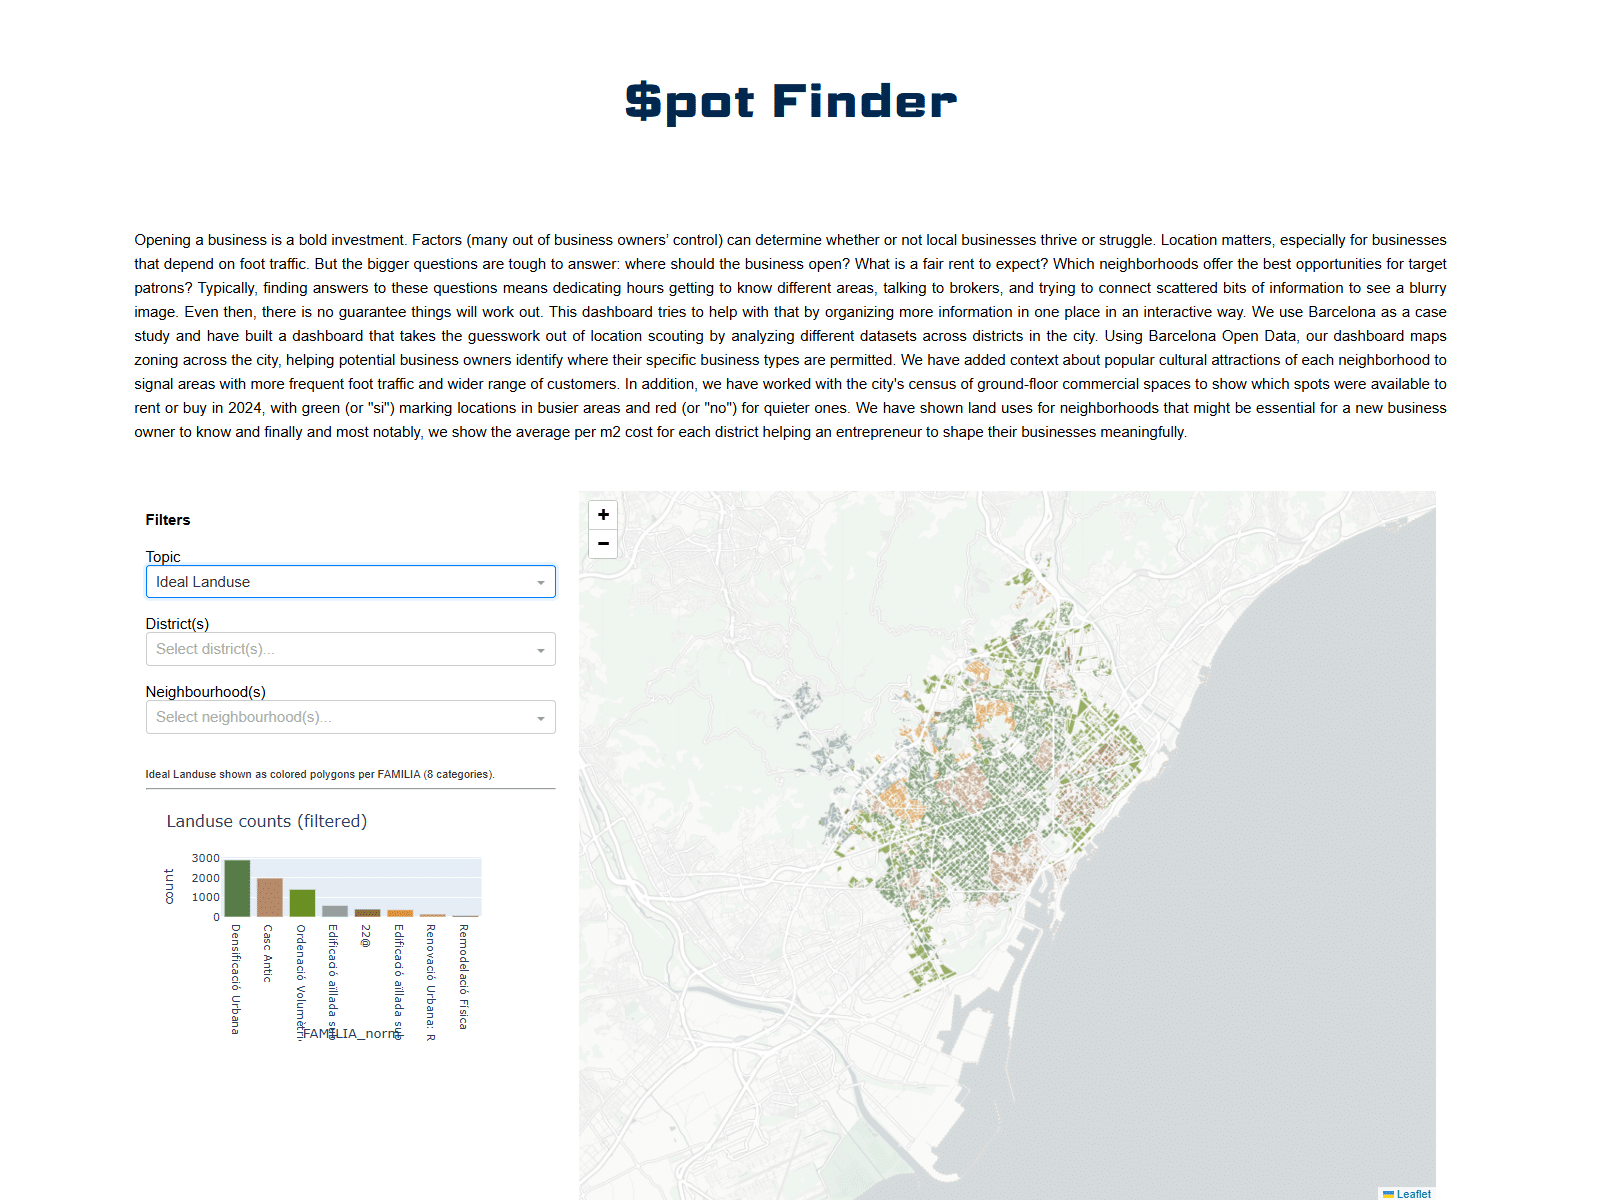
- Land use
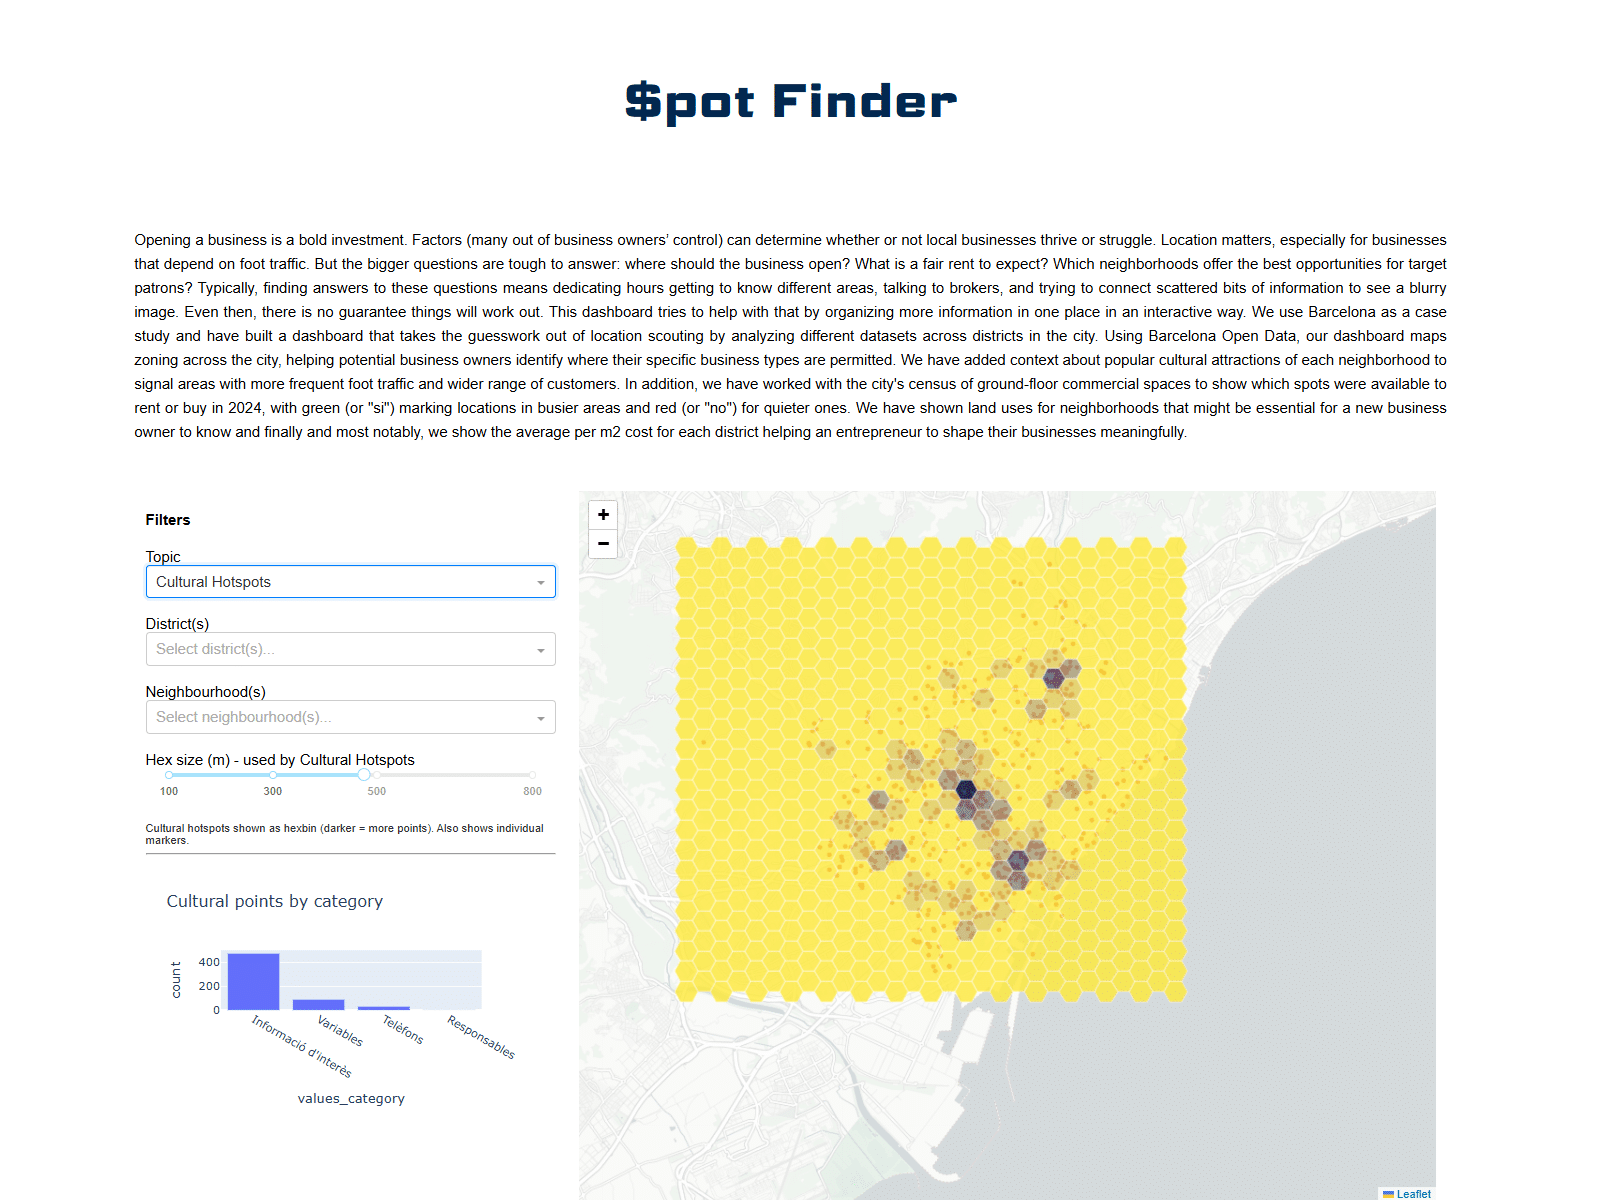
- Cultural hotspots
We coded the dashboard with python in Visual Studios Code to reflect the city’s census of vacant ground-floor commercial spaces to show which spots were available to rent or buy in 2024, with green (or “si”) marking locations in busier areas and red (or “no”) for quieter ones. We overlap the average cost in € per m2 cost for each district helping an entrepreneur to shape their businesses meaningfully. The dashboard shows ideal land uses important for business owners to understand before committing to a location. Finally, we added cultural hotspots throughout Barcelona. The dashboard also provides context around frequent foot traffic that may reflect a wider range of drop-in customers.
While opening a business is a bold investment, data and community knowledge can help inform a wise investment. Thank you for reading and please reach out with any feedback!
