
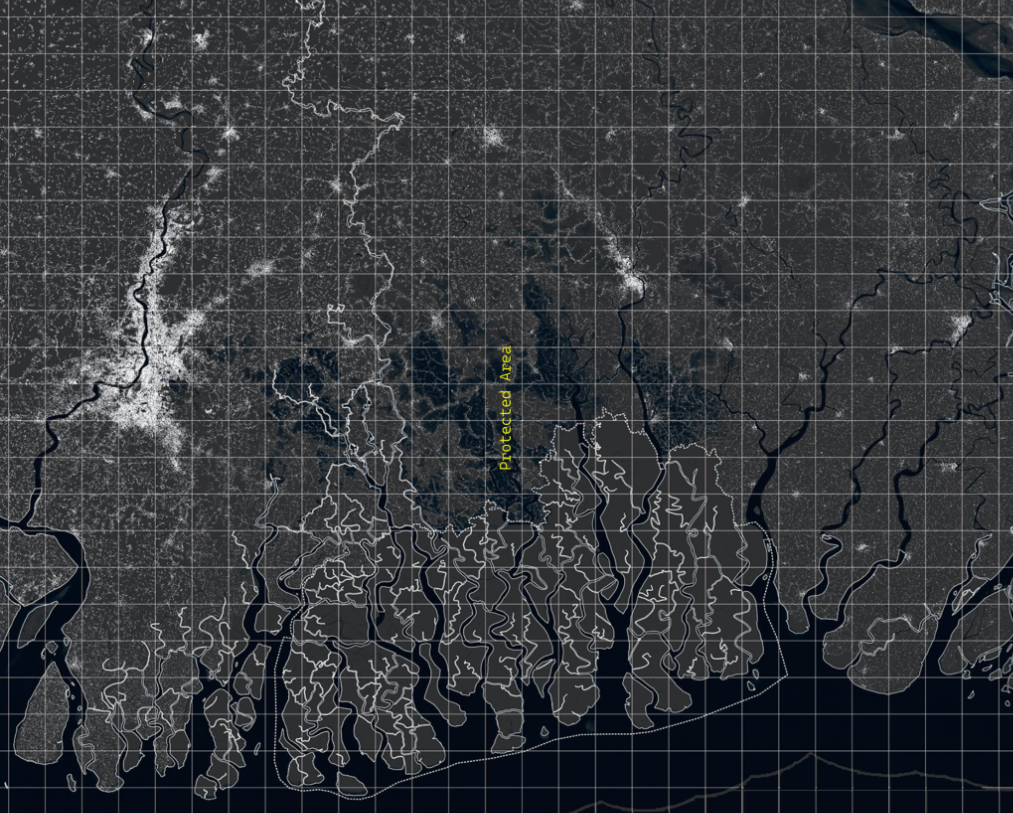
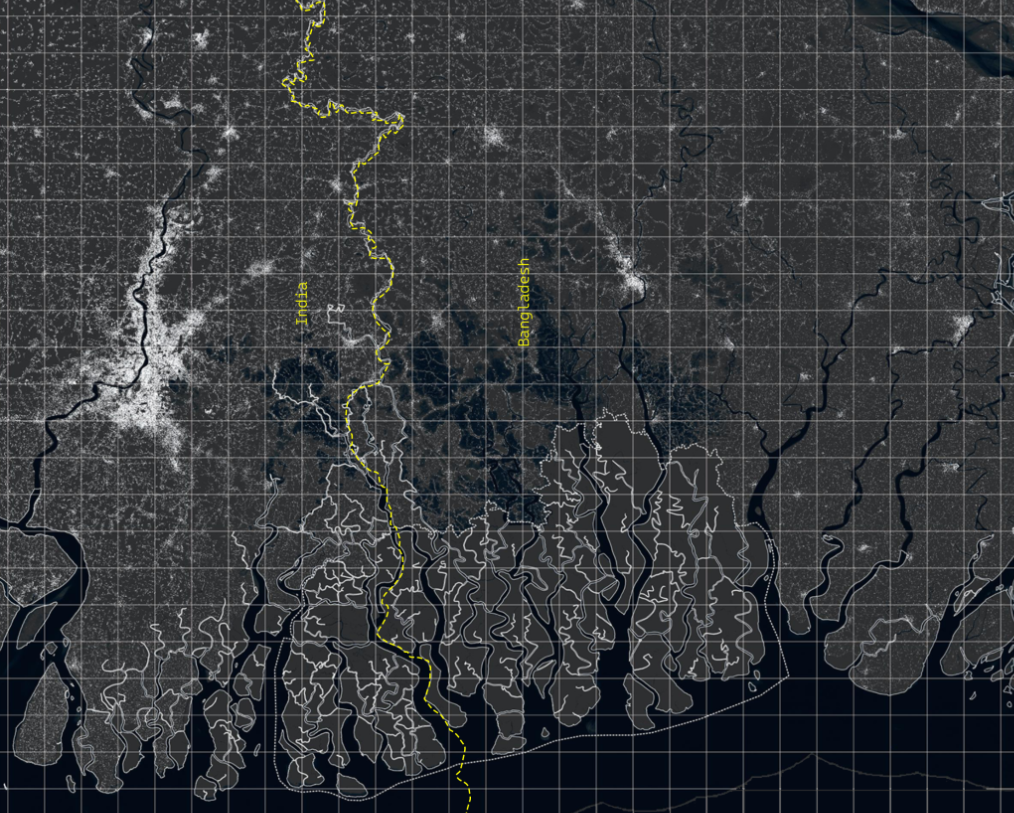
The Sundarbans Reserve Forest is the largest contiguous mangrove forest in the world. A wildlife sanctuary with an area of 139,700 ha, considered as a core breeding area for a number of endangered species (The Sundarbans, n.d.). and home of the Bengal Tiger.
STUDY AREA
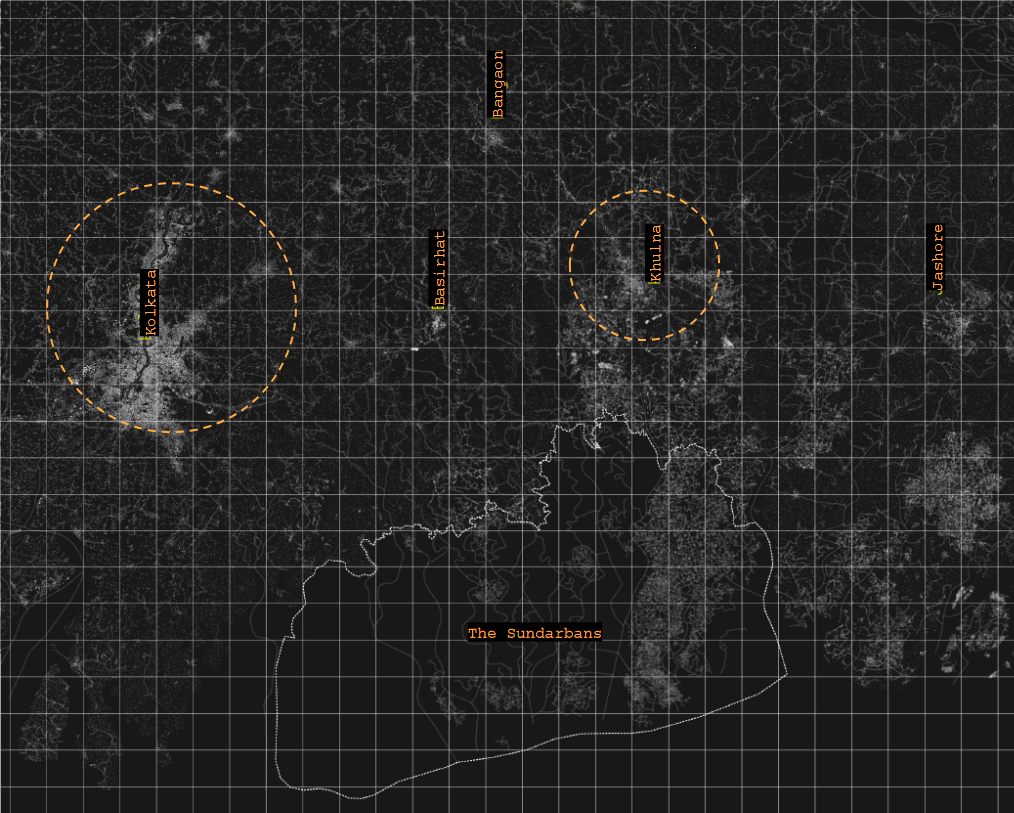
The Sundarbans is a shared protected area between India and Bangladesh. There are five major cities surrounding the Sundarbans which are: Kolkata, Basirhat, Bangaon, Khulna and Jashore; with Kolkata and Khulna as the most important.
Kolkata, India is the capital and largest city of the India state of West Bengal (the urban agglomeration encompasses 72 cities and 527 towns and villages), is a financial and commercial centre with an estimated population of 15.5 million people.
Khulna, Bangladesh is the administrative centre of the Khulna District and is the second largest port city of the country, is the industrial centre for the nation’s largest companies (seafood packaging and food processing) with an estimated population of almost 1 million people.
CASE STUDY: HUMAN & NON-HUMAN COEXISTENCE
The Sundarbans, a sprawling mangrove forest spanning the delta of the Ganges, Brahmaputra, and Meghna rivers, is both a lifeline and a threat to its inhabitants. This UNESCO World Heritage site, renowned for its biodiversity, is home to the iconic Bengal tiger, whose presence has left a profound mark on the lives of local communities. Among them are the “tiger widows”—women who have lost their husbands to tiger attacks while the men ventured into the forest for fishing, honey gathering, or wood collection. These widows bear the scars of a unique proximity to nature—one that is both nurturing and unforgiving. The Sundarbans provide the very sustenance these communities depend on, yet this comes at an enormous cost, illustrating the duality of life at the edge of wilderness.
This case underscores a central paradox: nature as both a source of vitality and vulnerability. The Sundarbans not only sustain livelihoods but also serve as a natural barrier against cyclones and rising seas, protecting millions from the brunt of climate change. Yet, as climate shifts intensify, the risks to those living within its boundaries grow. Inspired by this tension, we used digital cartographies to explore the idea of proximity—how physical closeness to nature shapes relationships, survival, and identity. By mapping the intricate connections between people and the environment, we aim to shed light on the complex interdependence that binds human lives to the natural world, even in its harshest moments.
THE HUMAN: URBANIZATION
“In every region of the globe, ‘wilderness’ spaces are being transformed and degraded through the cumulative socio-ecological consequences of unfettered worldwide urbanisation.” (Brenner & Schmid, 2012).
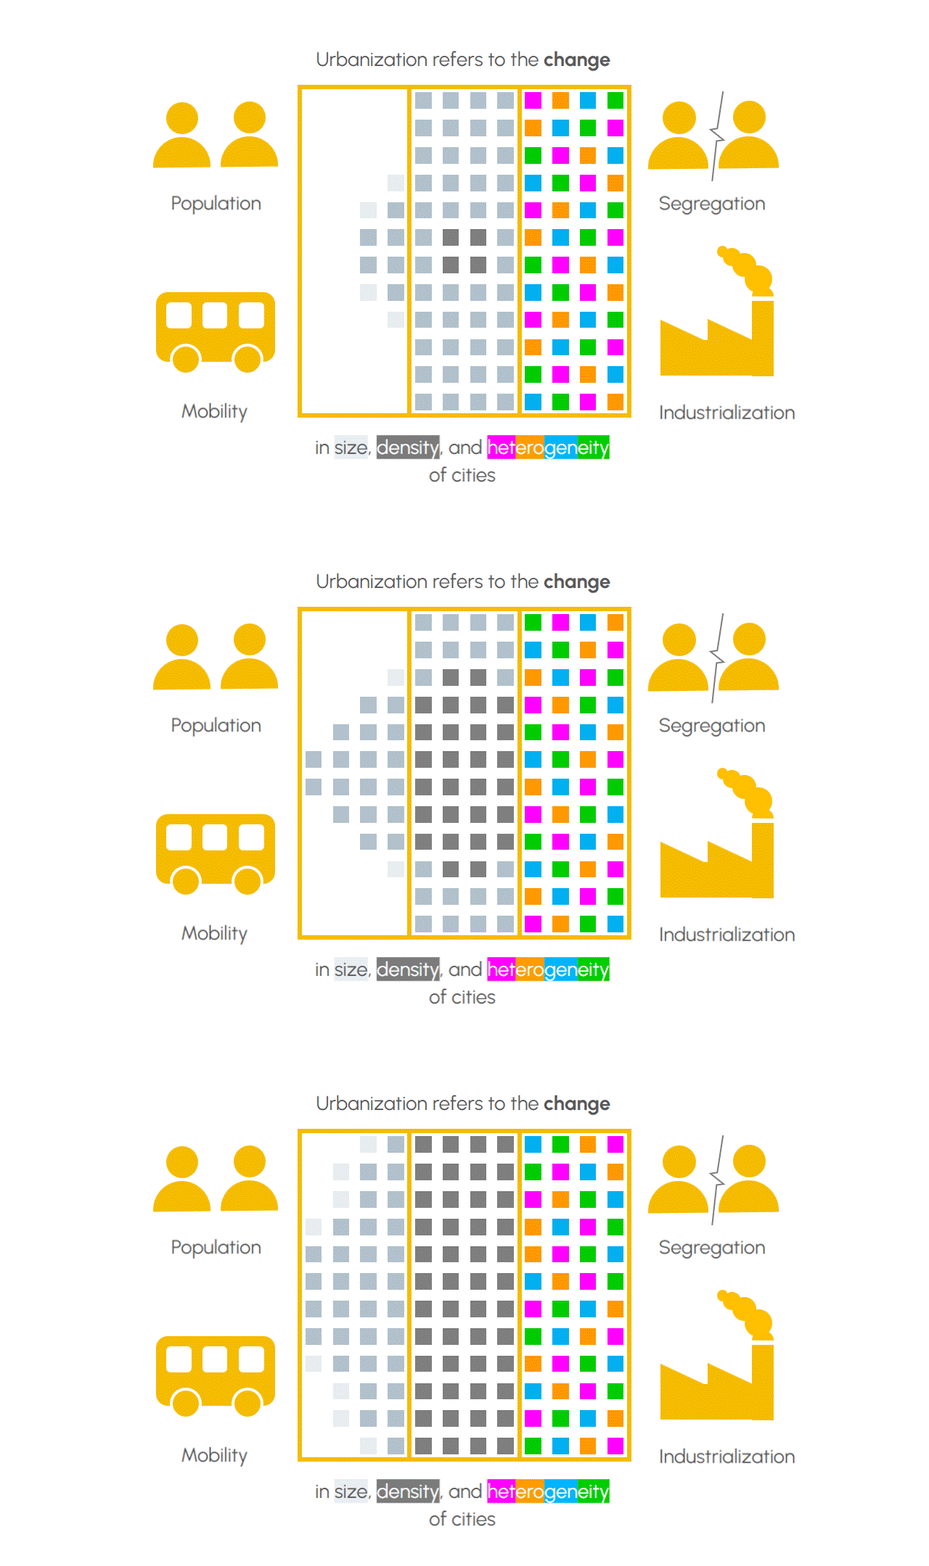
Begining with the human layer, we start the analysis with Urbanization, which refers to the change in size, density and heterogeneity of cities, and involves factors such as population, mobility, segregation and industrialization (Vlahov & Galea, 2002).
DEGREE OF URBANIZATION

The Degree of Urbanization dataset on Google Earth Engine classifies global land into urban, rural, and intermediate (towns and semi-dense areas) zones based on population density and settlement patterns. It aids in urban planning, monitoring, and sustainable development by providing consistent spatial data across various timeframes and geographic scales.
The GIF of the Degree of Urbanization from 1975 to 2030 illustrates the spatial evolution of the Sundarbans region and its surroundings, including major cities like Kolkata and Khulna. It highlights the transition from rural to peri-urban and urban areas, showcasing trends such as urban expansion, peri-urban sprawl, and settlement densification. This dynamic visual reflects the shifting population distribution and human impact in this ecologically and economically significant region over time.
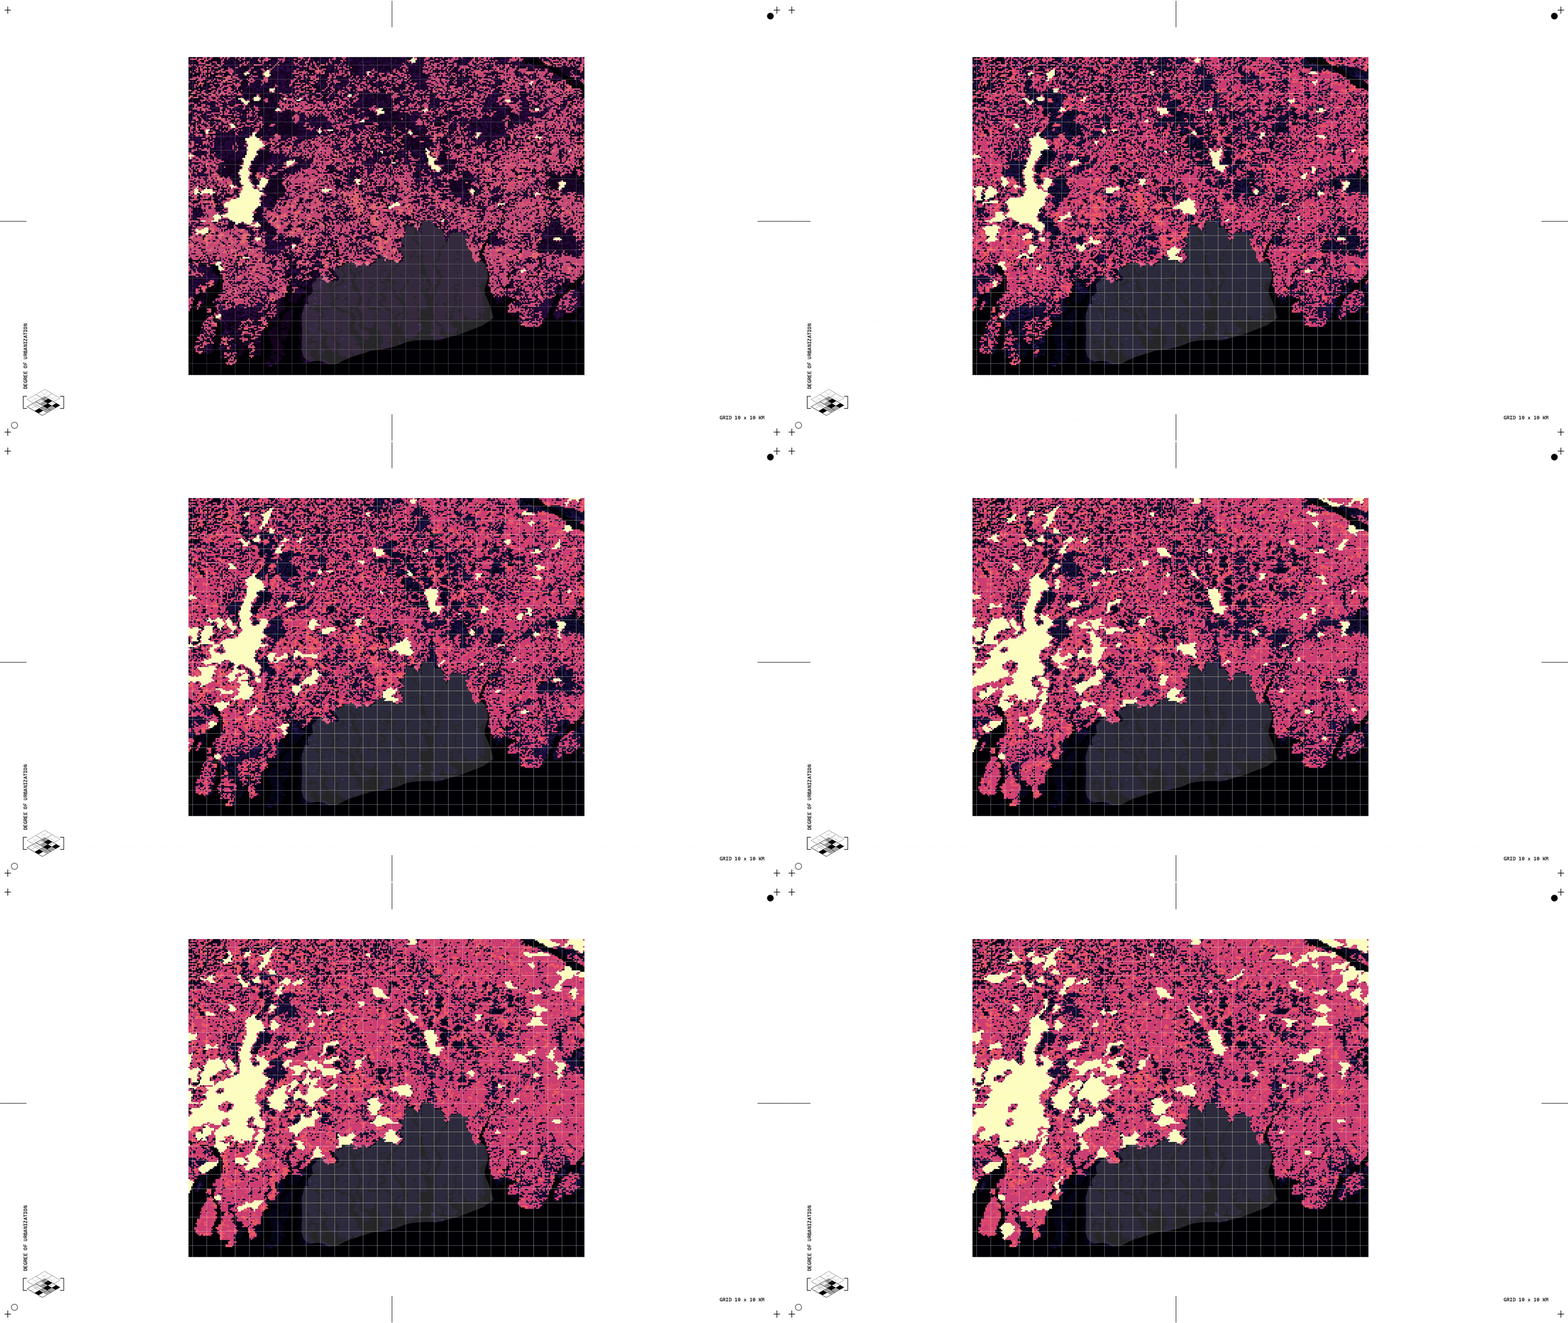
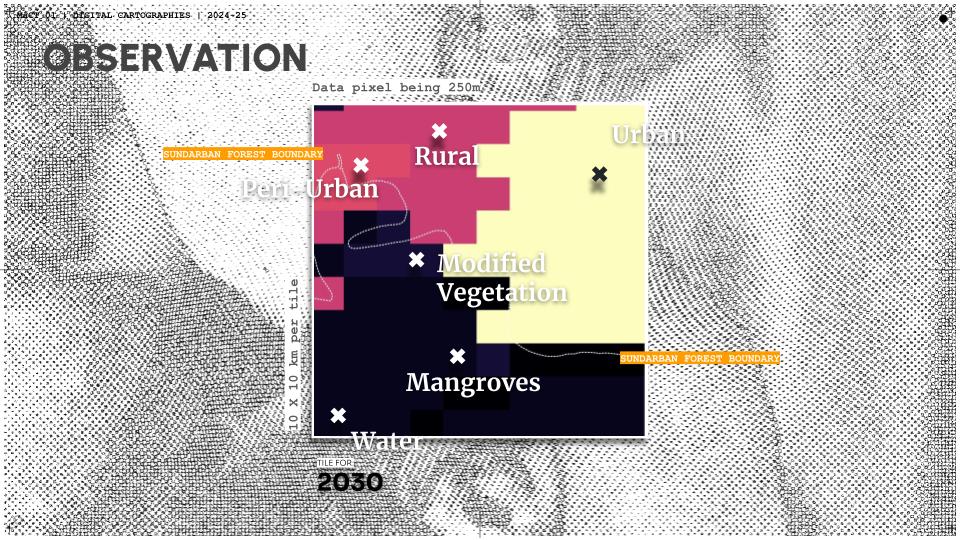
Zooming in on the proximity of features in the Degree of Urbanization dataset for the Sundarbans reveals a close relationship between urban, peri-urban, and rural zones, especially around major cities like Kolkata and Khulna. The presence of urban areas is increasingly encroaching on peri-urban and rural lands, with urban sprawl moving closer to fragile ecosystems like mangroves. As urbanization advances, the distance between dense urban centers and natural features like wetlands and forests decreases, placing more pressure on these ecosystems. The close proximity of these features indicates a growing conflict, where urban expansion threatens the health and sustainability of the surrounding natural environment, such as the Sundarbans. This proximity highlights the urgent need for sustainable urban planning to prevent further ecological degradation while accommodating growth.
THE NON-HUMAN

“One tree equals one life, and if I can earn some money while conserving the forest, then yes, I will do everything in my power to save the Sundari trees.”
Geeta Mridha, TIGER WIDOW (Atmos, 2022)
VEGETATION [NDVI 2018]

The NDVI 2018 dataset quantifies global vegetation health using satellite imagery. Values range from -1 to +1, with negative values indicating non-vegetated areas (e.g., water), and positive values reflecting vegetation density. It aids in monitoring land cover, agriculture, and ecosystem changes, offering insights into vegetation conditions during that year.
The NDVI 2018 dataset offers crucial insights into the Sundarbans mangroves and surface water dynamics. Derived from satellite imagery, it measures vegetation health and density, with values ranging from -1 to +1. Dense mangrove forests exhibit high NDVI values (above 0.3), reflecting their lush, healthy vegetation. In contrast, surface water bodies show negative or near-zero values, indicating the absence of vegetation. This dataset is essential for monitoring mangrove health, detecting ecosystem changes, and understanding the interaction between vegetation and water bodies. It supports conservation efforts by identifying areas of degradation and helps ensure the ecological balance of the Sundarbans.
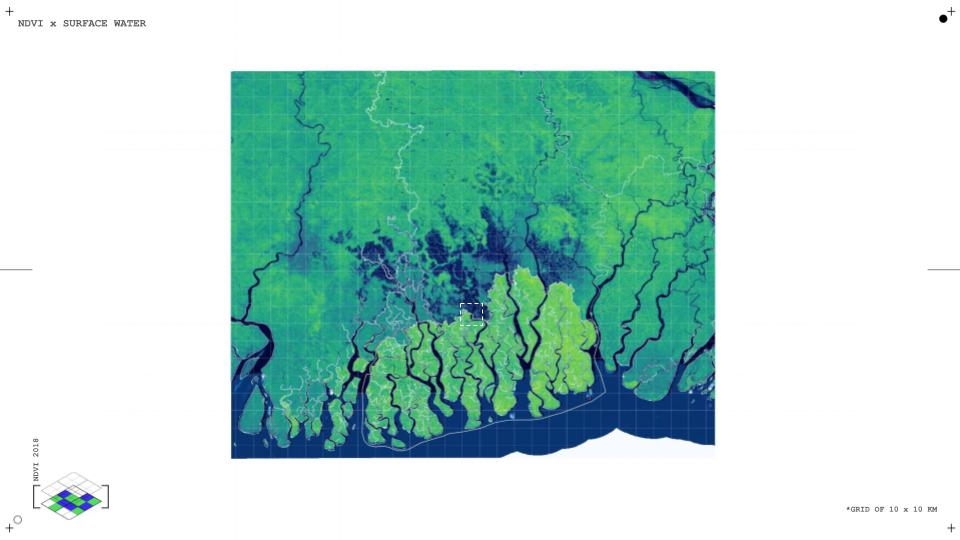
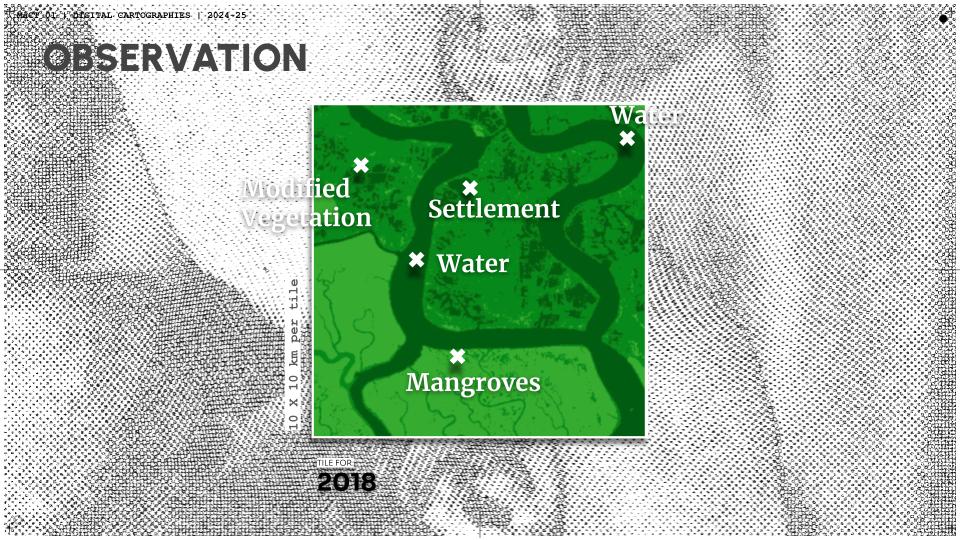
Zooming into the NDVI 2018 dataset at a resolution of 10×10 km with a pixel size of 250m for the Sundarbans provides detailed insights into mangrove health and surface water distribution. Each pixel represents a 6.25-hectare area, capturing variations in vegetation density and water coverage. High NDVI values (above 0.3) within mangrove regions highlight healthy, dense vegetation, while near-zero or negative values correspond to water bodies or barren areas. This level of granularity allows for precise monitoring of mangrove ecosystems, detection of localized changes, and a better understanding of the spatial balance between vegetation and surface water in the Sundarbans.
CONFLICT/INTERACTION

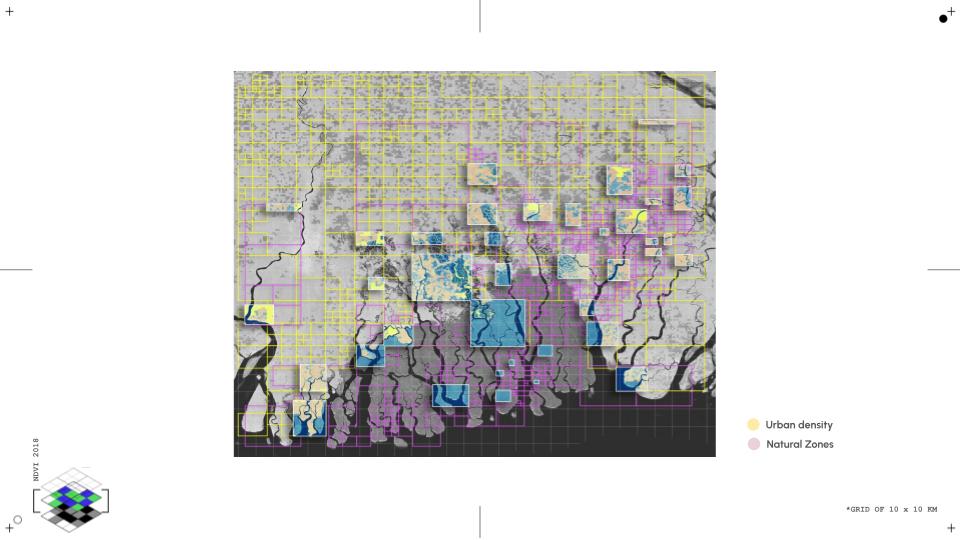
Overlaying NDVI and Degree of Urbanization datasets highlights conflicts between urban expansion and ecological preservation in the Sundarbans. Urban zones encroaching on high NDVI mangroves reveal habitat loss and reduced vegetation. This visual emphasizes the urgent need for sustainable planning to balance development with the conservation of fragile ecosystems.
The NDVI and Degree of Urbanization datasets for the Sundarbans reveal a clear conflict between urban expansion and ecological preservation. Urban growth, particularly around cities like Kolkata and Khulna, encroaches on mangrove forests, as seen through declining NDVI values. This urban spread replaces vital mangrove areas, which are crucial for biodiversity and coastal protection, with built-up environments. The result is the loss of essential green spaces, increased vulnerability to natural disasters like cyclones, and mounting pressure on fragile ecosystems. This contrast highlights the need for sustainable development strategies to protect the Sundarbans’ biodiversity while accommodating urban growth.
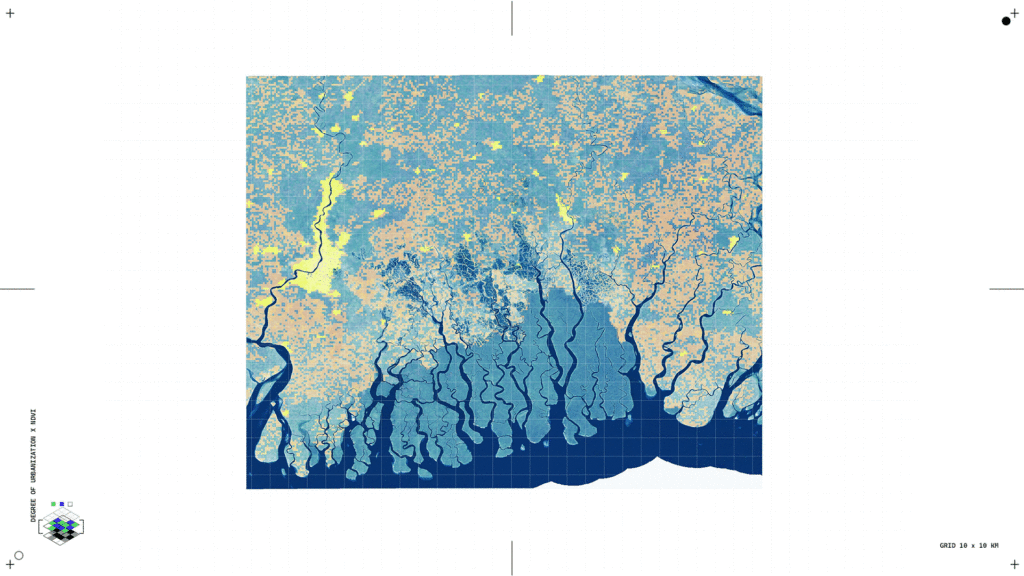
To study the urbanized areas around the Sundarbans, we first focus on regions with significant urban growth, like Kolkata and Khulna. By analyzing the Degree of Urbanization data at a higher resolution, we identify areas with high urbanization and group them into clusters. These clusters show where urban areas are expanding. We also measure how close these urban zones are to sensitive natural areas, like mangroves. This analysis helps us understand how urbanization is affecting the Sundarbans and highlights the need for better planning to protect the region’s ecosystems while allowing for growth.
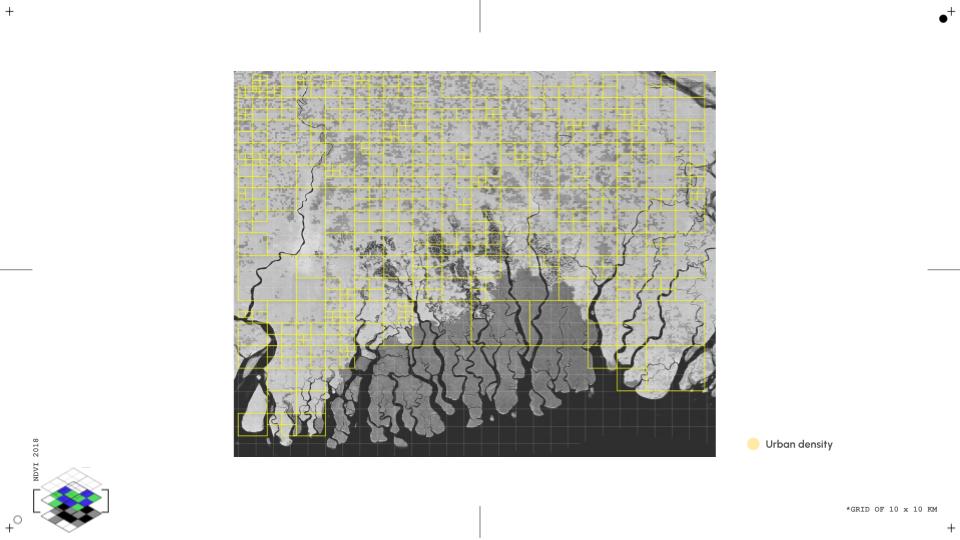
To study the healthy vegetation in the Sundarbans using the NDVI 2018 dataset, we focus on regions with dense, healthy mangrove forests. By analyzing the NDVI values, we can identify areas with high vegetation health, where values above 0.3 indicate thriving plant life. These areas are essential for biodiversity and coastal protection. We also assess how close these healthy vegetation zones are to urban or developed areas. This analysis helps us understand the distribution of mangrove forests, track changes in vegetation health, and highlights the importance of preserving these vital ecosystems amidst growing urban pressures.
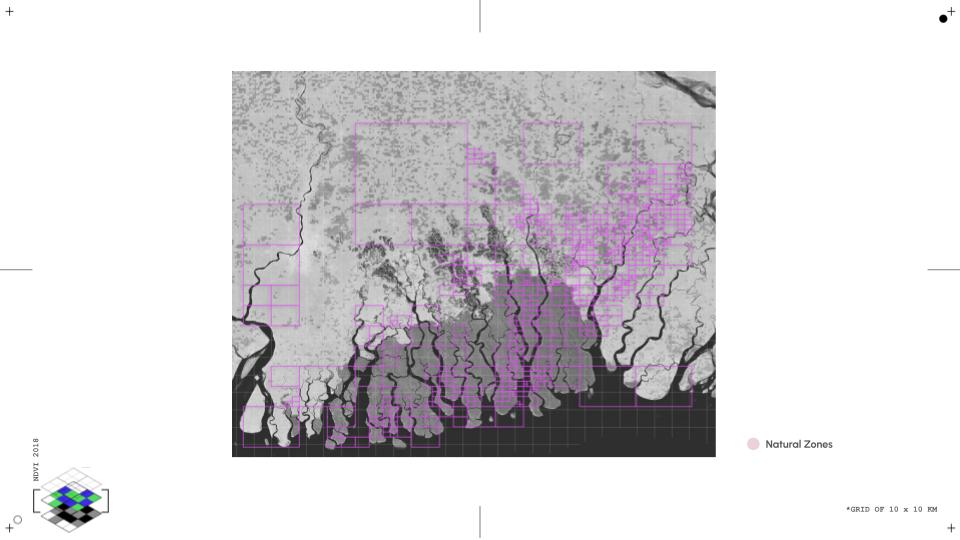
By analyzing the NDVI 2018 dataset for healthy vegetation in the Sundarbans alongside the Degree of Urbanization data, we can identify clusters where urban growth intersects with dense mangrove forests. This comparison highlights areas of conflict, where expanding urbanization threatens the integrity of vital ecosystems. These problematic regions, where urban sprawl encroaches on healthy vegetation zones, reveal the pressure on the Sundarbans’ natural resources. The overlapping of these grids emphasizes the urgent need for sustainable planning to safeguard mangroves and other ecosystems while accommodating urban development, ensuring the balance between growth and environmental preservation.
PROXIMITY
“Cities consist of more than cement and humans; they contain complex inter-relationships among different species living in close proximity, the proximity of which intensifies their interactions.” (From nature in cities to the nature of cities, 2024).

In order to observe the interactions between humans and non-humans, we move on to the layer of Proximity.
Proximity means to be near, to be close, to share. So in this case where we have a landscape proximity between human activity and non-human ecosystems, we defined the proximity as a shared space where natural habitats and human settlements coexist, ideally fostering mutual resilience.

We can observe Kolkata’s urbanization is the biggest one, but as well we can observe smaller but highly dense urban clusters touching the sundarbans perimeter, mostly communities from the side of India like Pathar Patrima and Gosaba, and Gabura Union from Bangladesh. In this case, the human is immediately close to the non-human.
We decided to analyze the proximity between the highly dense urban clusters (in yellow) and the highly dense vegetation clusters from the NDVI (in green). For this to be made, we took the centroid from both human / urban and non-human / vegetation areas, and as well we included an information layer of tiger sightings into the proximity analysis.
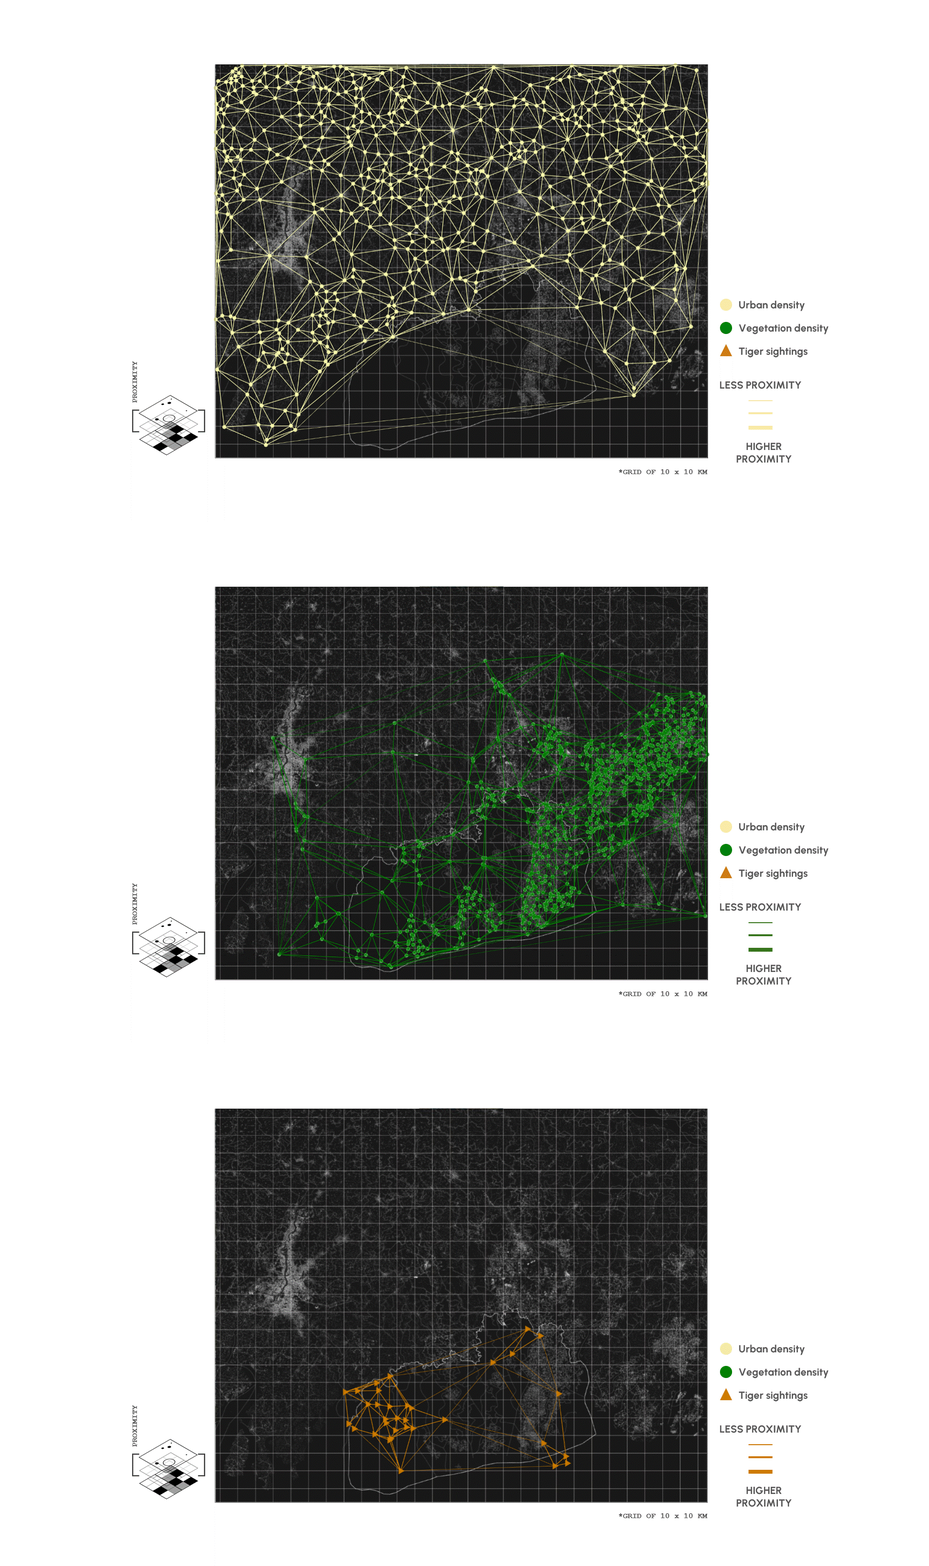
To start, the analysis was made by each actor individually. First, the urban density centroids proximity showed that we have multiple presence of urban centroids close to each other at the south of Kolkata, and next to the Sundarbans. Second, the vegetation density centroids proximity showed a major presence in the Bangladesh side and at the south & east of the Sundarbans. Third, the tiger sightings are closer to each other on the Indian side than the Bangladesh side. It is interesting to see that the tiger sightings happen more where there is a less presence of vegetation, although we also have to consider that this data has a bias because it comes from a human perspective, and has more to do with the spaces where the human is going deeper into the sundarbans than of where the tigers tend to actually go or move around the area.
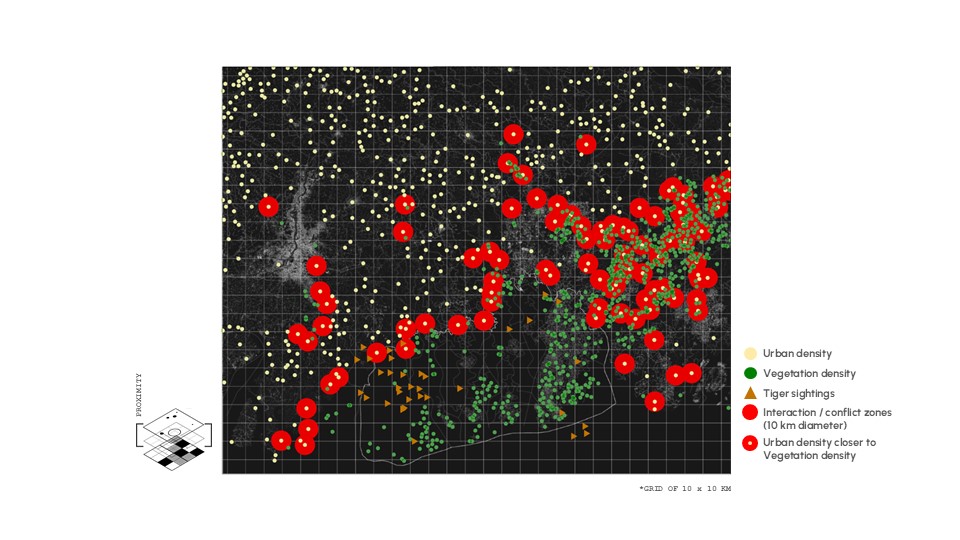
Finally, we located the urban settlements that are closer to vegetation density and established a 10 km diameter buffer around them and defined it as an Interaction-Conflictive Zone. From this we can observe that tigers and urban settlements are close to each other (explainable due to the bias explained before) mainly in the Indian Sundarbans side, making us reflect that the minor the distance, the greater the interaction and the possibility of conflict of the shared space, creating situations like those of Tiger Widows.
LANDSCAPE CONNECTIVITY
A shared space where biodiversity and human activity coexist, sustaining one of the world’s most vital ecosystems.
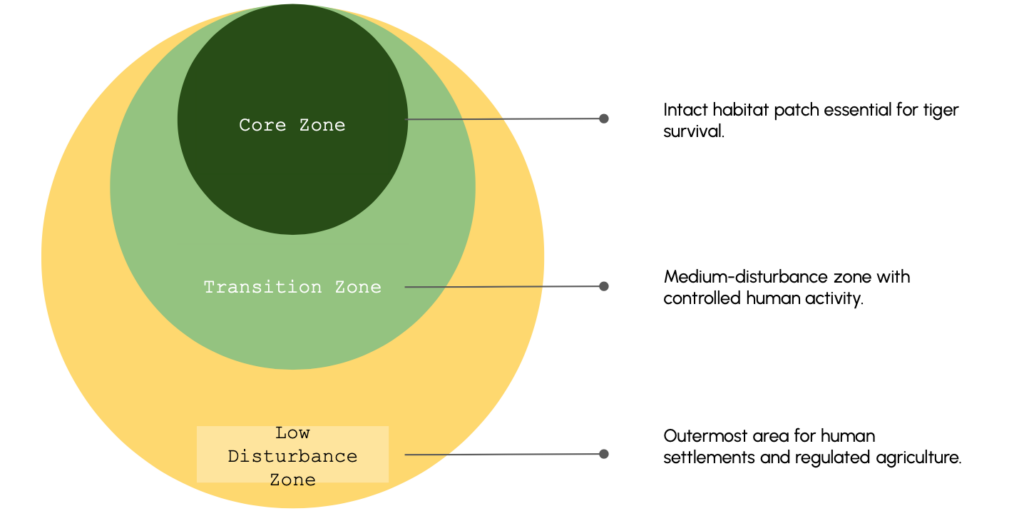
Core habitats are the most ecologically sensitive regions within a forested area, often identified as zones of minimal human disturbance where biodiversity thrives. These areas serve as critical habitats for wildlife, providing breeding grounds, food resources, and shelter essential for the survival of numerous species. By limiting human activity in core zones, conservationists aim to preserve the ecological balance and protect endangered flora and fauna. In geospatial studies like the Panchet Forest Division case, core habitats are delineated using satellite imagery, terrain analysis, and biodiversity data, ensuring a scientific approach to habitat conservation and management (Mandal & Das Chatterjee, 2019).
Surrounding the core habitat lies the buffer zone, a transitional area designed to minimize the impact of human activities on the core. Buffer zones act as a protective shield, allowing controlled and sustainable use of forest resources while reducing direct pressure on the critical habitats. Low-disturbance areas further extend this concept, representing regions where human presence and activities, though permitted, are regulated to maintain a balance between conservation and livelihood needs. Together, these zones form a tiered management approach that integrates ecological preservation with the socioeconomic realities of communities reliant on forests, offering a sustainable framework for habitat protection. The buffer zone limit for biodiversity protection in the Sundarbans typically ranges from 10 km to 25 km around the core mangrove forests, depending on the specific conservation guidelines and management policies of the region (Mandal & Das Chatterjee, 2019).
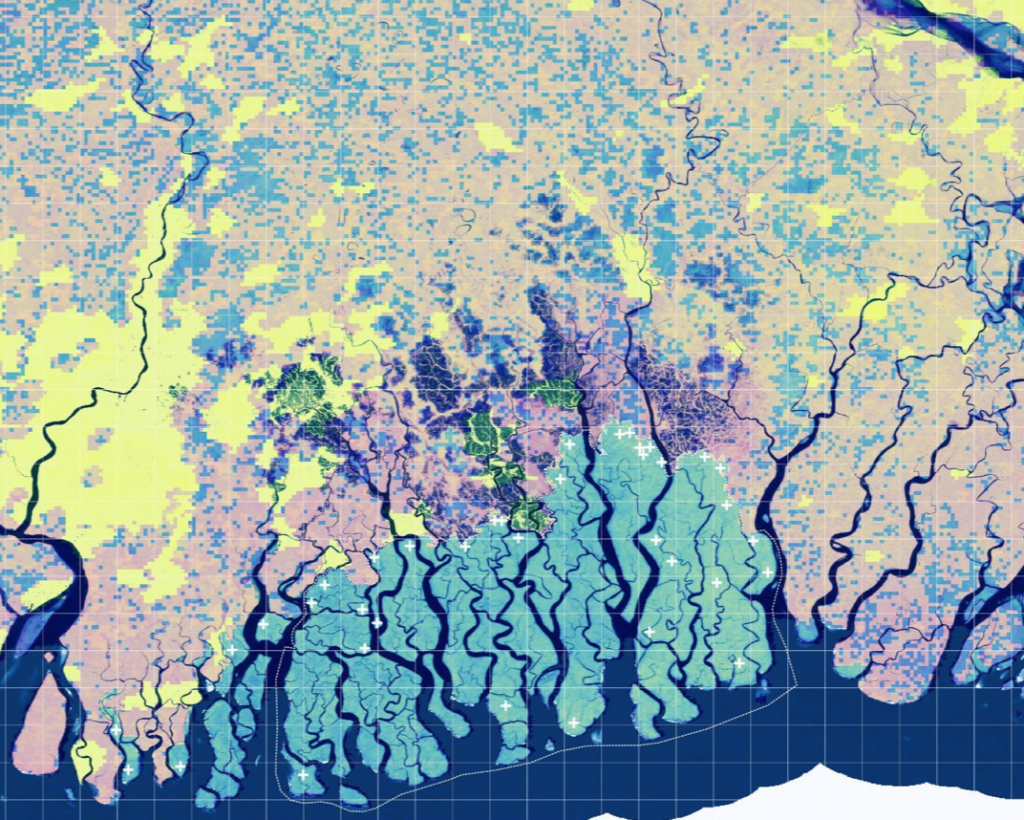
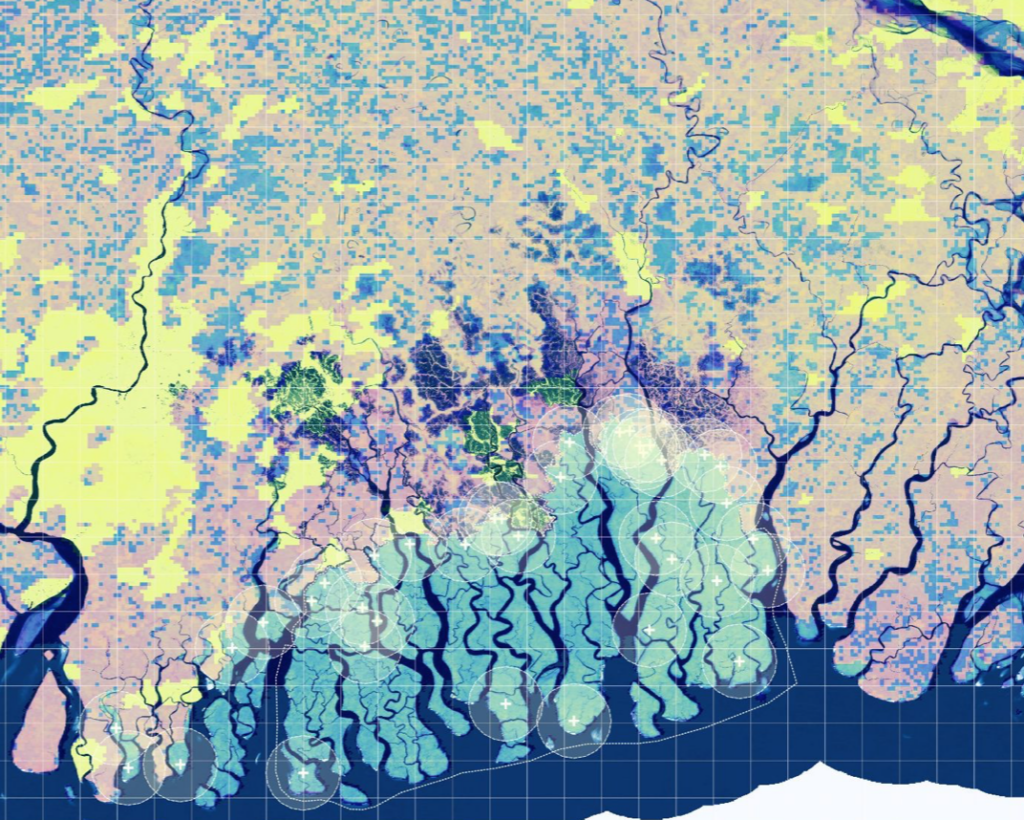
Using NDVI (Normalized Difference Vegetation Index) analysis, we identified areas of healthy, dense vegetation near the protected boundary of the Sundarbans Reserve. These points of high vegetation health stand out as critical zones where the interplay between human and non-human activity becomes especially pronounced. The proximity of these vibrant ecosystems to the reserve’s edges raises compelling questions about the dynamics of human influence and ecological preservation. Are these zones benefiting from the protection afforded by the reserve, or do they represent areas of tension where human proximity might lead to encroachment or conflict? This observation sparked our interest in exploring how these overlaps between human and non-human territories shape ecological and social landscapes, particularly in regions as sensitive and intertwined as the Sundarbans.
Circuitscape
Circuitscape is a powerful tool for analyzing connectivity in landscapes using electrical circuit theory. It models ecological processes such as animal movement, gene flow, and habitat connectivity by treating the landscape as a resistance surface, where lower resistance values indicate easier movement or flow. For our analysis, we assigned a resistance value of 1 to urban areas, representing low connectivity for non-human movement, and a resistance of 99 to dense vegetation, reflecting high connectivity for ecological processes. This approach allowed us to simulate movement patterns and explore the interplay between human development and ecological systems.
Based on density clusters observed in the Sundarbans, we selected two typologies to study—each representing different configurations of human and non-human presence. One of these locations lies on the West Bengal side of the Sundarbans (typology A), while the other is situated on the Bangladeshi side (typology B), enabling us to compare connectivity and proximity dynamics across these geopolitical boundaries.
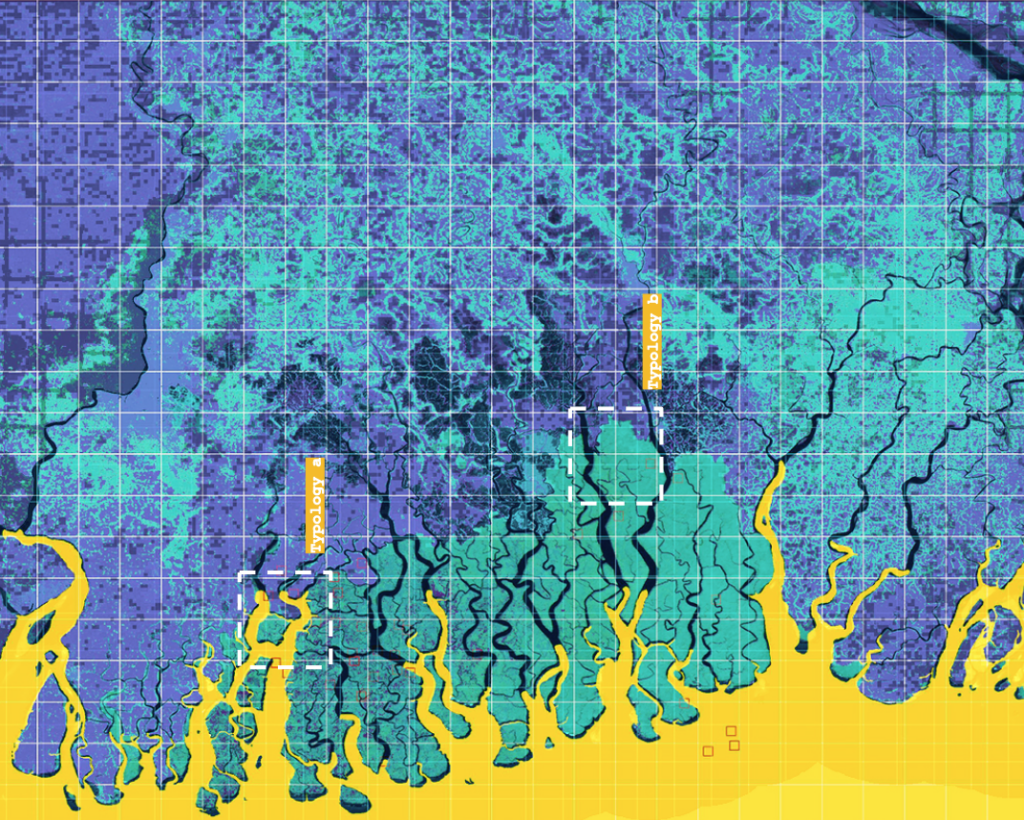
The resistance map highlights the richness of habitats in urban areas by showing how certain sites, despite being hotspots of urban density, still maintain significant ecological value. These areas are often characterized by fragmented yet resilient habitats, such as green spaces, parks, and corridors that support biodiversity. Even in densely developed regions, these sites can serve as vital refuges for various species, offering crucial resources and shelter. The map illustrates how urban landscapes can harbor valuable habitats, showcasing the importance of preserving and enhancing these spaces for urban wildlife and ecosystem services.
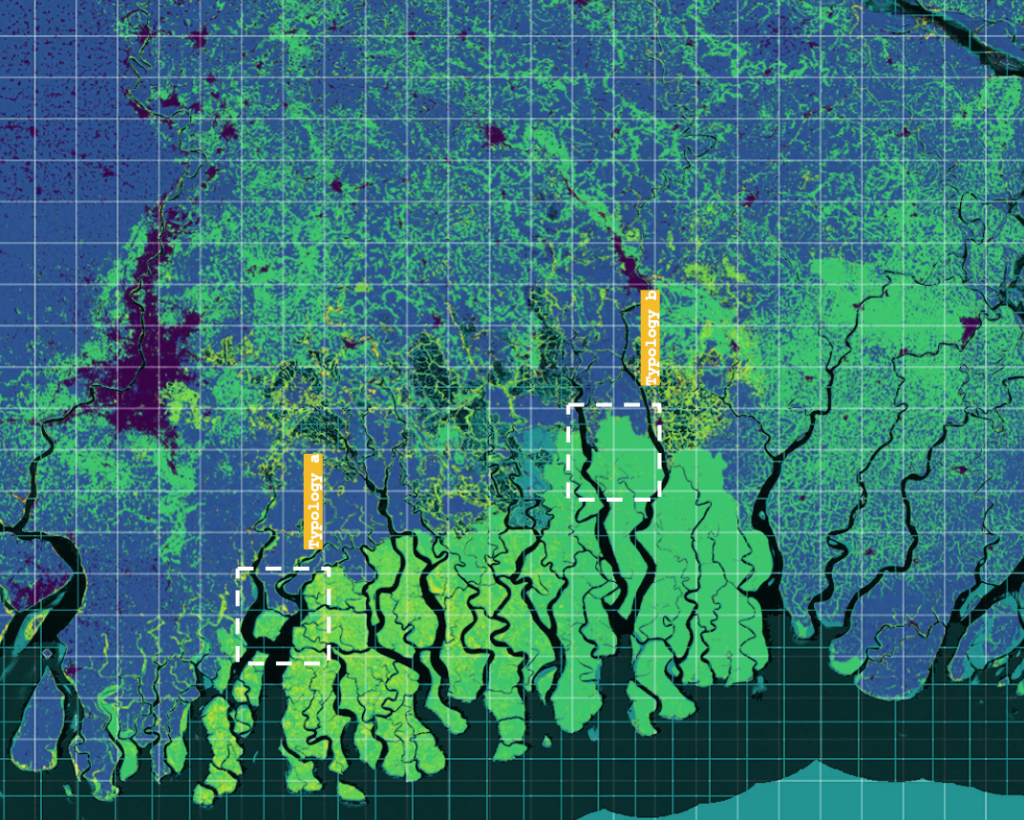
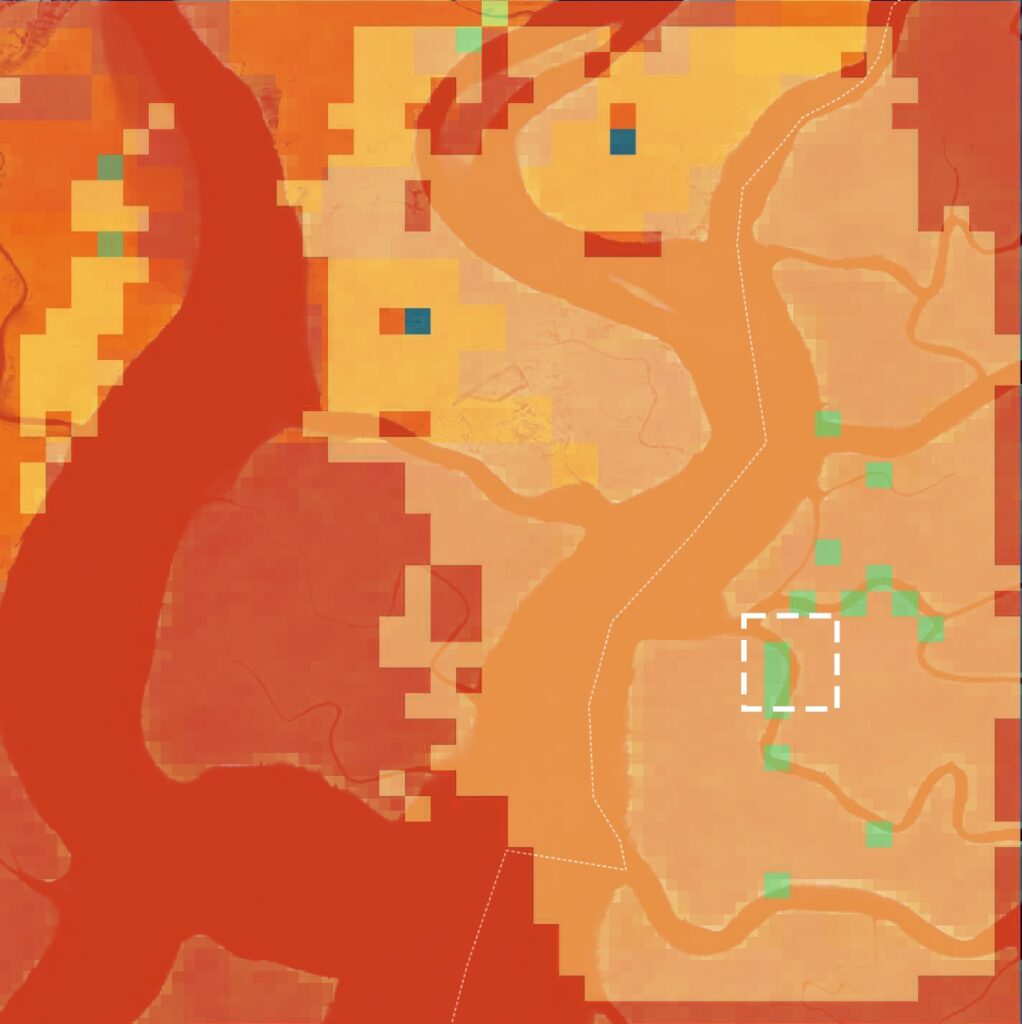
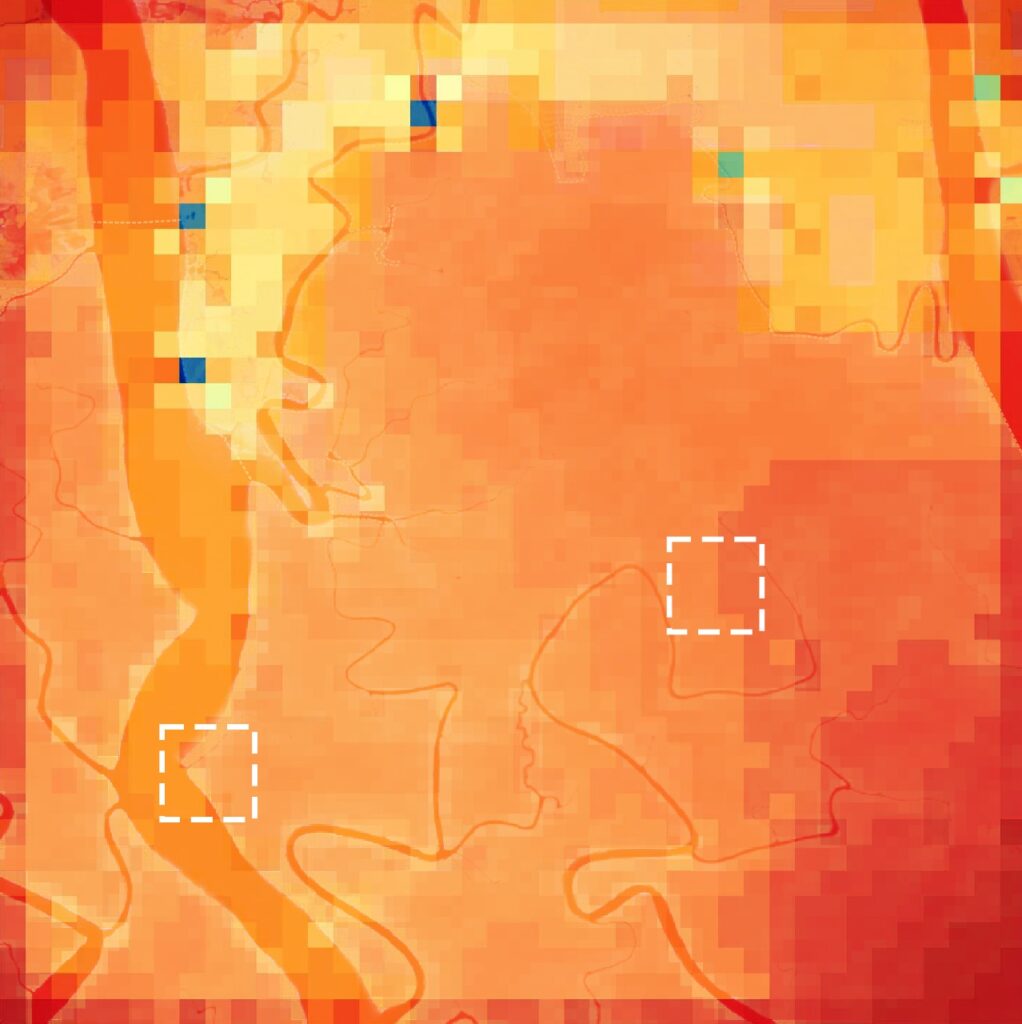
On the West Bengal side, just outside the Sundarbans border, the dotted square marks a recent tiger sighting. The blue pixels represent urban density spots, while the green pixels indicate areas of dense vegetation. The lighter orange shades highlight the growing connectivity between these areas. Despite the presence of water streams and rivers acting as a barrier between rich wildlife and human settlements, this natural boundary is insufficient. There is a need for a buffer zone around the core wildlife areas to better protect the wildlife, ensuring a more effective separation from urban development.
On the Bangladeshi side, inside the protected area of the Sundarbans, a similar situation is observed. There are human density hotspots within the reserve, marked by the blue pixels, alongside tiger sightings indicated by the dotted squares. The presence of urban development within a protected reserve is concerning, as it creates disconnection between core wildlife areas. This disconnection within the protected zone increases the likelihood of human-wildlife conflict, as it limits the movement of species like tigers and forces them into closer proximity with human settlements. Such fragmentation disrupts natural wildlife corridors, making it harder for animals to find safe passage, which heightens the risk of encounters and conflict.
The transformation of natural landscapes due to human activities—creates a layered result of environmental change. These processes reflect the complex interplay between human development and the natural world, demanding careful consideration in urban planning.
It is crucial to consider the impact of urban development on wildlife habitats in urban planning. By accounting for the presence of protected areas, dense vegetation, and wildlife corridors, planners can help minimize human-wildlife conflict and preserve critical ecosystems. Thoughtful urban design that integrates green spaces and buffer zones around sensitive areas can ensure that both human populations and wildlife coexist more harmoniously, reducing disruption to biodiversity while fostering sustainable development.
REFERENCES
Atmos. (2022, March 7). The Tiger Widows of India conserving the mangrove forest where their husbands died. Atmos. https://atmos.earth/tiger-widows-india-sundarbans-mangroves-climate/
From nature in cities to the nature of cities. Nat Cities 1, 107 (2024). https://doi.org/10.1038/s44284-024-00033-9
Mandal, Mrinmay & Das Chatterjee, Nilanjana. (2019). Forest Core Demarcation Using Geospatial Techniques: A Habitat Management Approach in Panchet Forest Division, Bankura, West Bengal, India. 2. 1-8. 10.9734/ajgr/2019/v2i230080.
Neil Brenner and Christian Schmid, “Planetary urbanization,” in Matthew Gandy ed., Urban Constellations. Berlin: Jovis, 2012, 10-13.
The Sundarbans. (n.d.). UNESCO World Heritage Convention. https://whc.unesco.org/en/list/798/
Vlahov, D., Galea, S. Urbanization, urbanicity, and health. J Urban Health 79 (Suppl 1), S1–S12 (2002). https://doi.org/10.1093/jurban/79.suppl_1.S1

