Tracking Morphological Evolution Over Time Urbanization and Vegetation Change Analysis Using Satellite Data
Introduction
Satellite imagery provides a powerful view of Earth’s surface, but to the naked eye, changes like urban growth and vegetation loss are not always obvious over time.
Colors and features can look deceptively similar, making it difficult to accurately assess land cover changes without deeper processing.
In this project, we applied image segmentation techniques using two key indices:
- NDVI (Normalized Difference Vegetation Index) – to measure vegetation cover
- NDBI (Normalized Difference Built-up Index) – to detect built-up, urbanized areas
Both indices were derived from Landsat satellite images, revealing hidden patterns of urbanization and vegetation decline that raw satellite images alone cannot show.
Project Objectives
In this study, we:
- Analyzed environmental changes across Houston, Texas (our case study) from 1984 to 2023
- Extracted key metrics (KPIs) such as urban area growth and vegetation loss
- Visualized these changes interactively using layered maps in Folium
Through segmentation and visualization, we were able to uncover deeper insights into how urban expansion impacts natural landscapes over decades — enabling smarter approaches to urban planning and environmental stewardship.
From Raw Data to Urban Memory
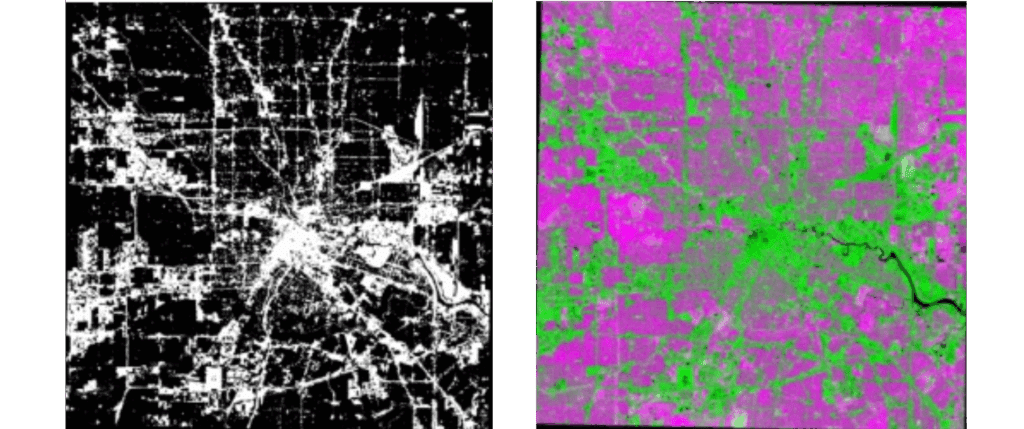
We began with a clean satellite image from 1984 – a snapshot of the city before segmentation, before analysis. Just data. Just Earth from above.
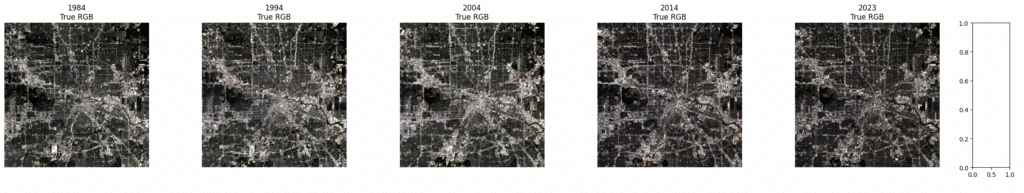
Raw satellite image – the starting point for our temporal exploration.
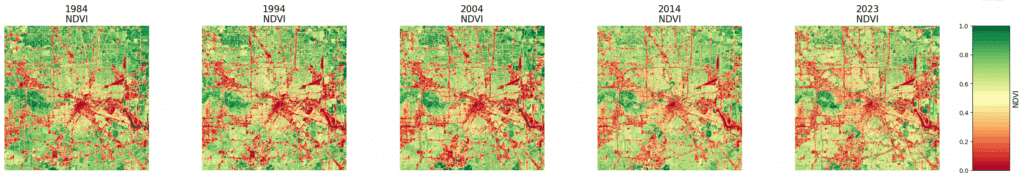
What is NDVI?
Stands for Normalized Difference Vegetation Index
● Tells you how “green” a pixel is—i.e. how much live vegetation it contains
How it’s made:
○ Satellites measure reflectance in two bands:
– Red (vegetation absorbs red light)
– Near-Infrared (vegetation strongly reflects NIR)
○ NDVI = (NIR − Red)/(NIR + Red)
– High NDVI (close to +1): dense, healthy vegetation (parks, forests)
– Low NDVI (near 0 or negative): non-vegetated surfaces (roads, buildings, water)
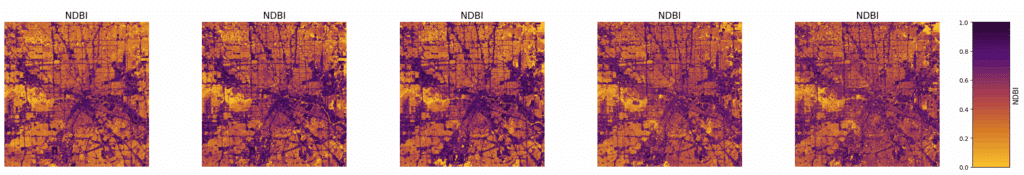
What is NDBI?
Stands for Normalized Difference Built-Up Index
● Tells you how “built-up” or urban a pixel is—i.e. how much concrete/asphalt it contains
How it’s made:
○ Uses two bands:
■ Short-Wave Infrared (SWIR) (built materials reflect more SWIR)
■ Near-Infrared (NIR) (built materials reflect less NIR than vegetation)
○ NDBI = (SWIR − NIR)/(SWIR + NIR)
■ High NDBI (positive): likely urban surfaces (roofs, roads)
■ Low or negative NDBI: natural surfaces (vegetation, water)
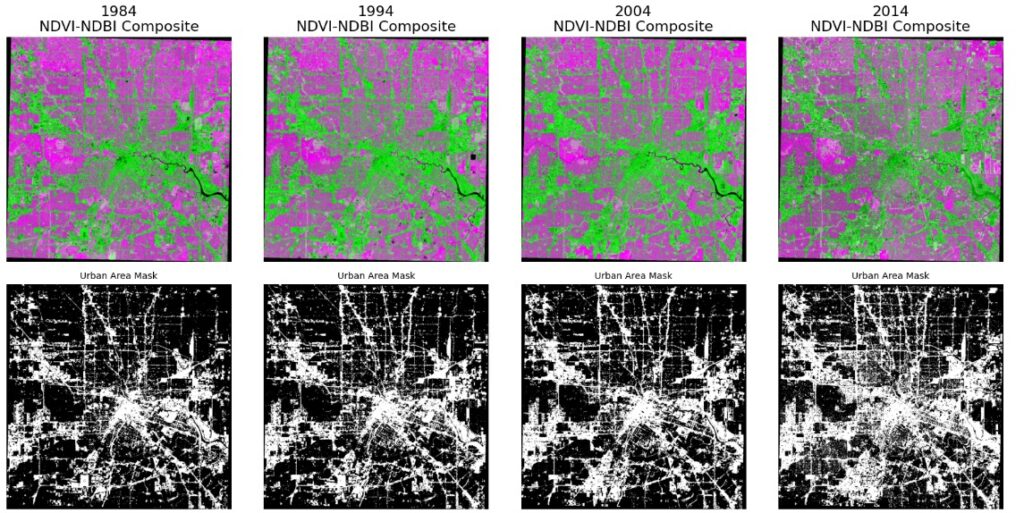
We processed images from four key years: 1984, 1994, 2004, and 2014. Using NDVI (vegetation) and NDBI (built-up index), we created composite visuals that illustrate environmental density and development patterns. We overlaid these with binary urban masks to isolate built-up regions
Why Combine NDVI + NDBI for Urban Segmentation?
Think of each pixel as a tiny land-cover “test.”
● If it’s green (high NDVI) → probably vegetation, not urban.
● If it’s built up (high NDBI) → probably concrete/asphalt, not vegetation.
By combining:
csharp
Urban pixel = (NDVI is low) AND (NDBI is high)
● Low NDVI filters out green and water.
● High NDBI picks out surfaces reflective in SWIR.
Together, they zero in on areas that aren’t vegetation or water but do look like built-up land.
NDVI-NDBI composites with extracted urban masks show the city’s morphological evolution.
What We Did
Location: Urban area selected by bounding box
Goal: Detect and visualize urban expansion across four decades
Methods:
– Satellite imagery extraction (Google Earth Engine)
– NDVI and NDBI computation
– Thresholding and segmentation (urban mask)
– Visual layer comparison
KPIs Extracted:
– Change in urban footprint (white areas in mask)
– Green index (NDVI) trends
– Spatial densification patterns
– Temporal thermal patterns (future implementation)
Results & Reflections
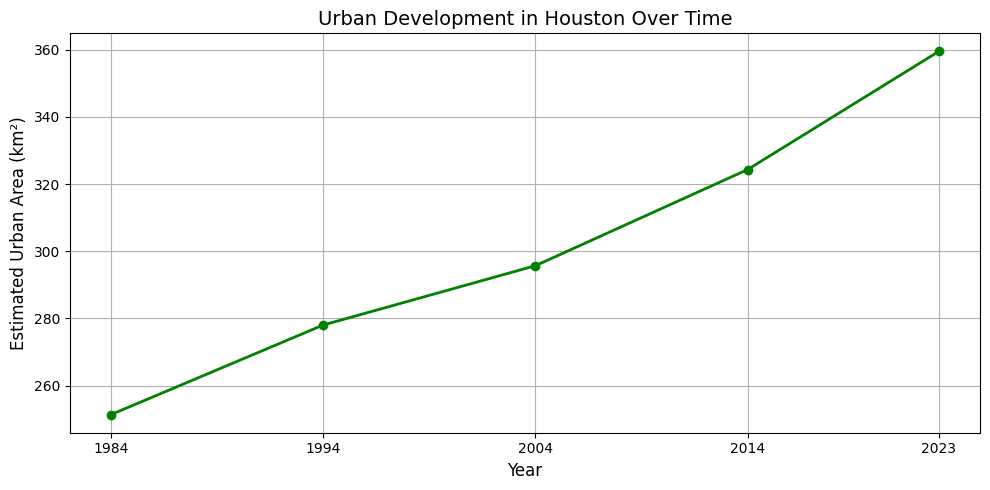
✅ Clear visualizations of urban growth from 1984 to 2014
✅ Morphological evidence of densification, especially in the core
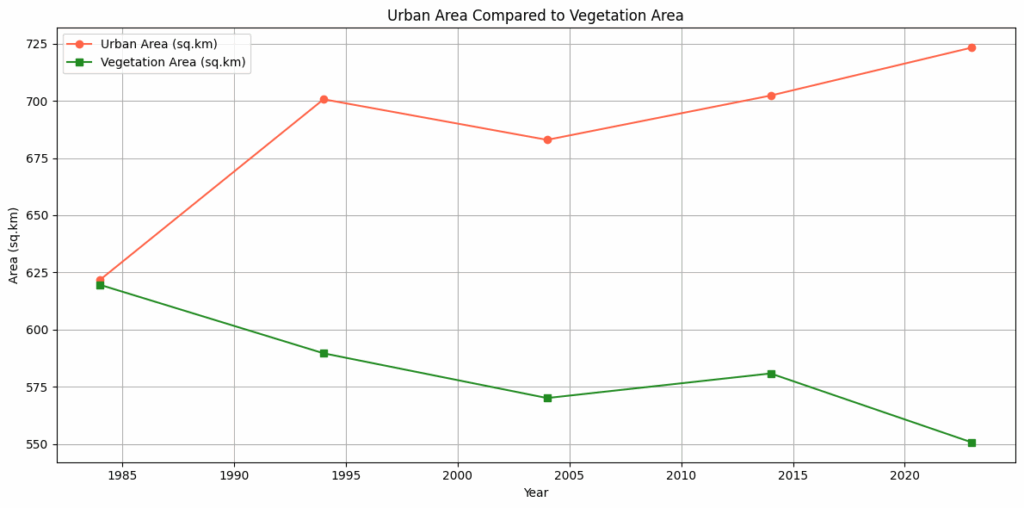
✅ Detected reduction in vegetated areas (green-to-gray shift)
✅ Simple masks proved powerful for storytelling
KPI’s Calculation
To quantify the environmental and urban transformations in Houston from 1984 to 2023, we extracted Key Performance Indicators (KPIs) using remote sensing indices and binary segmentation masks.
Here’s how we did it:
Visualization:
These values were plotted as bar charts and interactive maps,
Urban Area Coverage (%):
We applied a threshold to the NDBI (Normalized Difference Built-up Index) and created binary urban masks for 1984 and 2023.
By calculating the proportion of pixels classified as “urban” in each image, we measured the percentage increase in built-up land over nearly four decades.
Vegetation Cover (%):
Similarly, we calculated NDVI (Normalized Difference Vegetation Index) for both years.
A threshold (e.g., NDVI > 0.2) was used to detect areas with healthy vegetation.
This allowed us to estimate the green space lost due to urbanization.
Change Detection Map:
By overlaying the masks from both years, we generated a spatial map of land cover transition — showing where buildings replaced vegetation or open land.
Visualization:
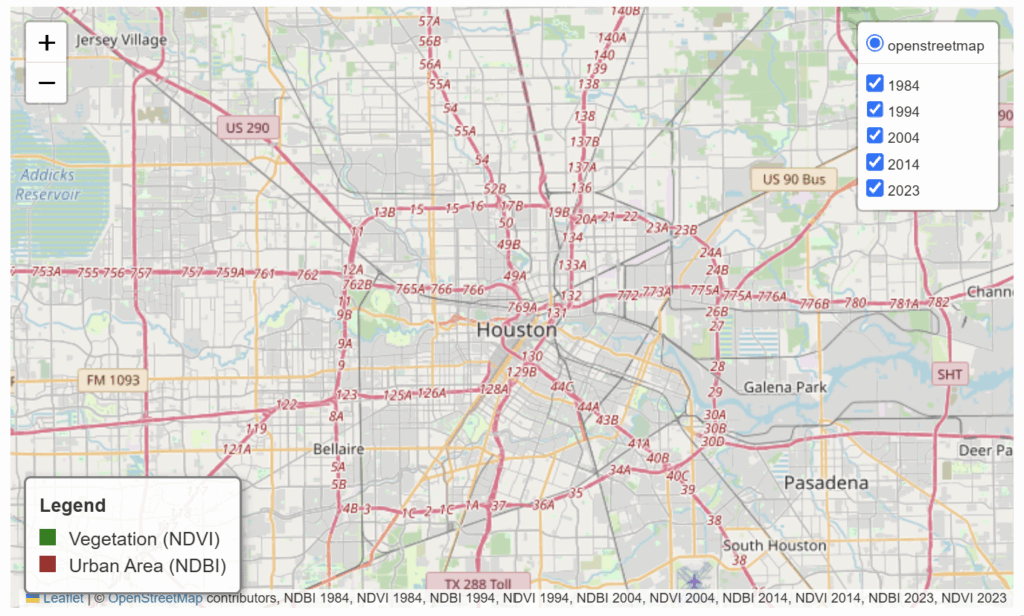
Folium Map Creation
To better visualize spatial changes over time, we used the Folium library to create interactive web maps of the selected urban area (Houston, TX).
These maps allow users to explore satellite imagery, segmentation masks, and spatial overlays in a dynamic, intuitive way.
Here’s what we did:
- Map Initialization:
We initialized a Folium map centered on Houston, with a zoom level and coordinate bounds (bounding box) tailored to our area of interest. - Bounding Box Display:
Usingfolium.Rectangle, we added a visible red border around the analyzed region to highlight the exact zone used for segmentation and index calculations. - Overlay of Satellite Tiles:
We displayed the raw satellite images directly on the map withfolium.raster_layers.ImageOverlay, allowing users to interactively view 1984 vs. 2023 imagery. - Layer Control for Interactivity:
The map includes toggleable layers for each image and analysis step (e.g. original Landsat, NDVI mask, NDBI mask), giving users the ability to compare data layers side by side. - User Navigation:
Standard Folium controls (zoom, pan, reset) make it possible to explore spatial features in detail without needing GIS software.