
AI Reveals Hidden Patterns in Crowdsourced Fears
The Problem
According to the International Survey on Sexual Harassment in Public Spaces (L’Oréal Paris & Ipsos, 2023), 92% of young women in Spain have experienced street harassment. The same research states that this number is 80% globally.
And yet, as Gardner puts it in Passing By: Gender and Public Harassment, “everyday harassment against women is largely absent from official crime statistics.” Why? Research points to chronic underreporting and limitations in legal recognition as the cause.
So the question driving this thesis is: if we assume underreporting is permanent, how can AI change the equation? Can AI take anonymized individual experiences and transform them into a repeatable, transferable framework — something that doesn’t depend on official crime reports to describe where danger actually is?
State of the Art
ML research. There have been several projects mapping emotion and safety onto urban space. Place Pulse (MIT, 2013) used crowdsourced Street View image comparisons and computer vision to quantify perceived safety and other urban qualities at scale — later extended by Cui et al. (2023) on gender differences in perceived safety, Chen, Lin, Yao & Zhou (2024) on women-only safety ratings, and Zhu et al. (2024), who combined Street View imagery with socio-economic data and ridge regression to explain the gender safety gap spatially.
DUNES (IAAC, 2019/20) is another notable project: it mined sentiment from Google Reviews and a visual preference survey to feed a regression-based safety gradient — though safety is treated as one emotion among several, drawn from one data source at a time. Mappiness (2010–13, MacKerron & Mourato) pinged smartphone users about momentary happiness, but relied on self-report only, with no built-environment data attached.
The gap: none of these combine a gender-specific, time-sensitive lens with ML in one framework.
What Makes a Space Feel Hostile?
Drawing on the 2024 ScienceDirect narrative review “Women’s perceived safety in public places and public transport: a narrative review of contributing factors and measurement methods,” and on Crime Prevention Through Environmental Design (CPTED) — a framework for shaping the built environment to reduce opportunistic crime and the perception of crime — the recurring risk factors are: poor lighting, lack of surveillance, low pedestrian flow, prior crime reports, proximity to public transit, and isolated streets, with risk concentrated particularly at night.
Case Study: Melbourne
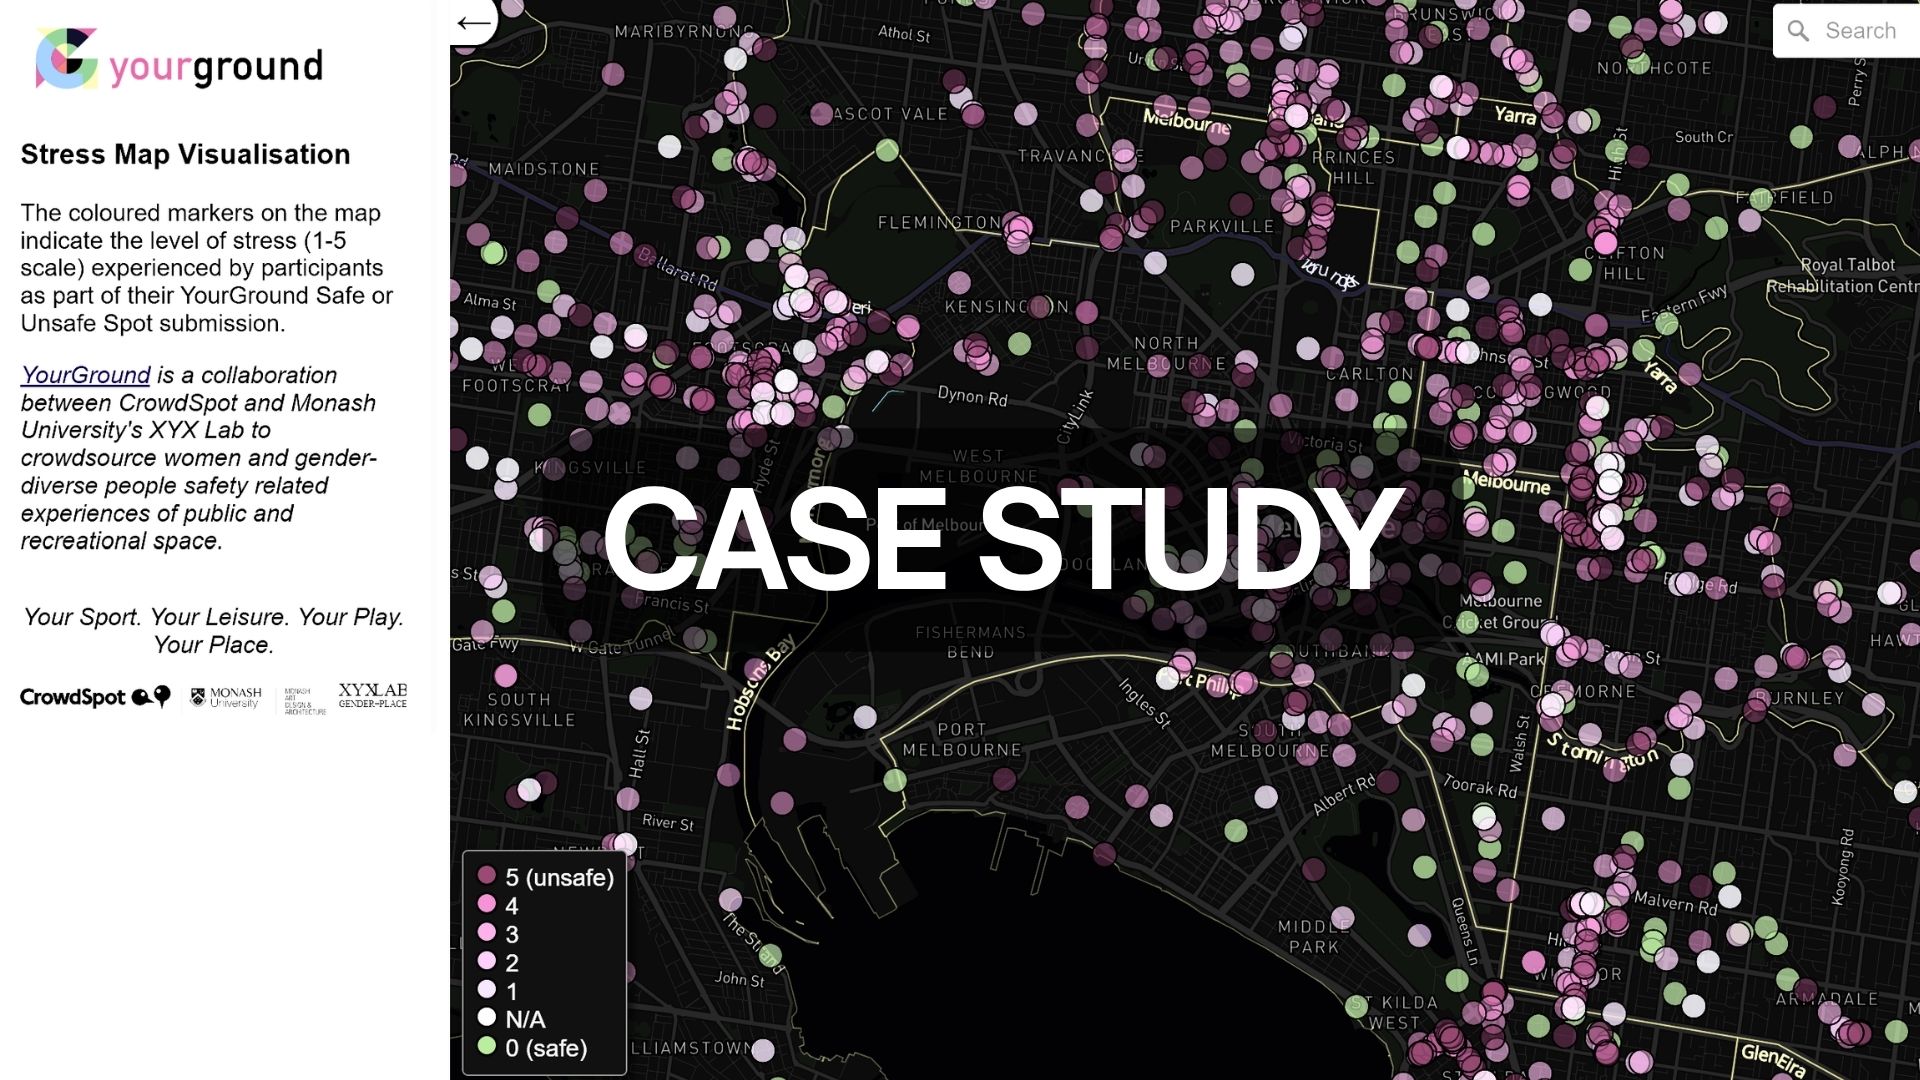
The case study uses data from “Your Ground,” a crowdsourcing tool that specifically asked women and gender-diverse people in Melbourne to mark locations where they felt safe or unsafe.
PREPROCESSING
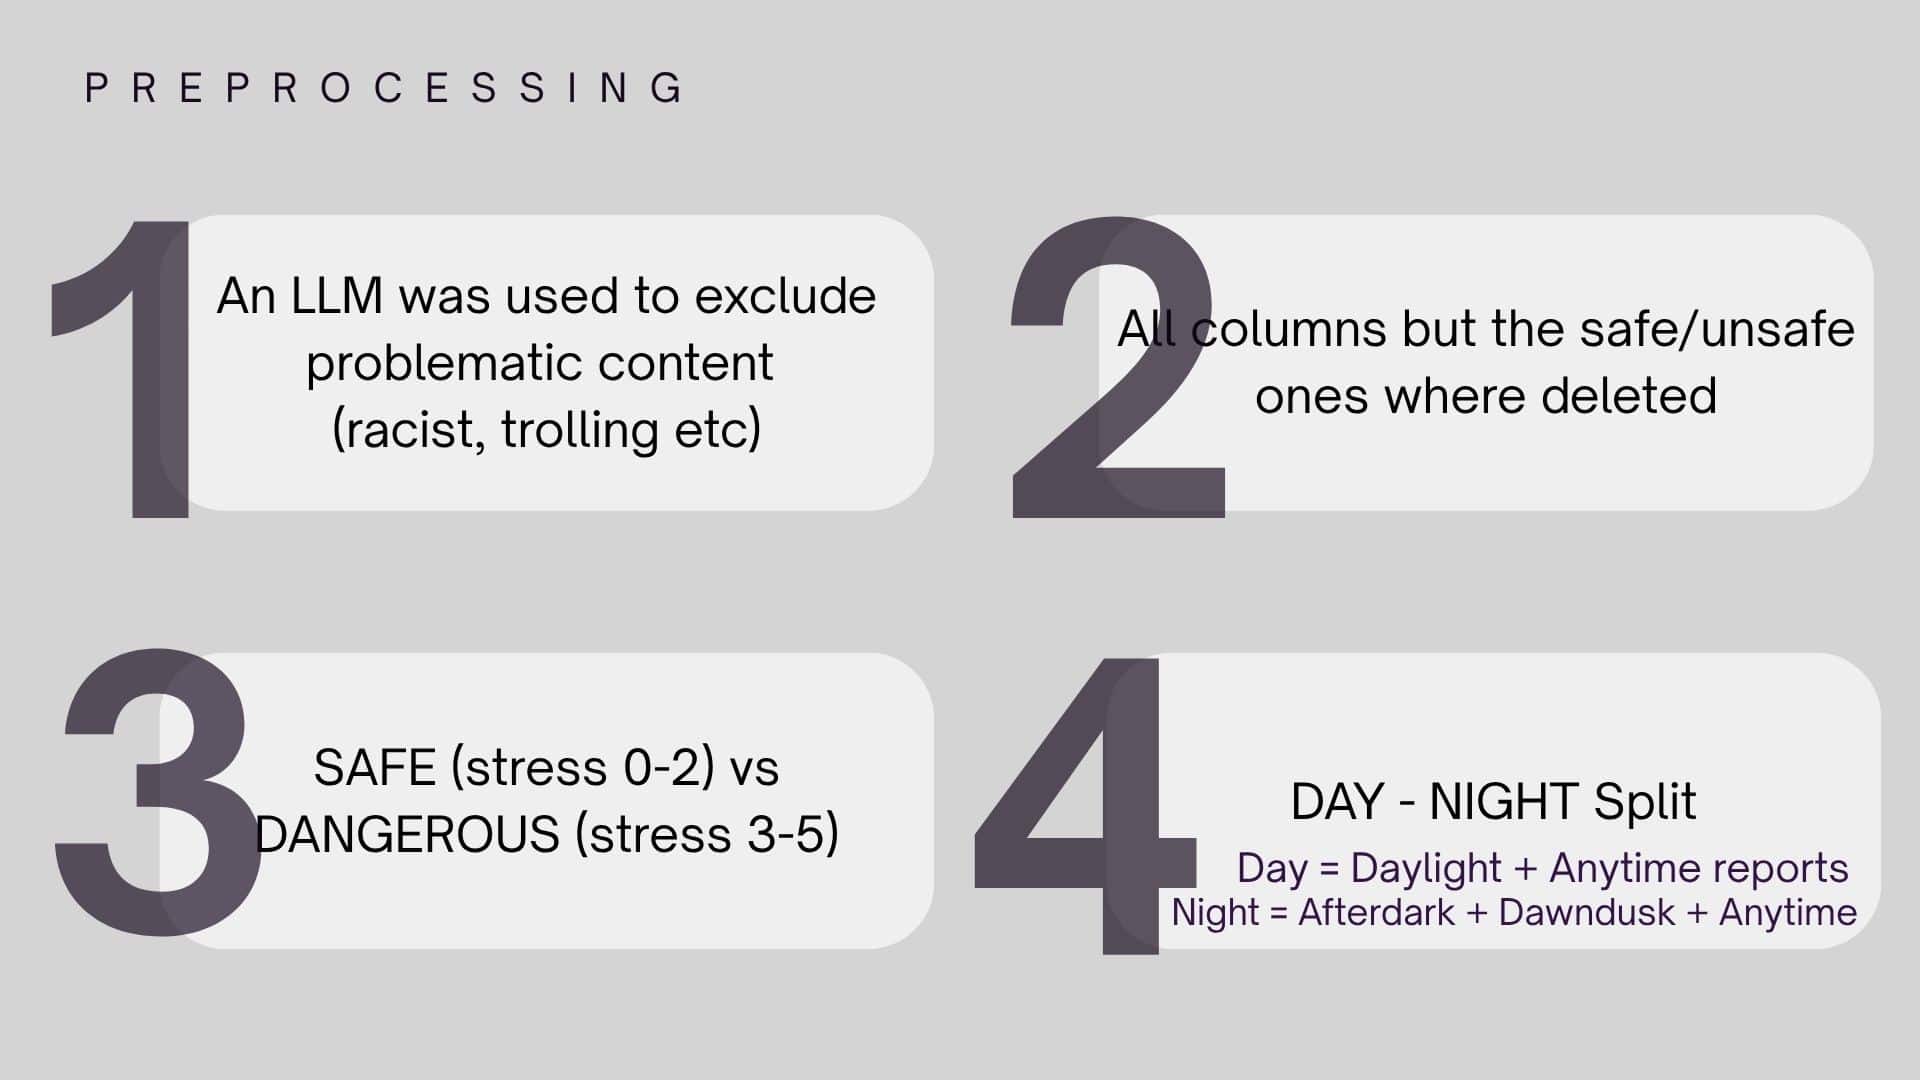
Starting from the raw reports, all columns except the safe/unsafe indicators were dropped. An LLM was used to filter out problematic content (racist remarks, trolling, etc.). Each report’s stress level was binarized: SAFE (stress 0–2) vs. DANGEROUS (stress 3–5) — using a binary label rather than the full stress scale, in order to retain enough data to train the model.
Reports were then split into day and night: Day = Daylight + Anytime reports; Night = Afterdark + Dawn/Dusk + Anytime reports. A small number of Dawn/Dusk reports were folded into Night, since operationally that’s the closer match in the city. Anytime reports were duplicated and assigned to both buckets. This split mattered: an earlier attempt to model day and night together let night-time danger dominate every prediction.
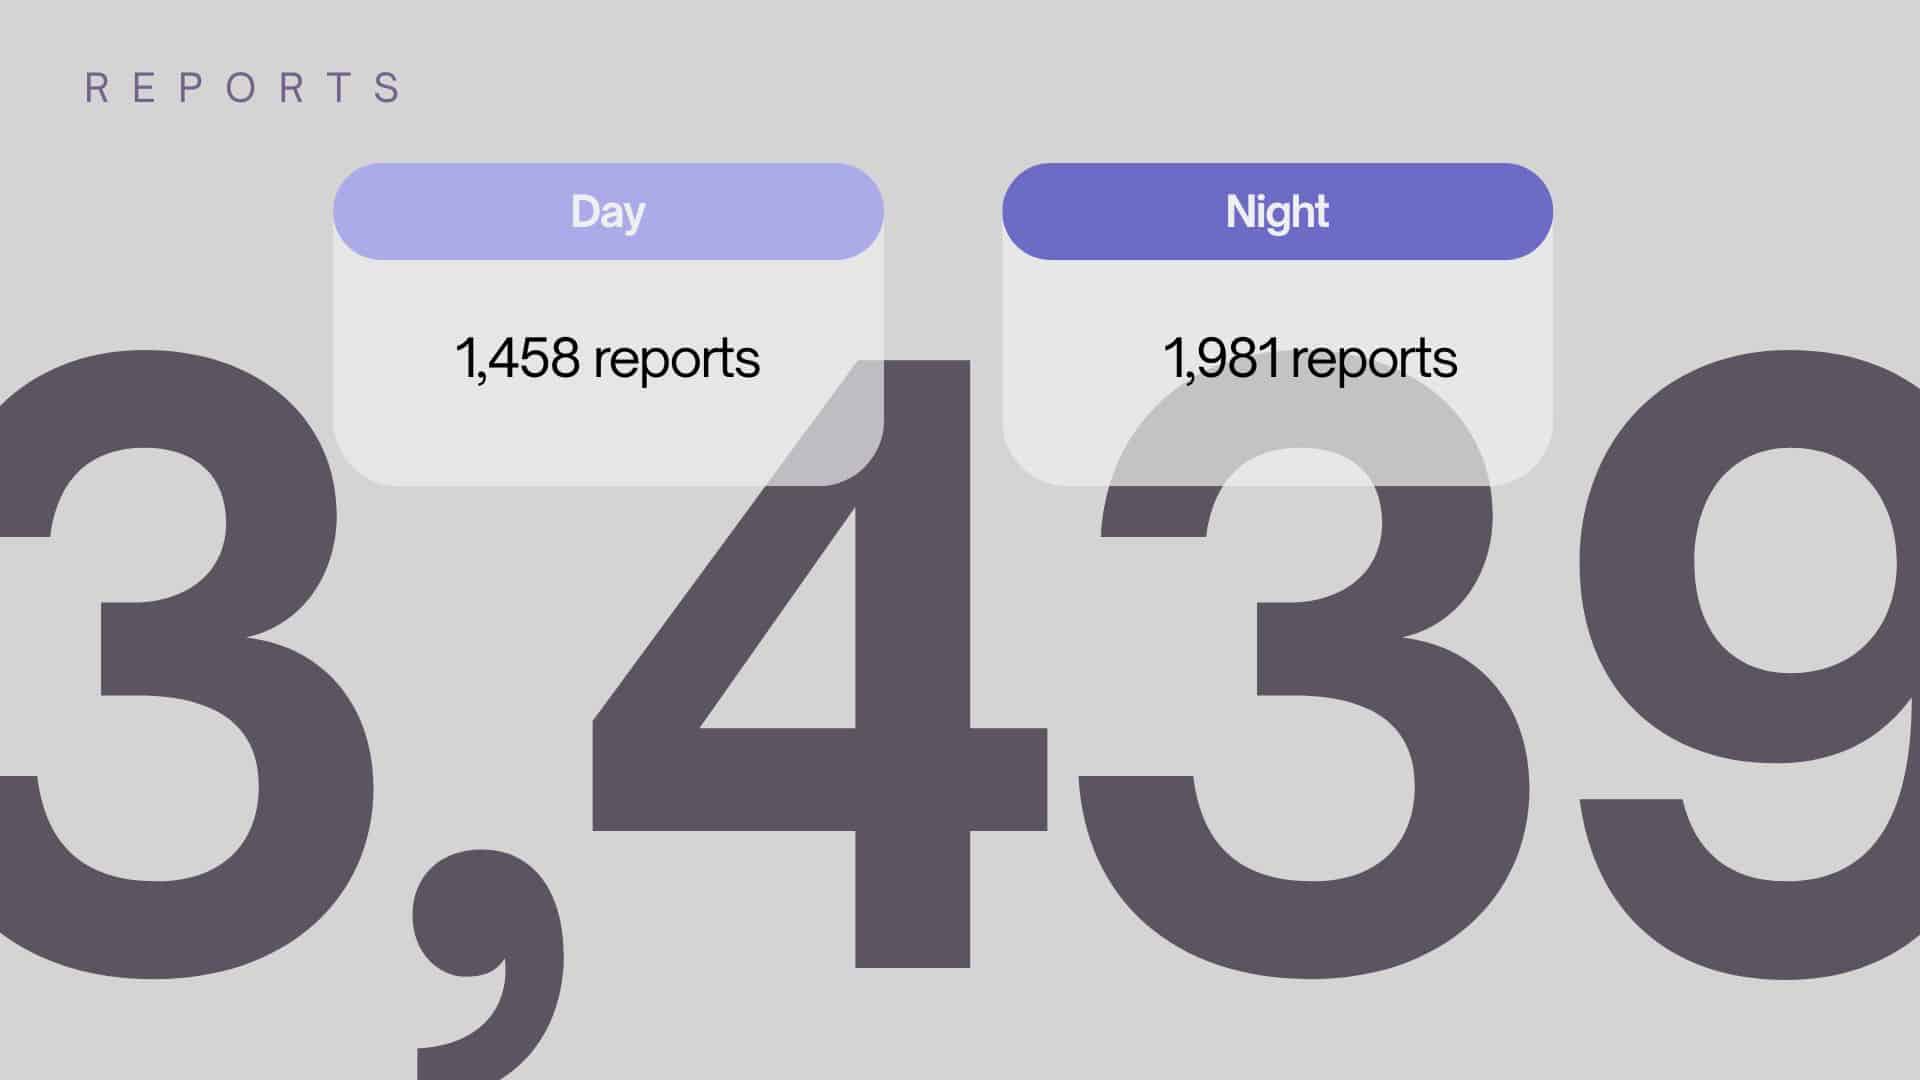
The result: 3,439 total reports — 1,458 for Day, 1,981 for Night.
Data sources
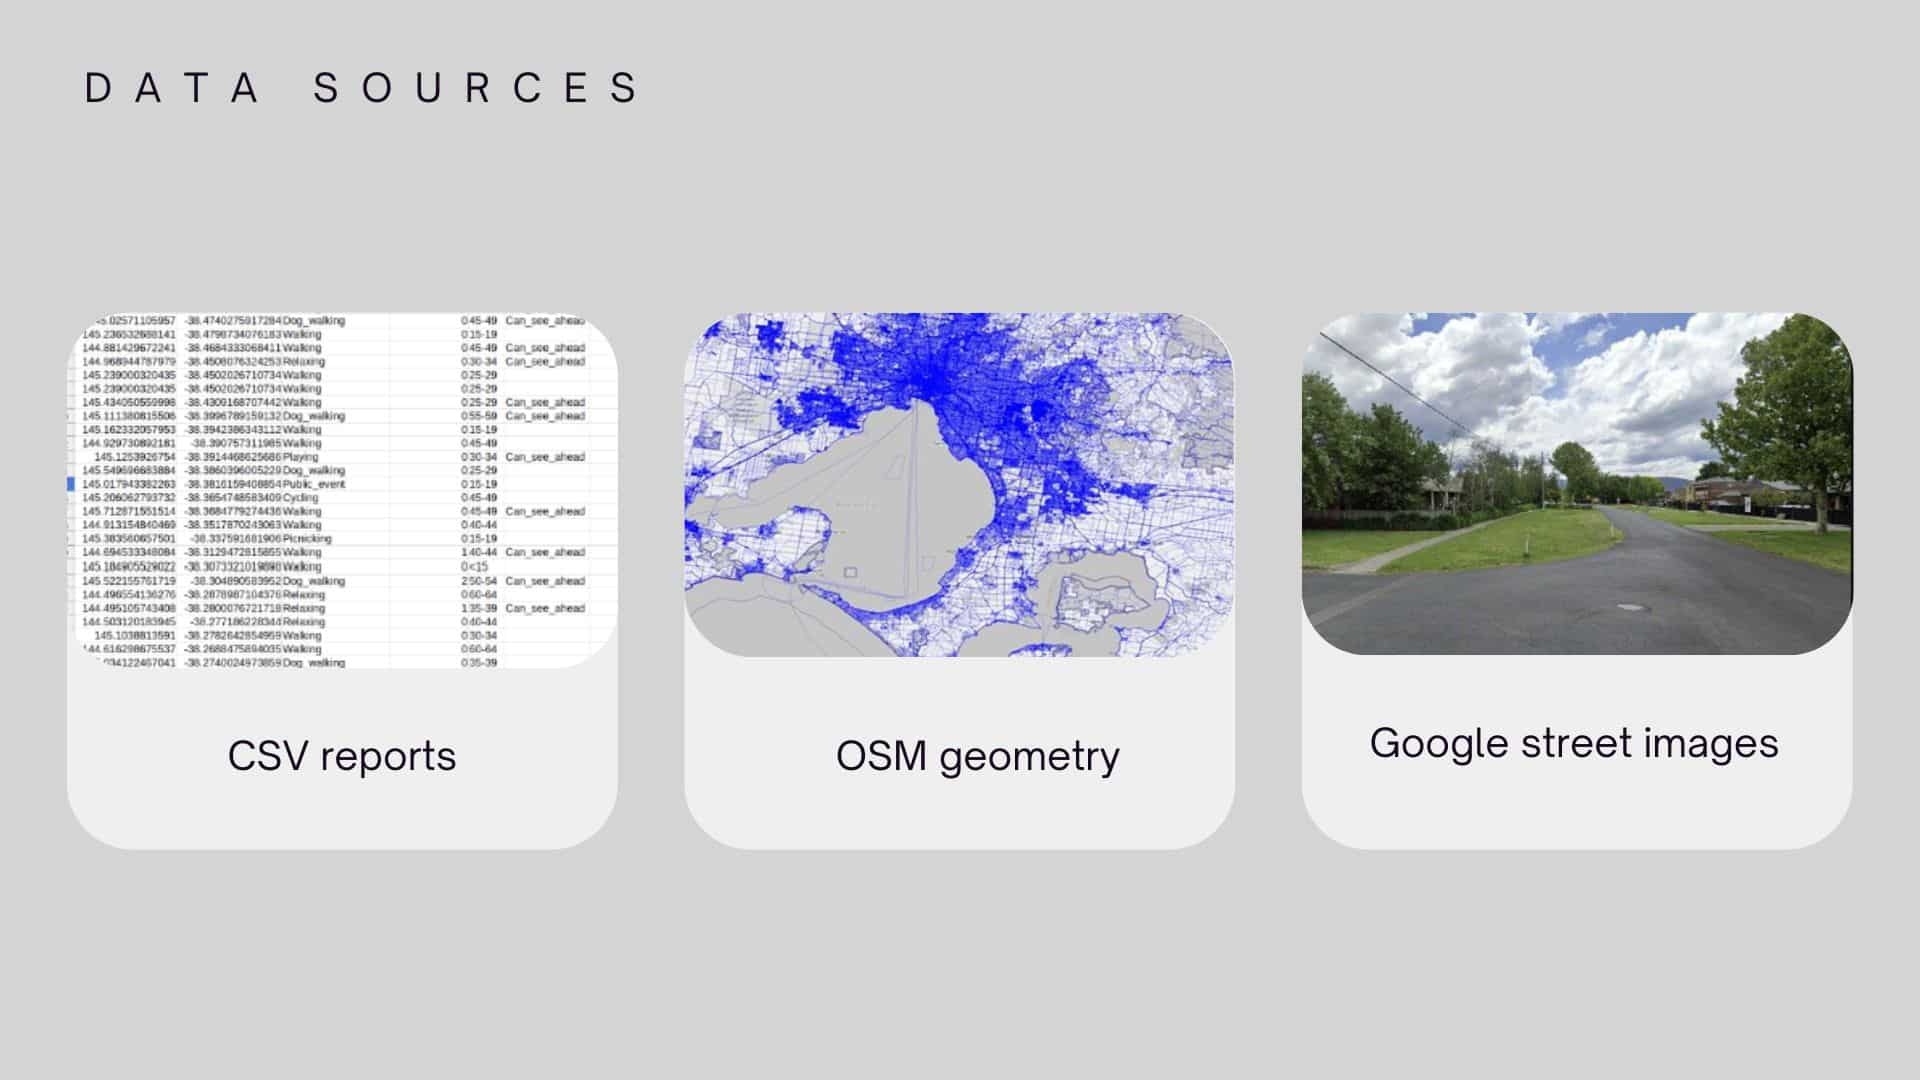
Three were combined: the CSV of crowdsourced reports, Google Street View images, and OSM (OpenStreetMap) geometry.
Theoretical framing

Features
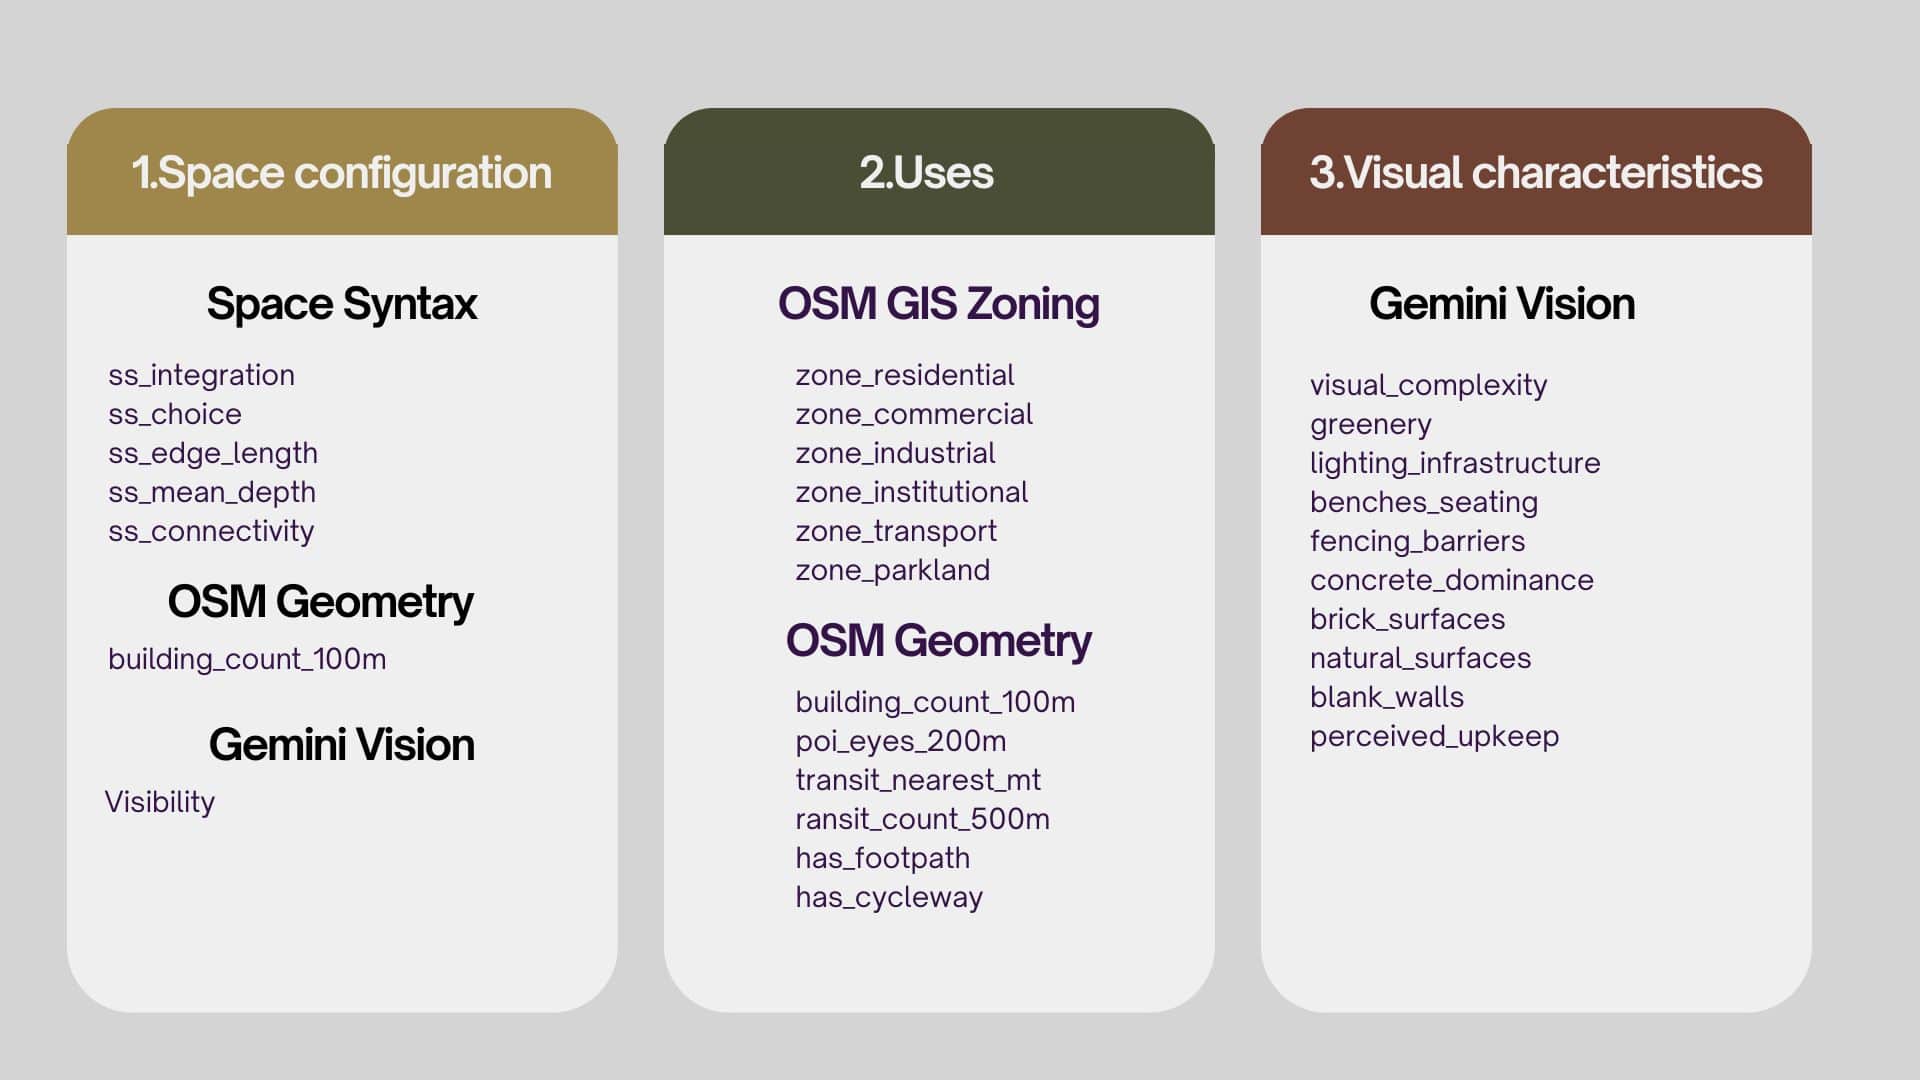
Feature selection was grounded in current feminist literature and research in this domain, organized into three categories.
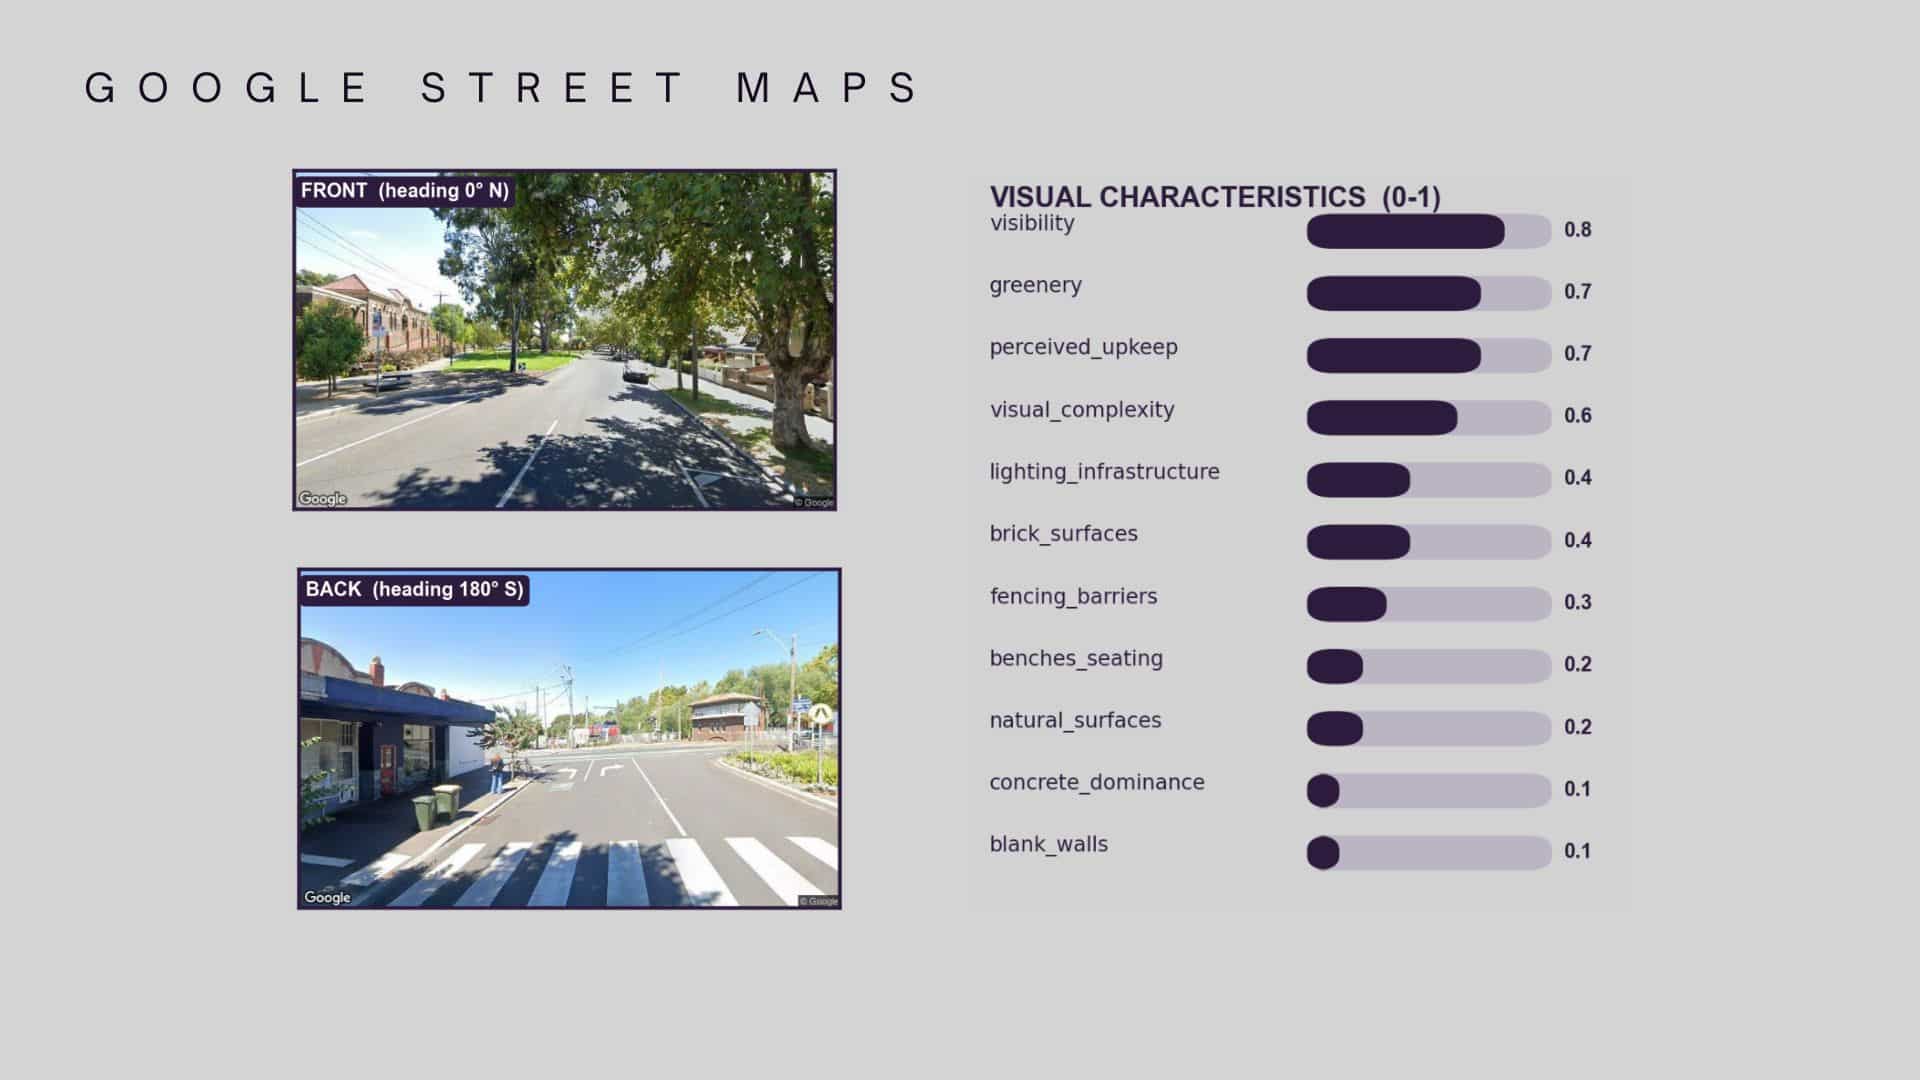
For Street View capture, two images were taken at each point , one facing forward, one facing backward, along the direction of the street , and Gemini Vision scored the visual labels from those images.
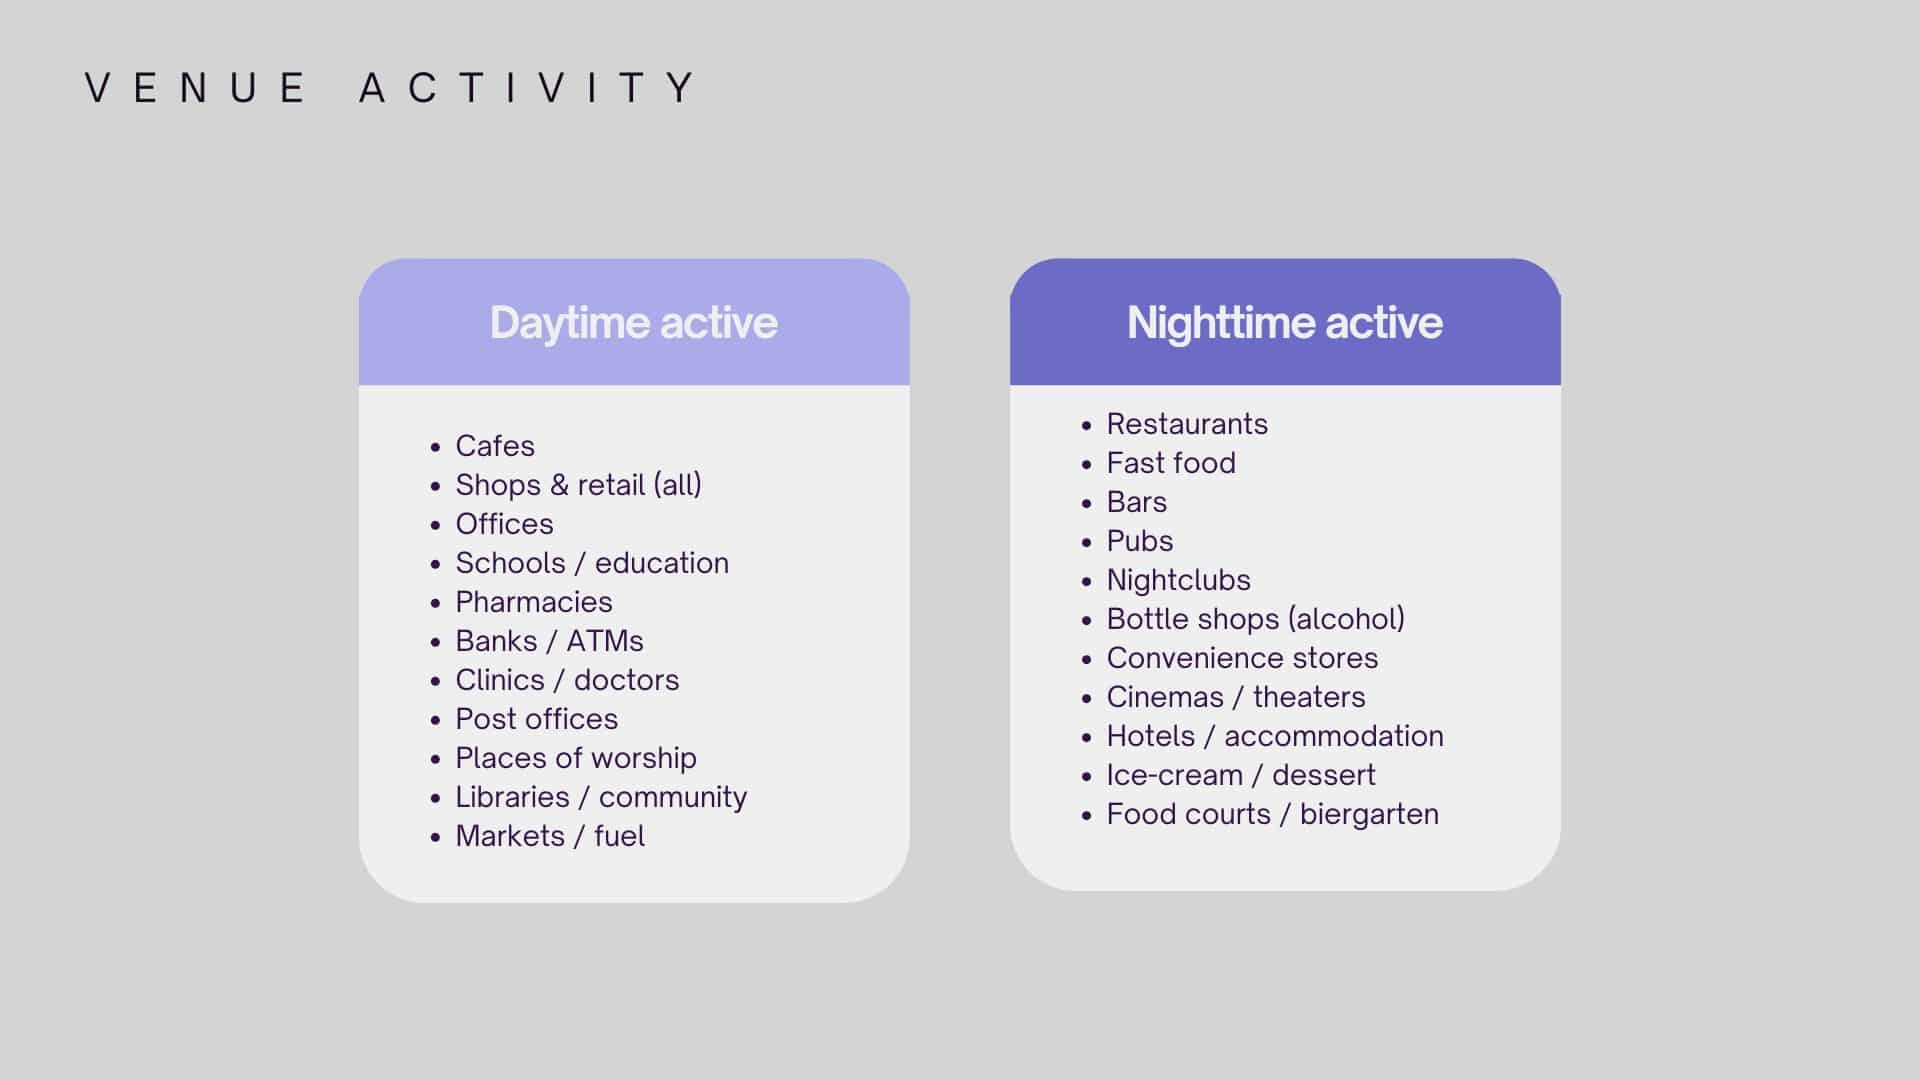
One practical wrinkle: the “eyes on the street” feature needed venue activity hours, but venues didn’t have reliable opening-hours data. So venues were assigned to day-active or night-active categories instead , e.g., cafés, shops, offices, schools, pharmacies, and banks for daytime; restaurants, bars, nightclubs, bottle shops, and cinemas for nighttime, and assumed active accordingly.
Modeling
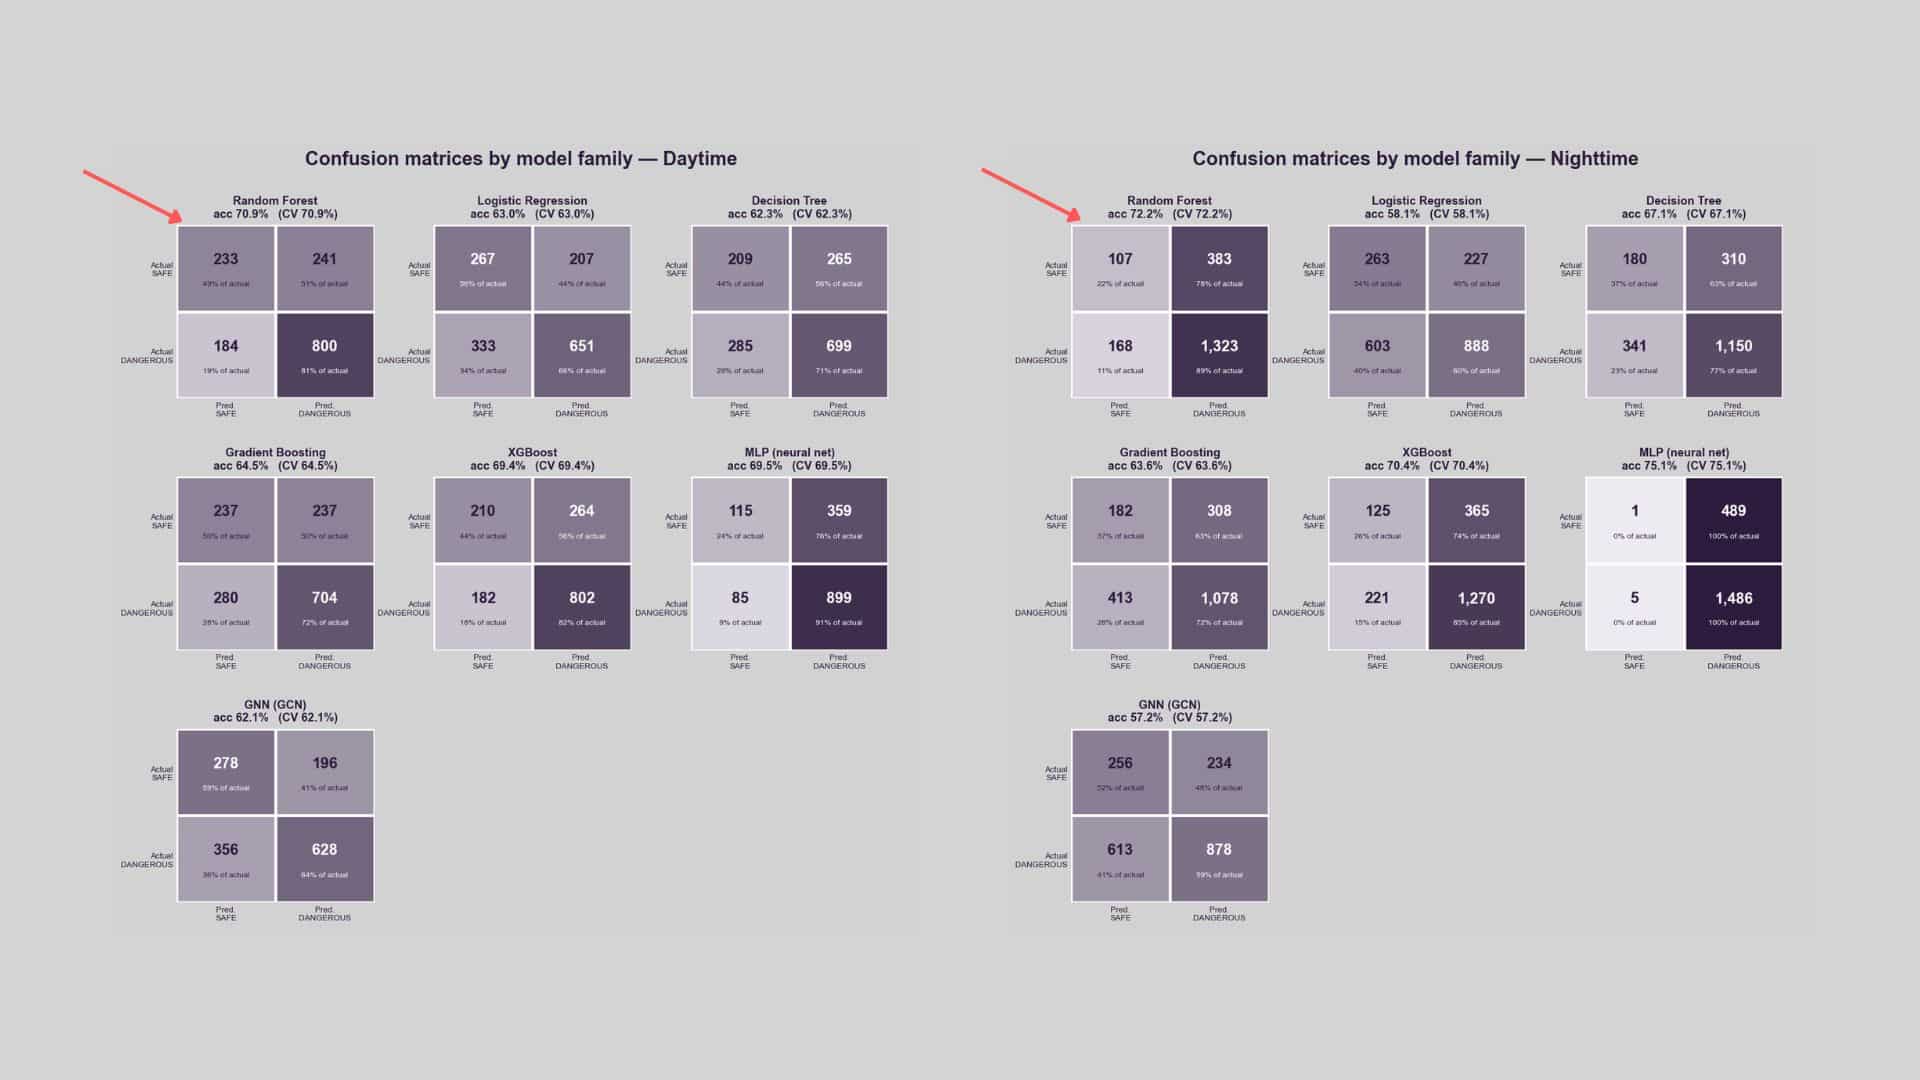
A hyperparameter grid search was used to select the model. Random Forest performed best in both the day and night conditions. All models tended to tilt toward predicting danger, likely because danger reports outnumbered safety reports (964 safety vs. 2,475 danger). Deep learning models performed worst of the set tested.
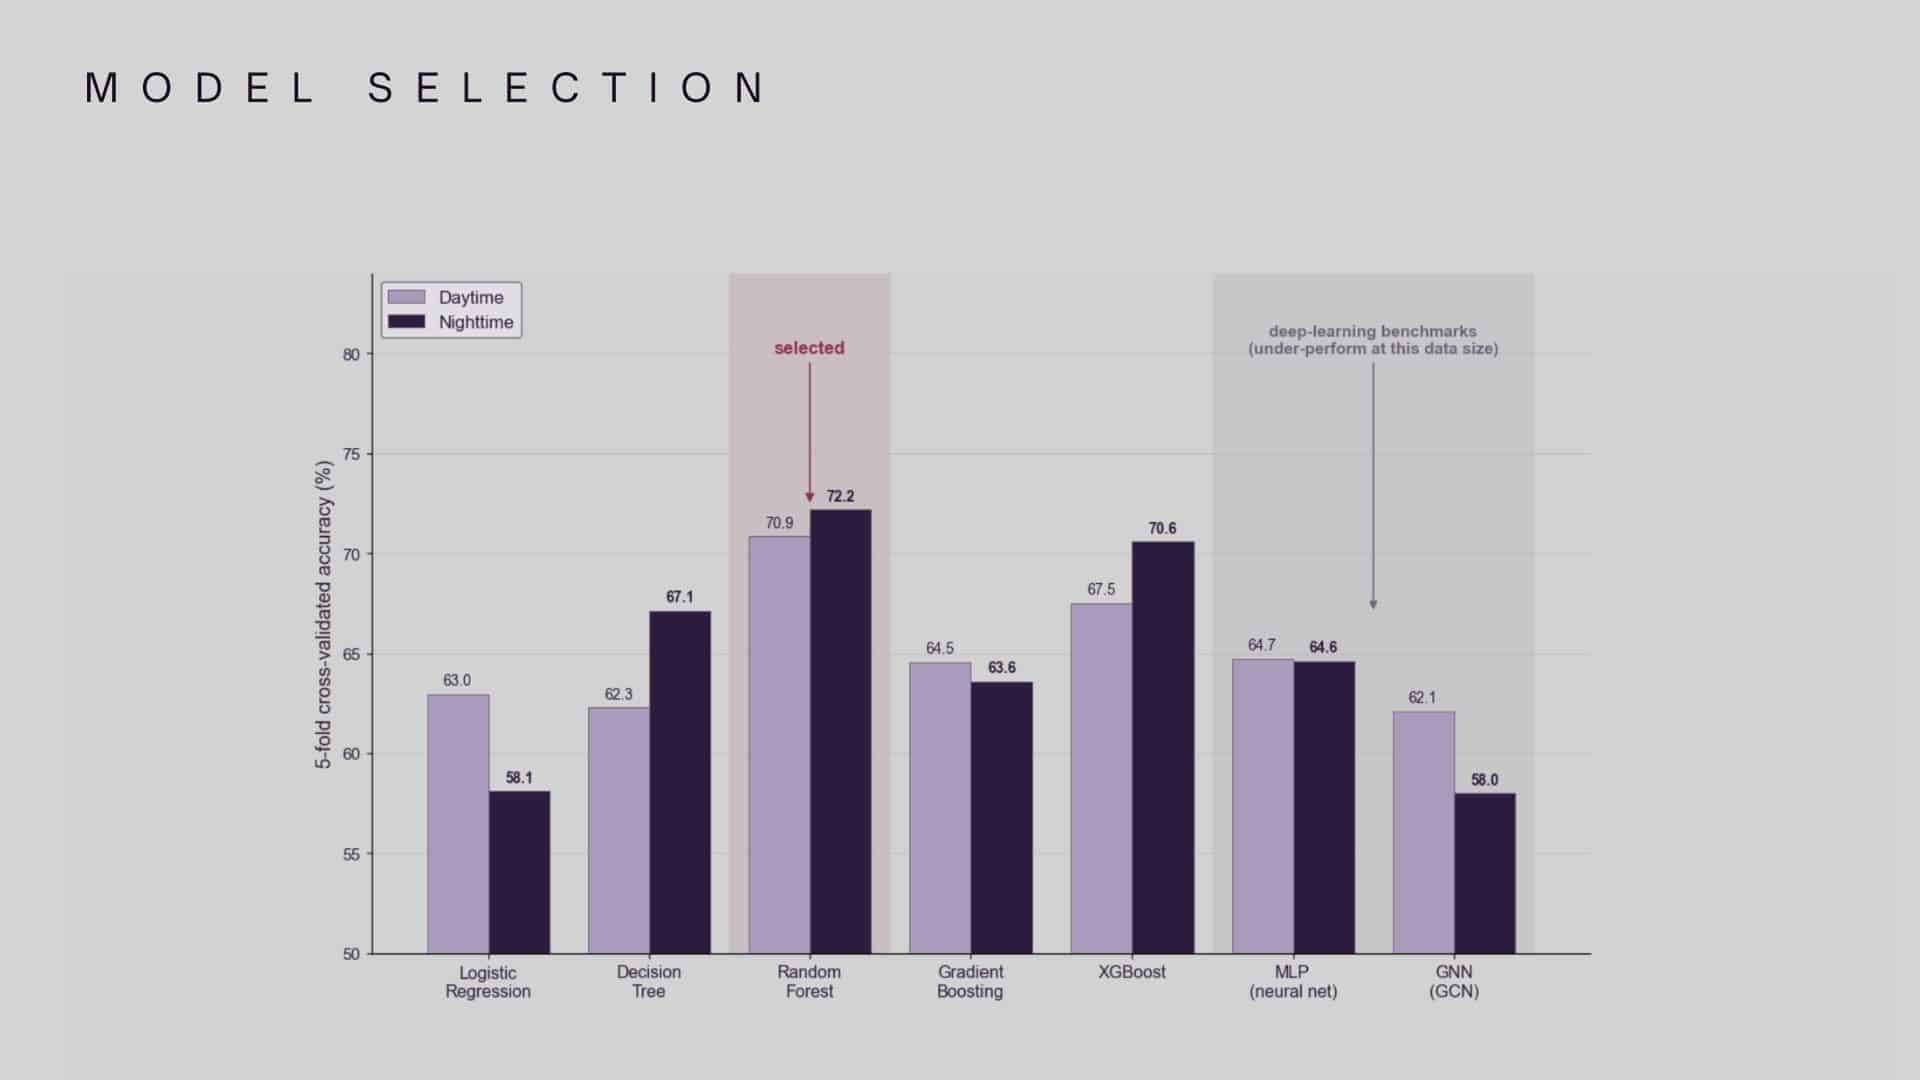
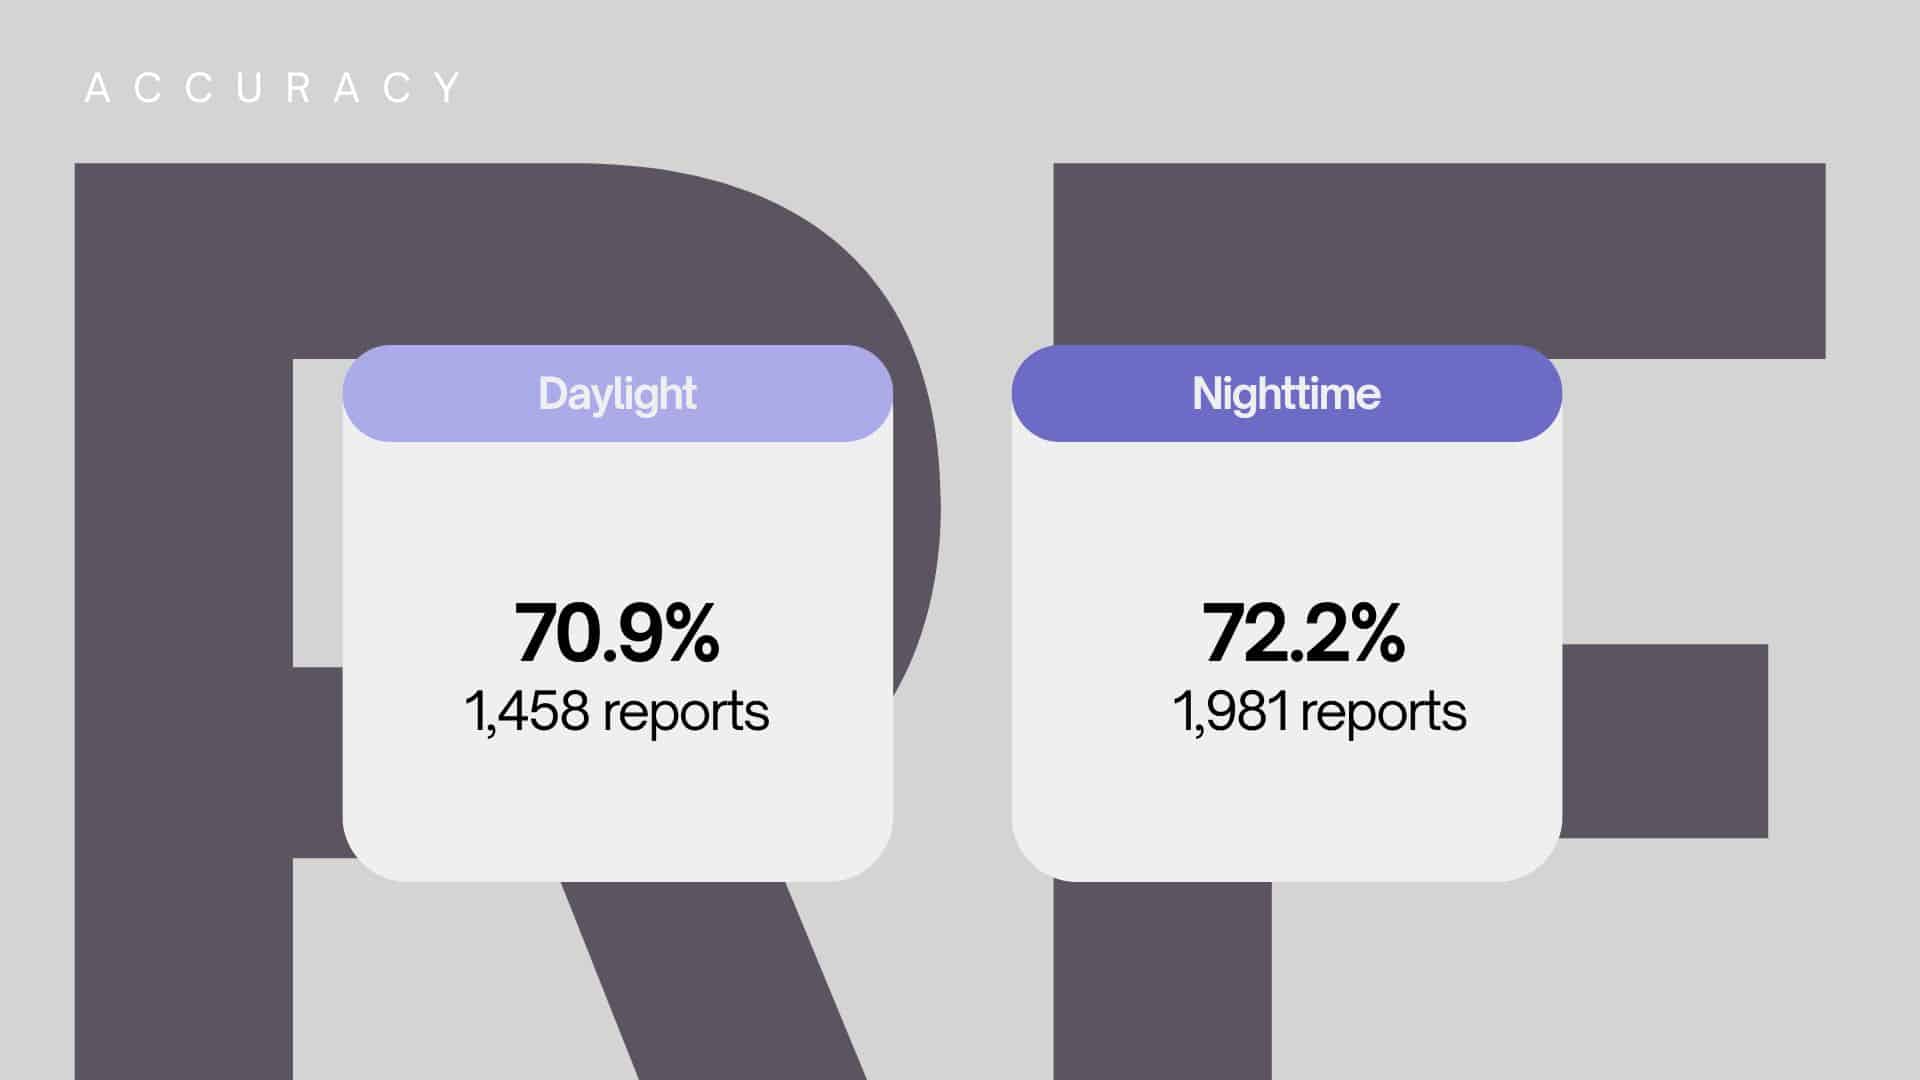
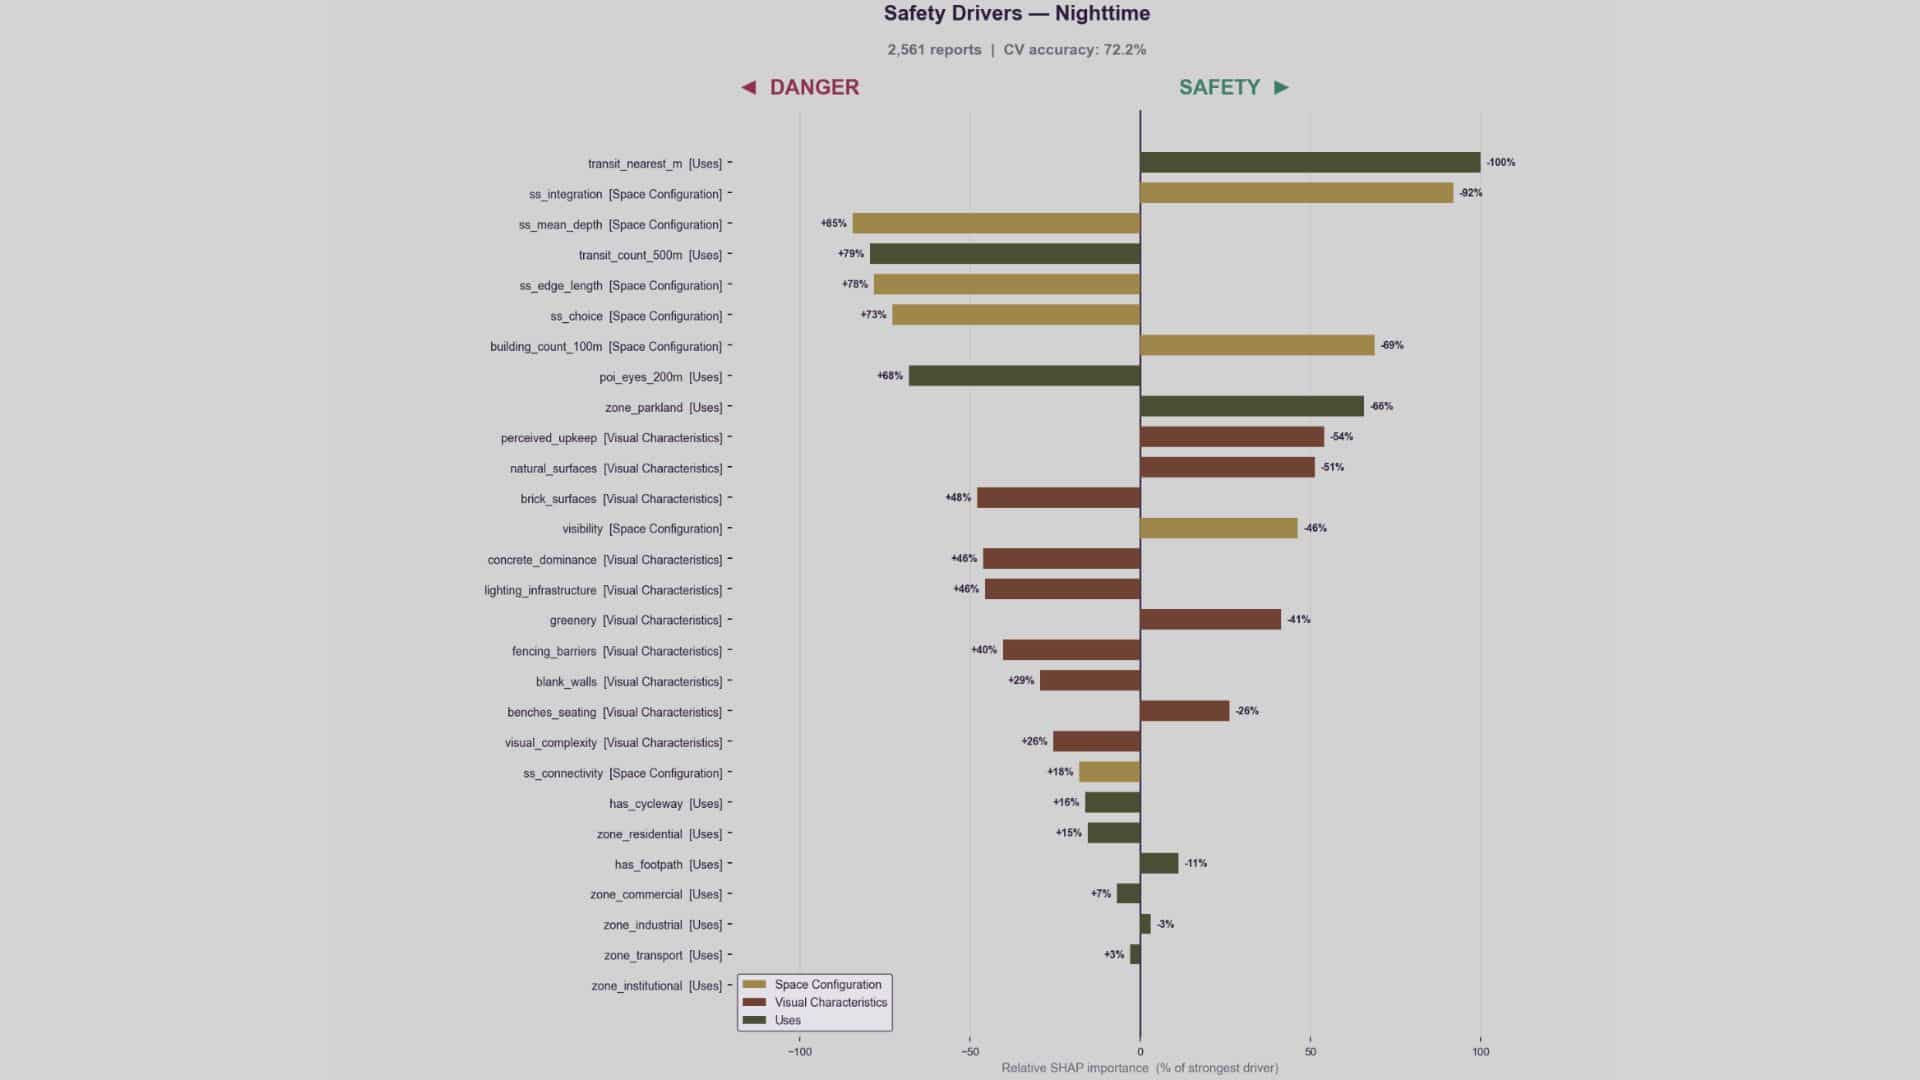
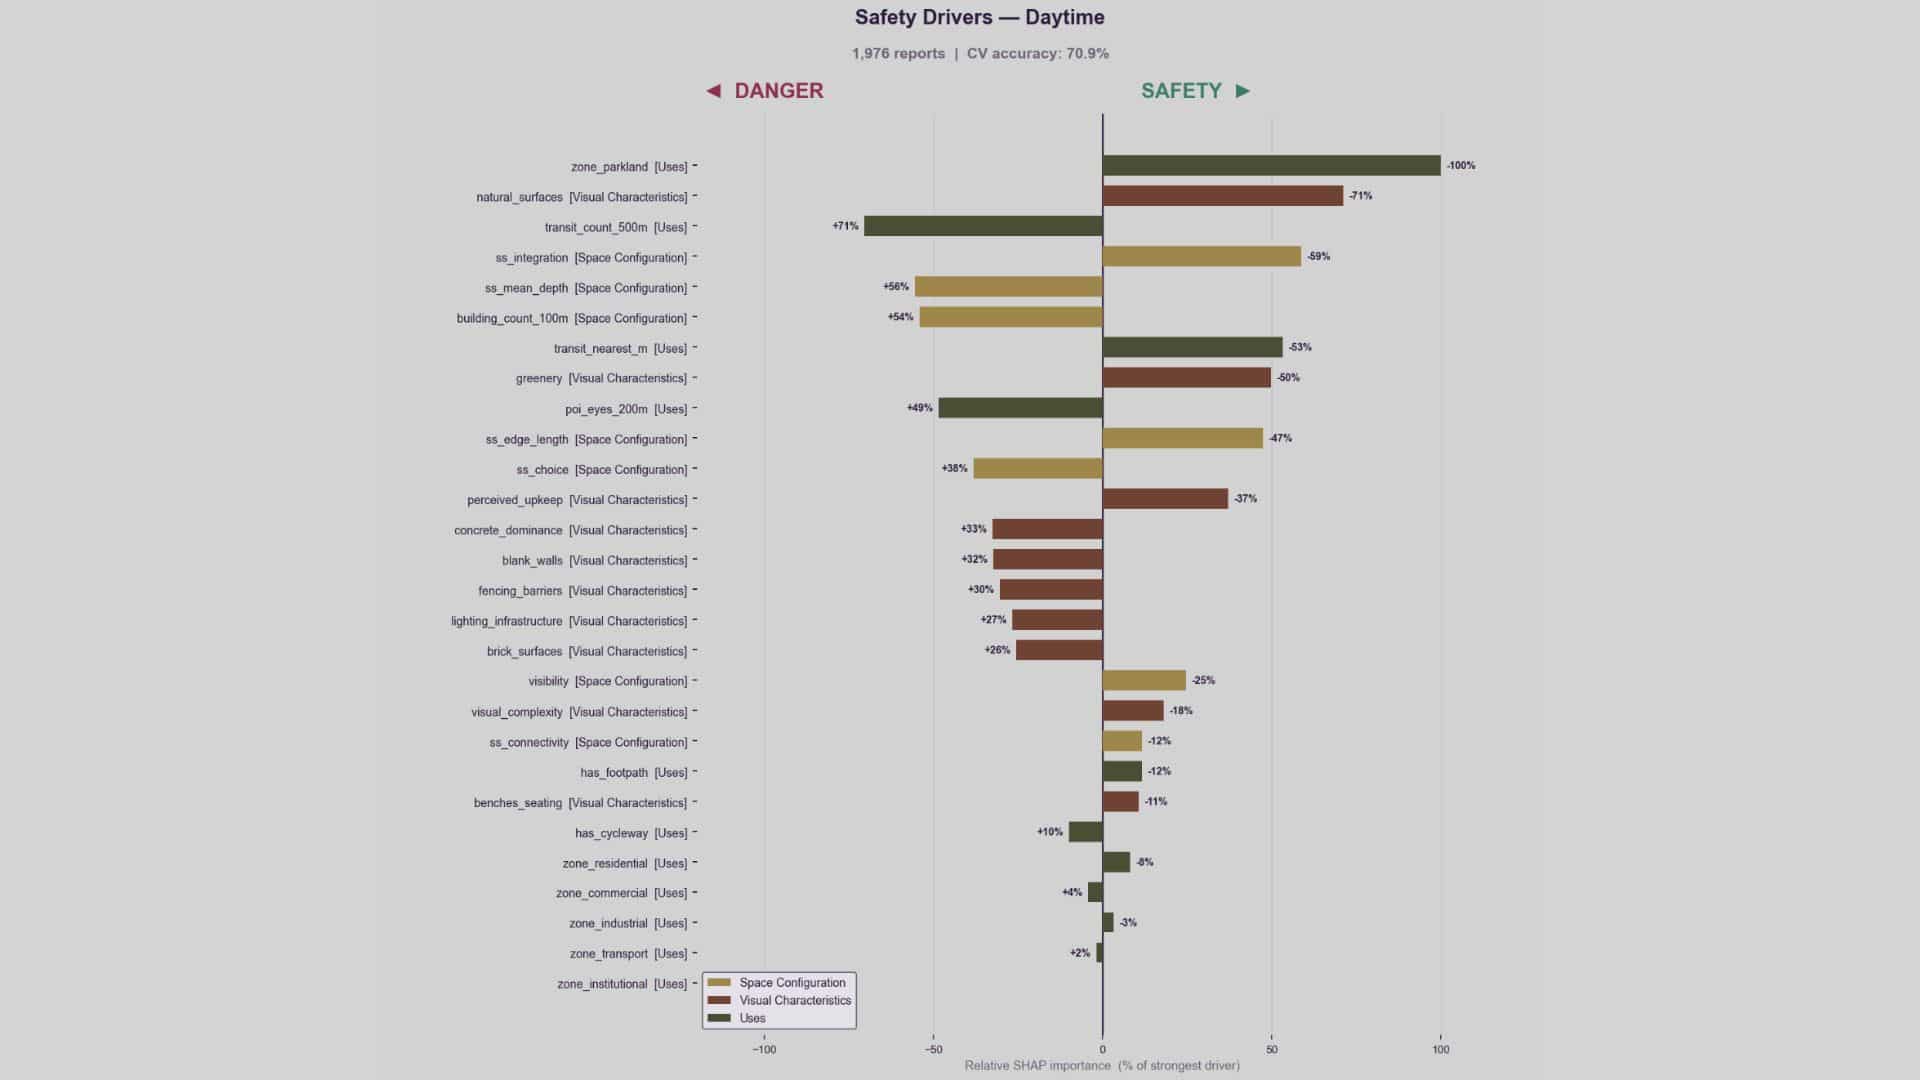
Final accuracy: 70.9% (Daylight), 72.2% (Nighttime), trained on 1,458 day reports and 1,981 night reports respectively.
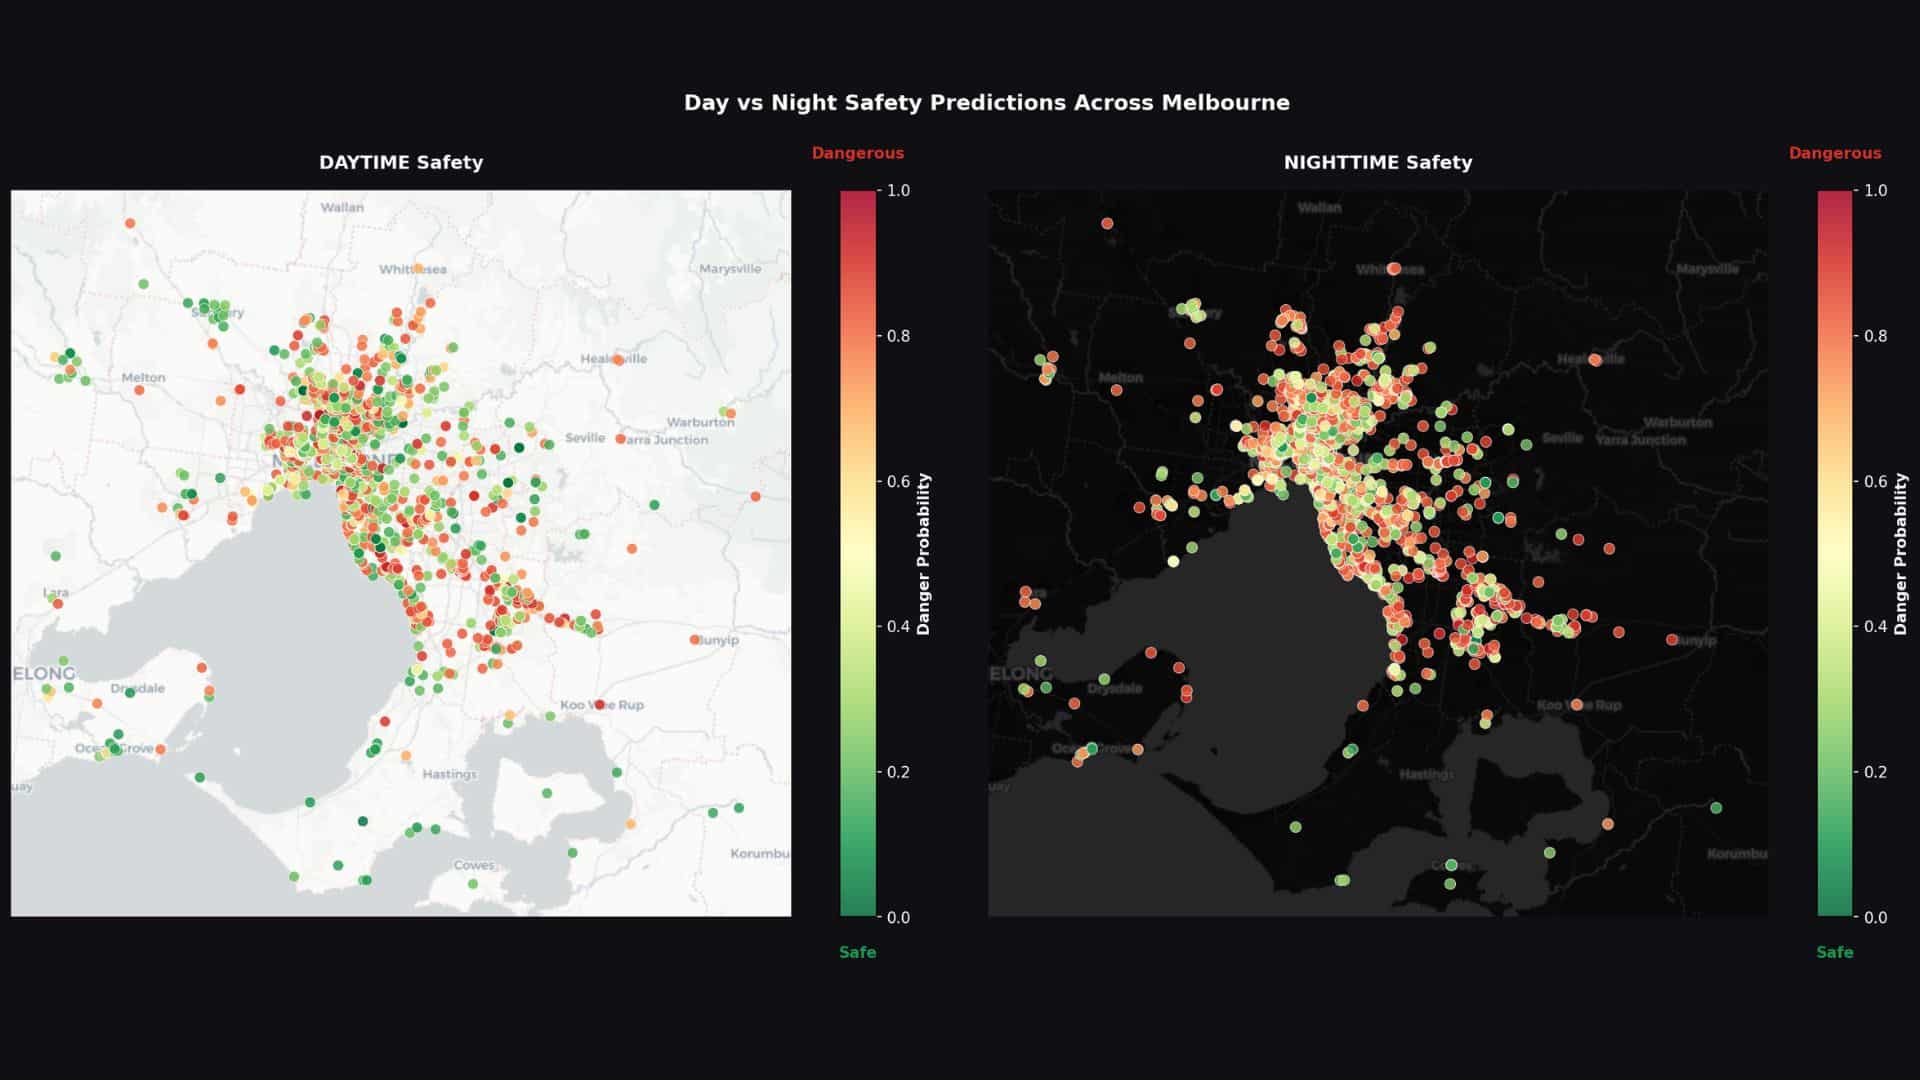
Mapped back onto Melbourne, the predictions show that points rated safe by day are frequently rated unsafe at night
Explainability (SHAP)
A Tree Explainer (specific to Random Forest) was applied to identify which features mattered most. To compare families of features fairly, SHAP values were averaged — not summed — within each family, so families with more individual features aren’t artificially inflated:
family score = mean(|SHAP| of its features)
The same underlying SHAP run also produced individual-feature charts, normalized as a percentage of the strongest feature.
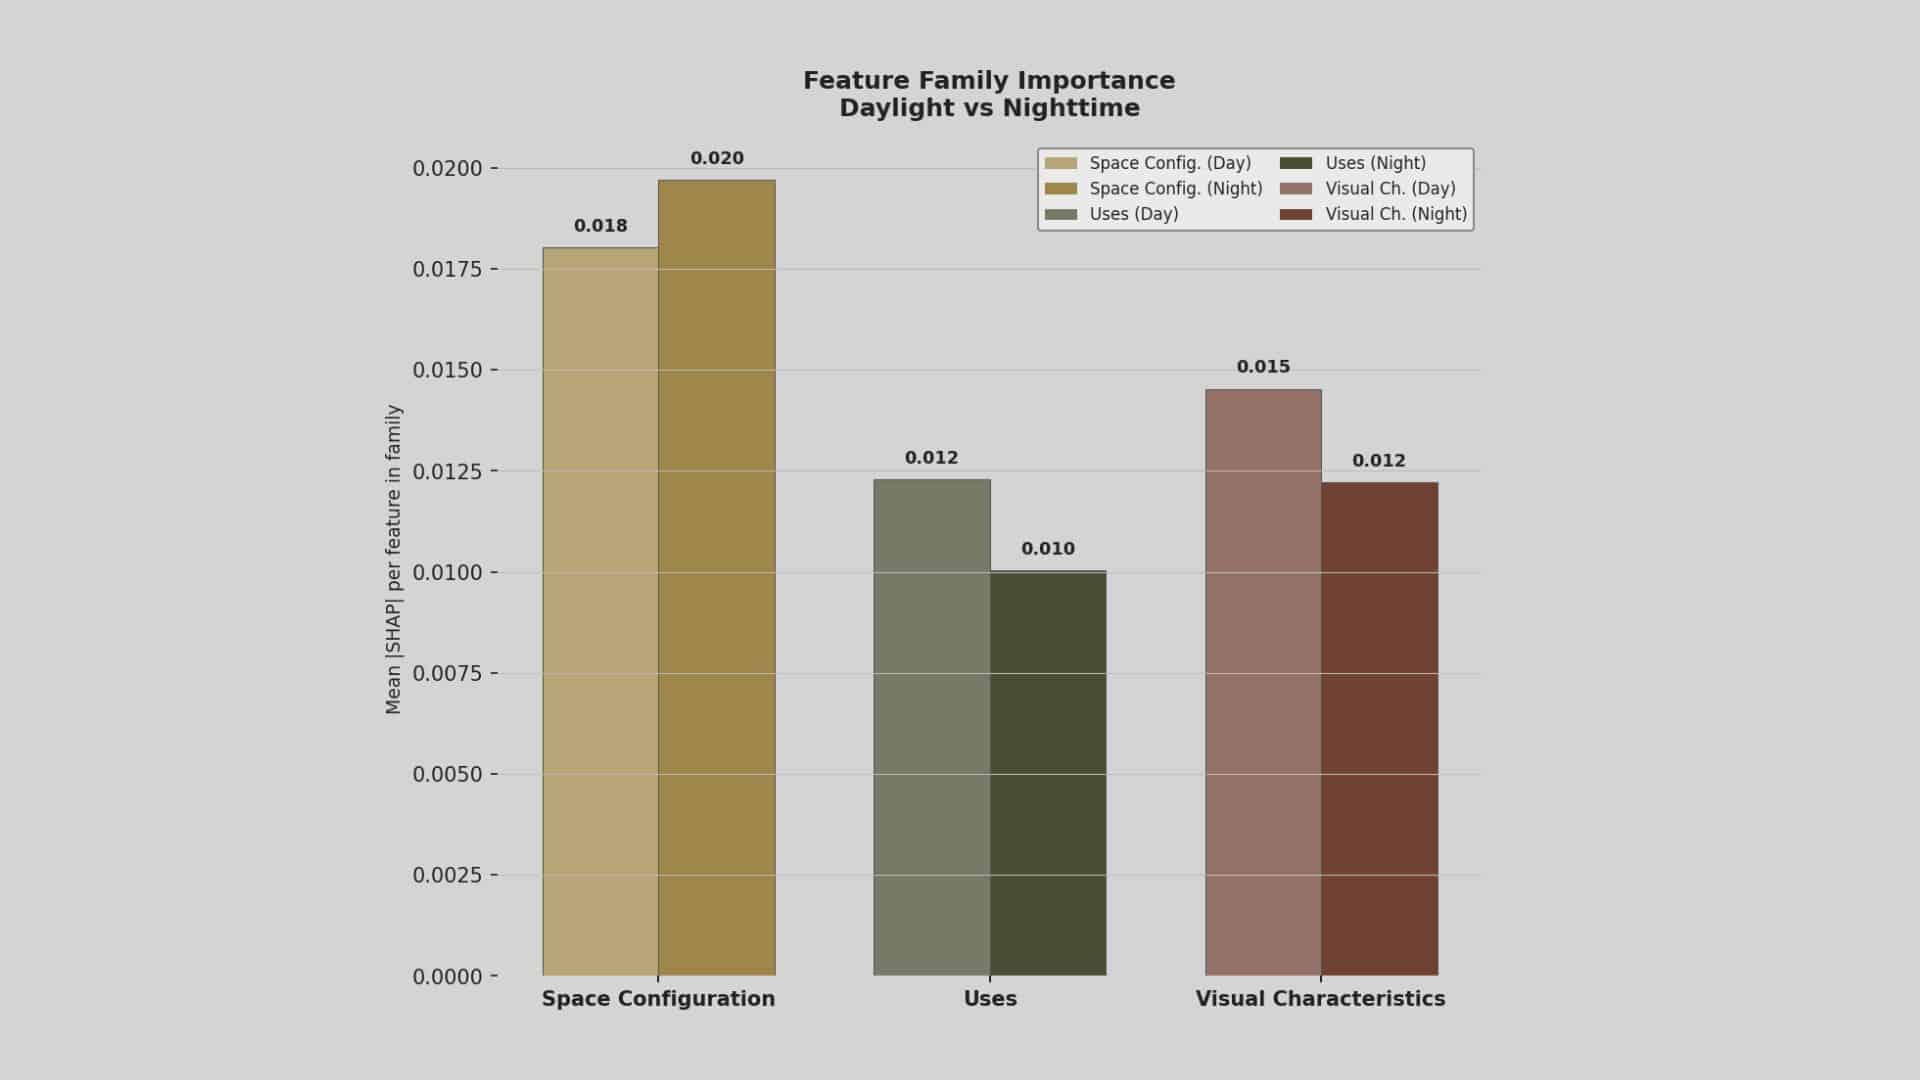
Family-level findings:
- Space Configuration is the dominant family, carrying the most weight per feature in both day and night models — consistent with Hillier & Hanson’s (1984) The Social Logic of Space (movement and co-presence follow street-network configuration) and Newman’s (1972) Defensible Space (legible, surveyable layouts lower crime and fear).
- Visual cues fade at night. One exception: perceived upkeep remains a safety signal even after dark (r ≈ −0.69, rank 10) — disorder is still legible even when greenery is not. This echoes Wilson & Kelling’s (1982) “broken windows” thesis: visible disorder signals lost control, while upkeep signals guardianship.
- Uses come third, staying lowest overall and softening further at night — except transit, which remains a constant danger signal both day and night.
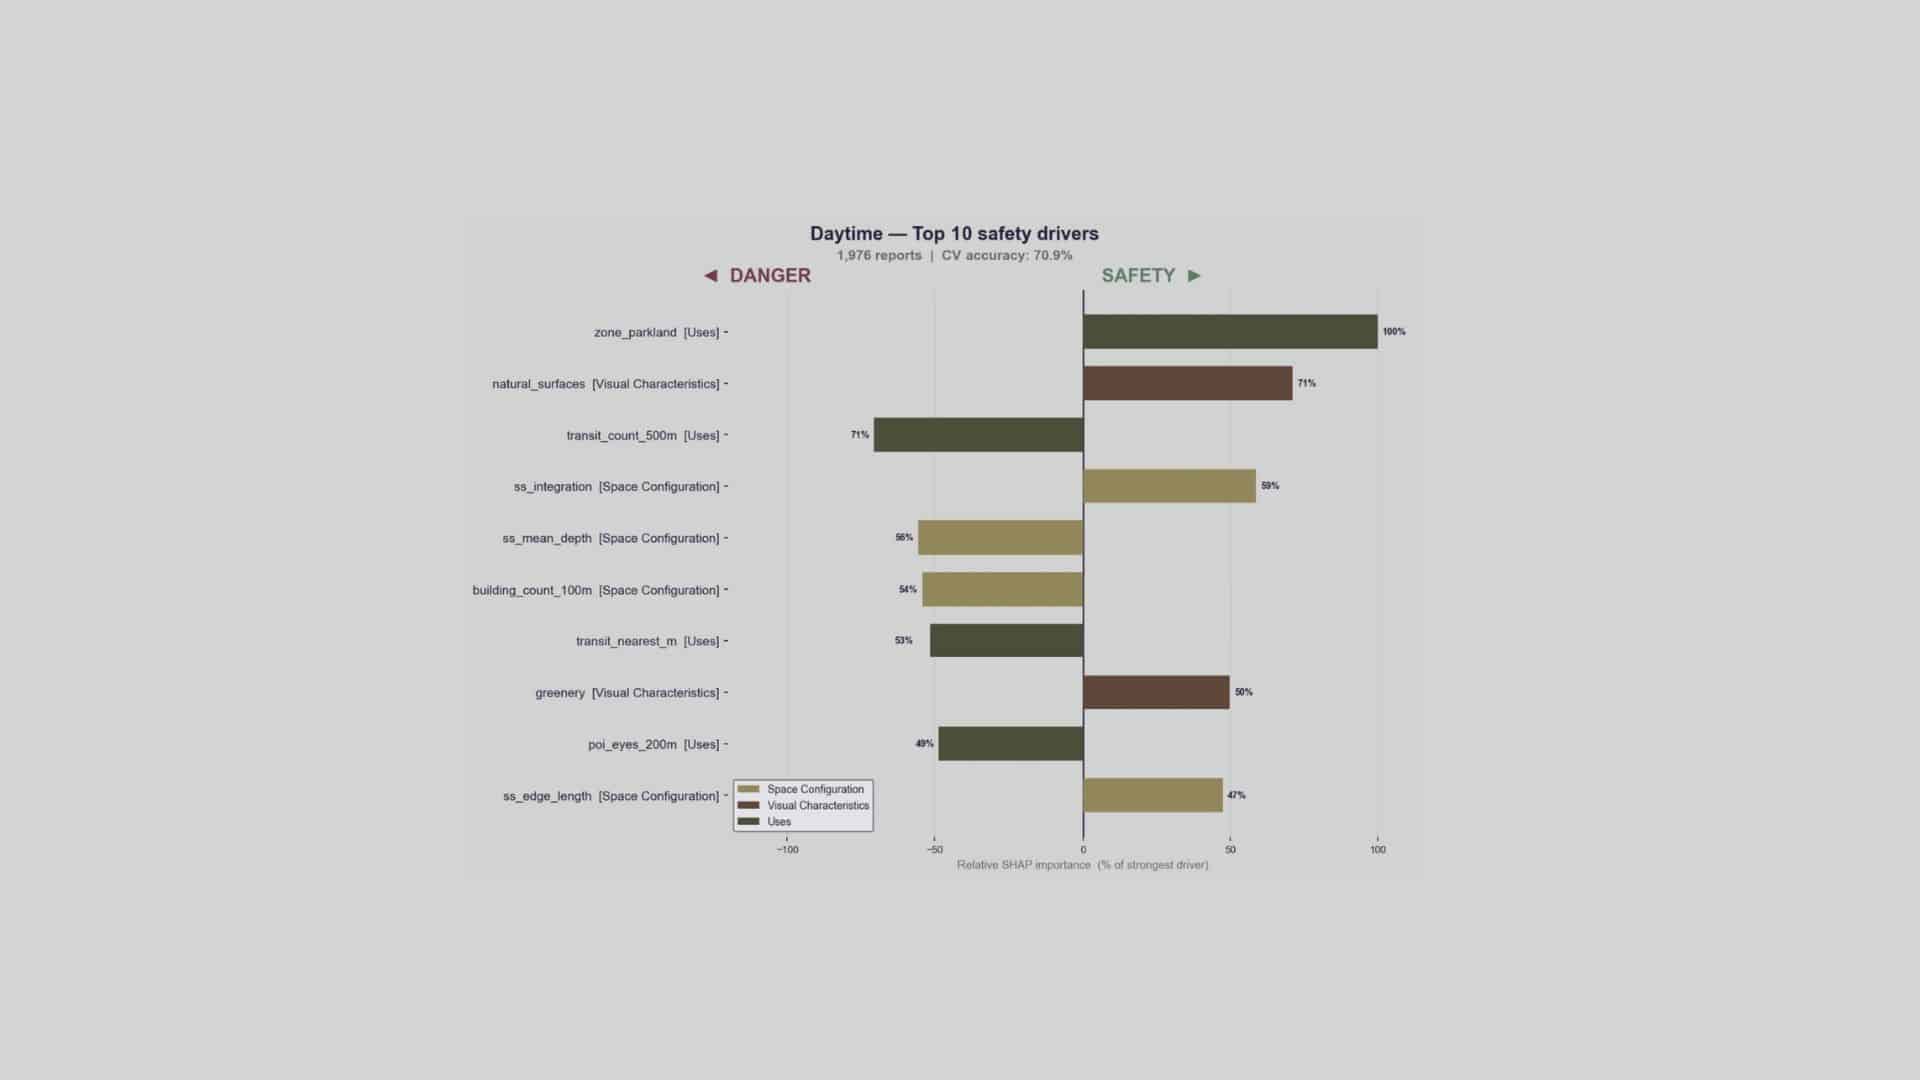
Individual-feature findings, daytime:
- Parks and greenery drive the feeling of safety — though this is partly reporting bias, since daytime park reports skew toward people there for leisure, whose positive context inflates safety ratings.
- Transit predicts danger: both proximity to a stop and density of nearby stops read as dangerous, consistent with Loukaitou-Sideris’s (1999) foundational study on bus-stop crime hot spots.
- Building density also reads as danger by day — partly because most reports come from the city center, and partly because built-up enclosure without openness feels less safe (a pattern that flips at night), in line with Browning et al. (2010) on commercial density and crime concentration.
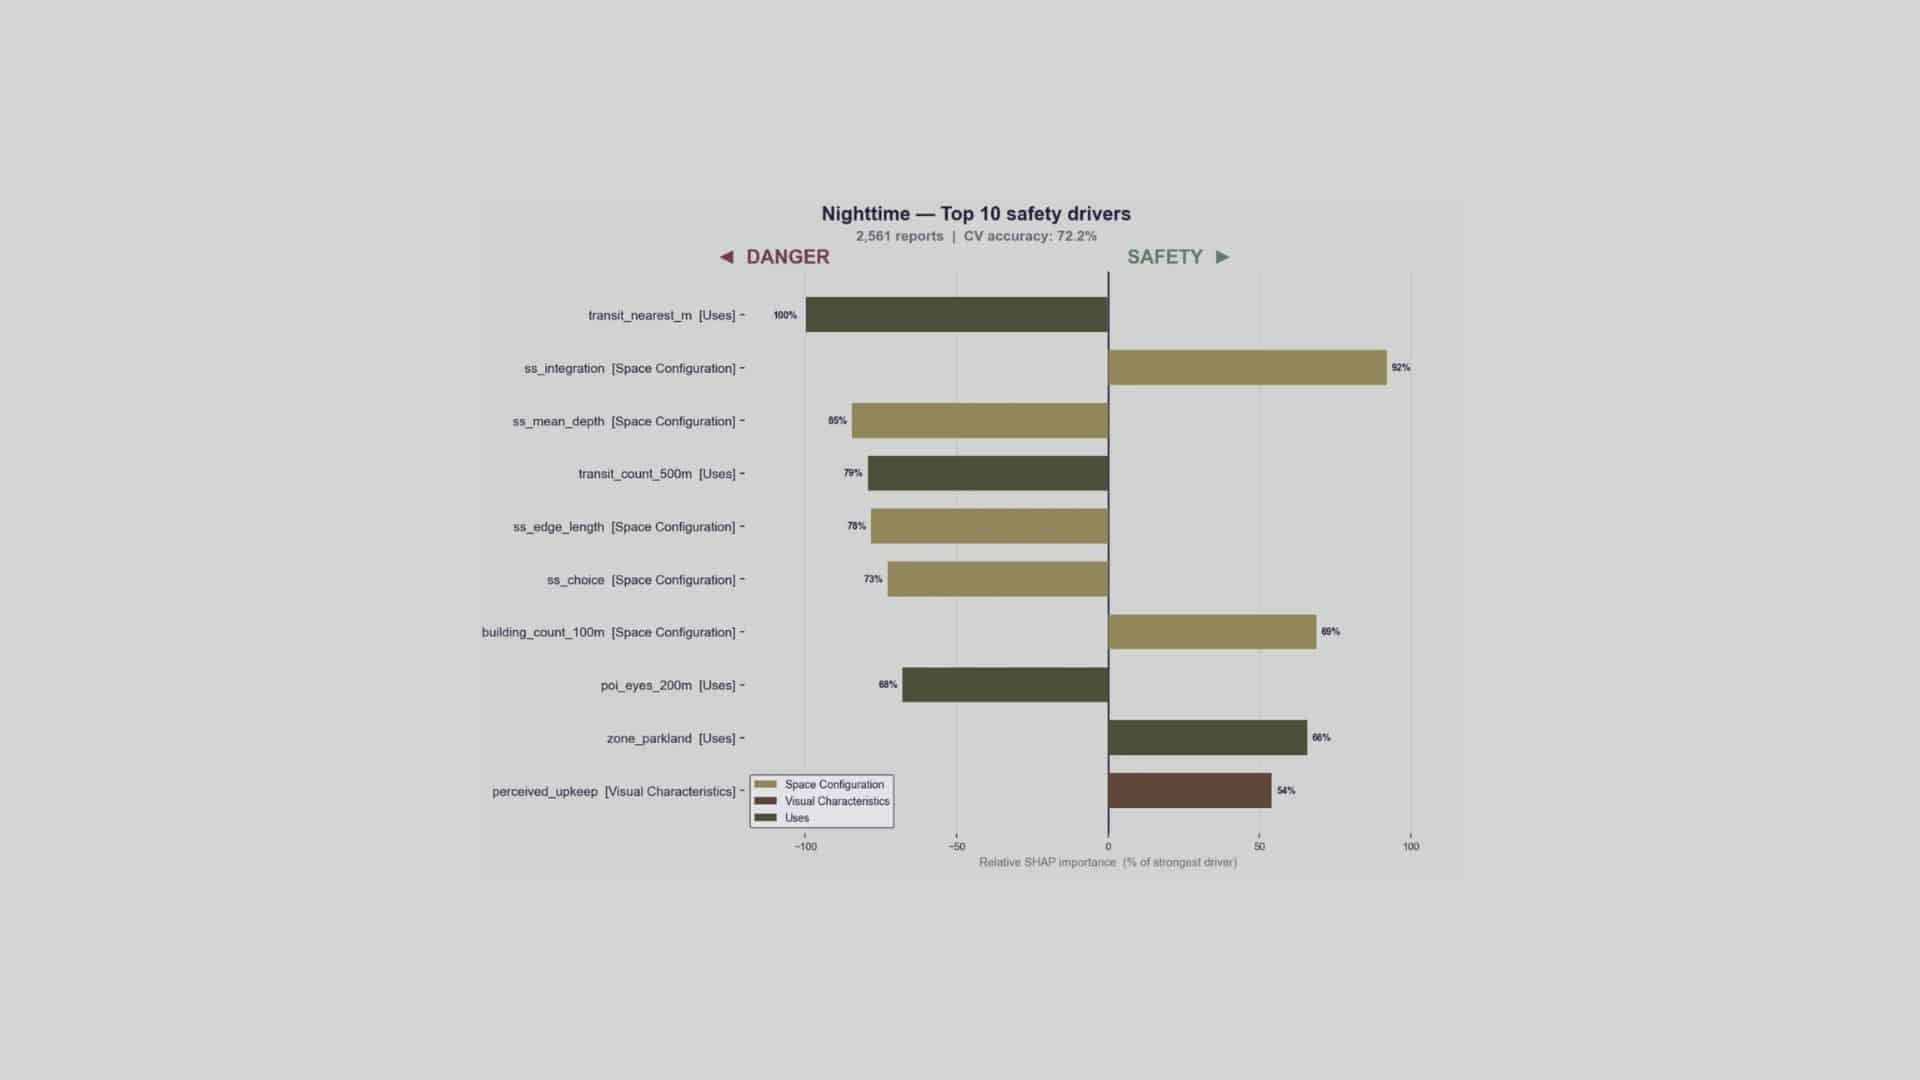
Individual-feature findings, nighttime:
- Space Configuration takes over — four of the top six nighttime features are Space Syntax variables. When appearance can’t be read in the dark, people fall back on the shape of the street network itself.
- Transit’s danger signal combines with spatial configuration and becomes even more influential at night than during the day.
- Of the visual family, only upkeep survives as a meaningful nighttime signal; the rest (greenery, materials) drop out, confirming that “visual cues fade at night” (Wilson & Kelling, 1982; Appleton’s prospect-refuge theory, 1975; Fisher & Nasar, 1992).
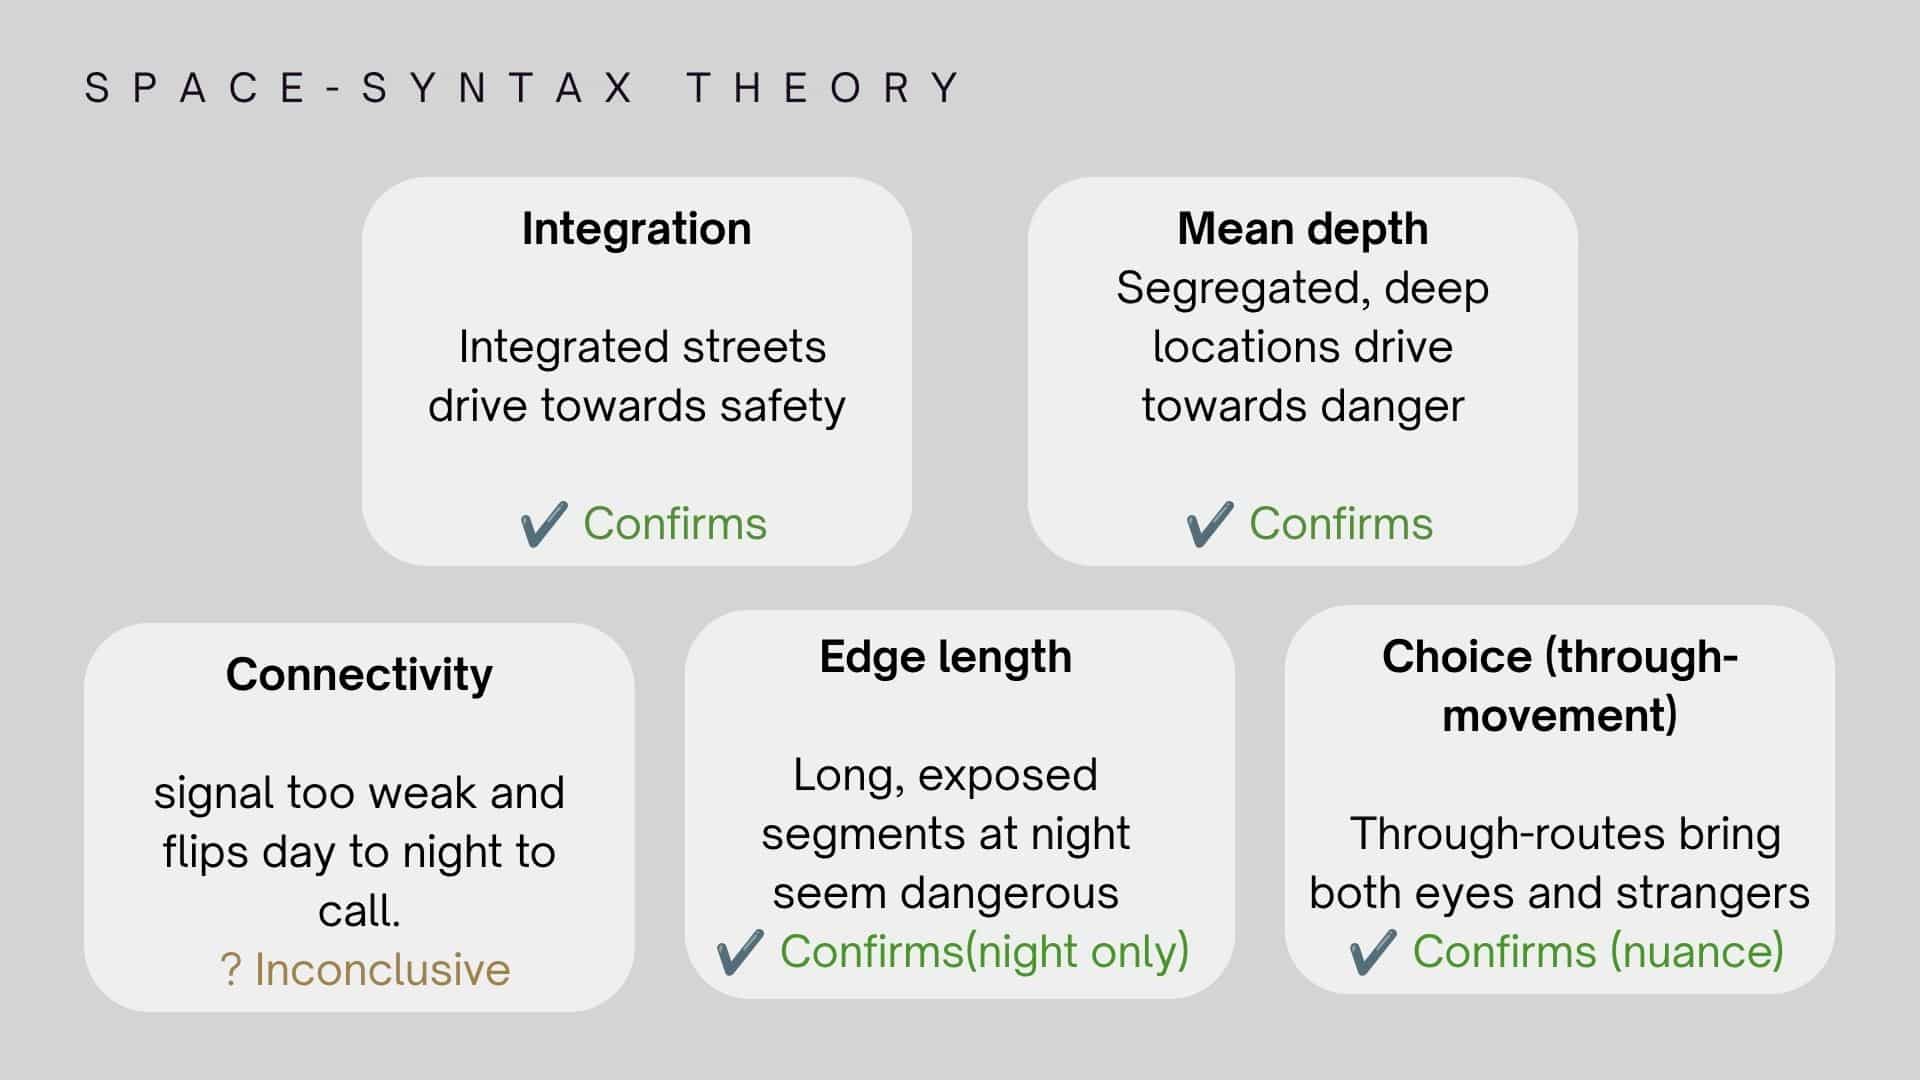
Space syntax values consistently dominated the top 10 features. The space syntax research community already links certain configurational values to street-harassment risk specifically , and these results mostly agree with that prior literature
The Proposed Application: A Diagnostic Tool for Urban Designers
How would that work?
- Each street segment carries a danger score (0–1) from the day and night safety models, broken down by the underlying feature families
- An urban designer or planner can select a segment or precinct and see why it scores as dangerous: which features are pushing the SHAP value up, and whether that signal is a day problem, a night problem, or both. Because the importance of each family flips between day and night (Visual cues matter by day; Space Configuration dominates by night), the tool would surface two separate diagnoses per location rather than one blended score.
- Designers can then simulate interventions and see the predicted effect before committing to them — e.g. adding lighting and benches (Visual family, mainly a daytime lever, though upkeep persists at night), adjusting building setbacks or street width (Space Configuration, dominant at night), or relocating/redesigning a transit stop (Uses : flagged as a constant danger signal day and night). The model re-scores the segment under the simulated change, giving an estimated before/after safety delta for day and night separately.
- Because Space Syntax variables (integration, mean depth, edge length, choice) consistently dominate the night-time model, the tool would also flag street-network-level issues that can’t be fixed with surface treatments alone e.g. a segment that is structurally too segregated or too deep in the network to “light its way” to safety, pointing instead toward longer-term network or connectivity changes.
