
(PaintDumpster/environmental_data_workshop at ndvi) – Link to GitHub
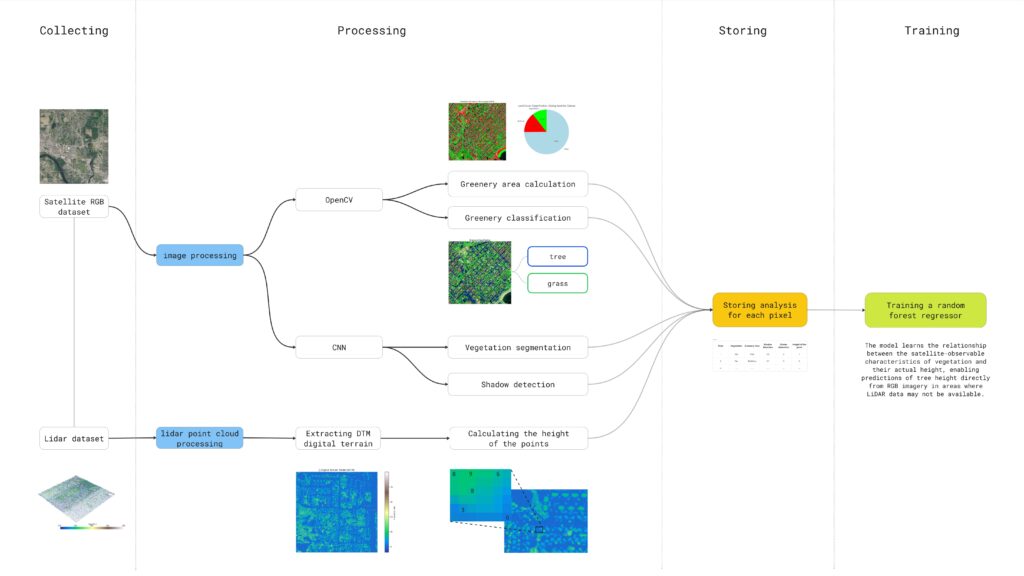
This project aims to detect and classify different types of greenery in satellite imagery by utilizing color and edge detection techniques. The study area is located in Barcelona, Spain (41.396536, 2.194554). The stable version employs color and edge detection for image segmentation, while an alternative method integrates LiDAR data with convolutional neural networks (CNNs) to determine which approach yields better results. An unstable version is also available on our repository in the NDVI branch . Key performance indicators include the percentage of area covered by trees, grass, and low vegetation.
Project Results
Our aim is to actually combine both methods of segmentation with open-cv and CNN’s based on lidar to get a robust workflow that can cross-validate the results of each technique.
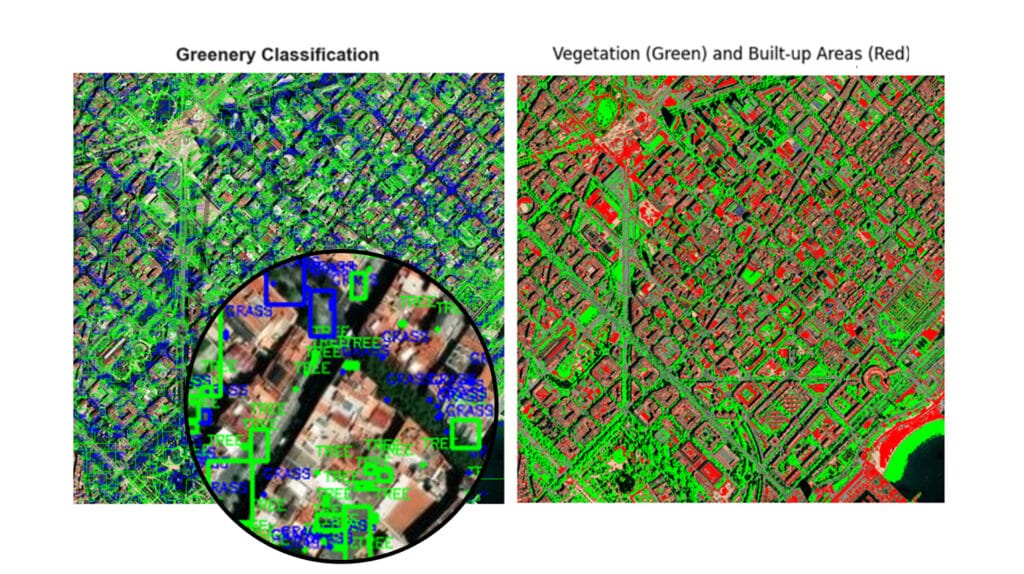
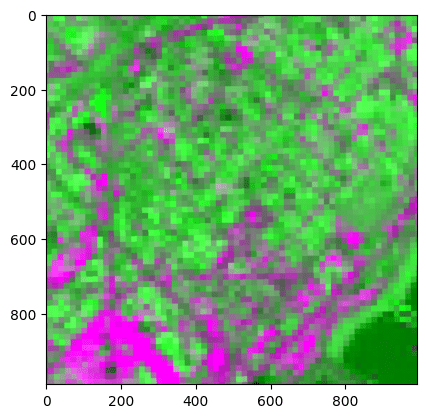
We successfully segmented vegetation based on shadow analysis, isolating two general categories. However, this method occasionally misclassifies non-vegetative green objects (e.g., green roofs, synthetic football fields, water, etc…). We hypothesize that incorporating a color mask based on NDVI imagery could improve the detection of genuine vegetation while excluding false positives.
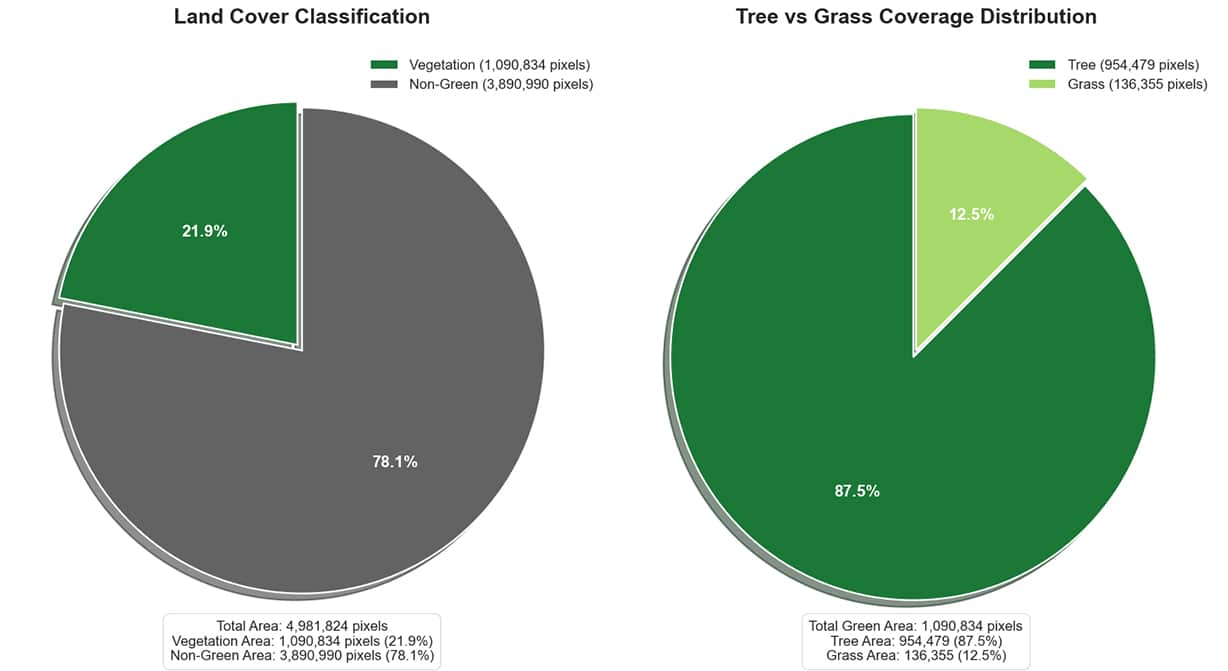
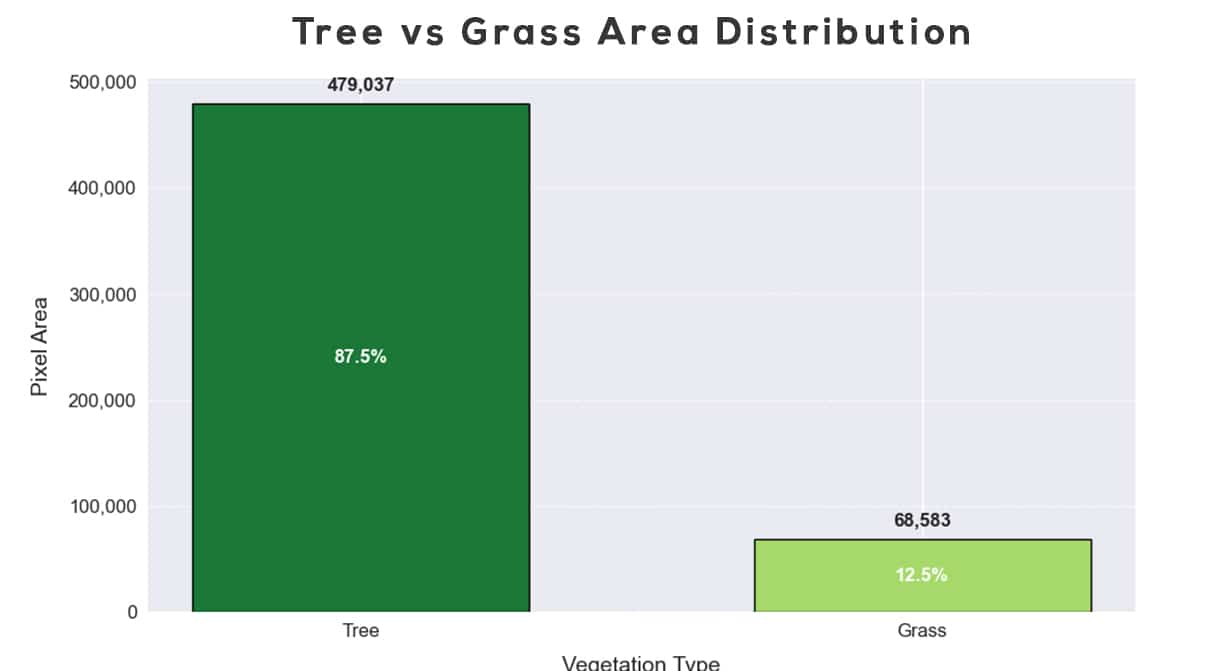
With this segmentation done, we proceeded to generate charts that show the percentages of vegetation types within the analysed area, also including the percentages of non-green areas. This segmentation of the vegetation types would eventually help us to elucidate KPIs like the percentage of public space protected by tree canopy.
Dataset preparation for greenery classification using CNN
This project presents the initial phase of a scalable machine-learning pipeline designed to model urban vegetation by combining LiDAR and RGB satellite data. We aim to train a model capable of predicting tree height and type directly from satellite imagery — learning from LiDAR as ground truth. The next steps show the analysis of the datasets to eventually train the model.
Step 1: LiDAR Data Preparation
We started by converting raw .laz LiDAR files into .las format using LAStools, enabling us to load and inspect the point cloud using Python libraries like laspy. This allowed full access to the 3D coordinates, return numbers, classifications, and intensity values of each point.
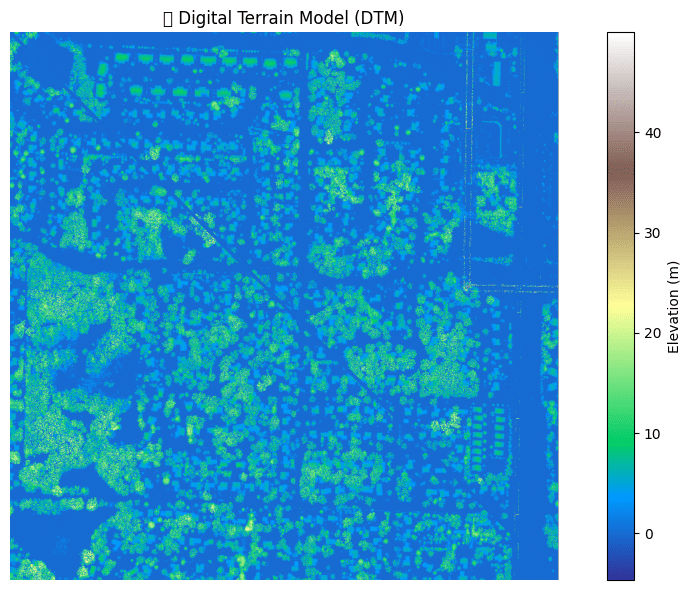
Step 2: Generation of Elevation Models
Using LAStools utilities, we first classified ground points to produce a Digital Terrain Model (DTM), then generated a Digital Surface Model (DSM) using first-return points. Theoretically by subtracting DTM from DSM, we shoul have computed the Canopy Height Model (CHM), which captures the height of vegetation and buildings above the ground. But we proceeded directly using the DTM that seems more interesting in quality and visual representation of buildings and vegetation.
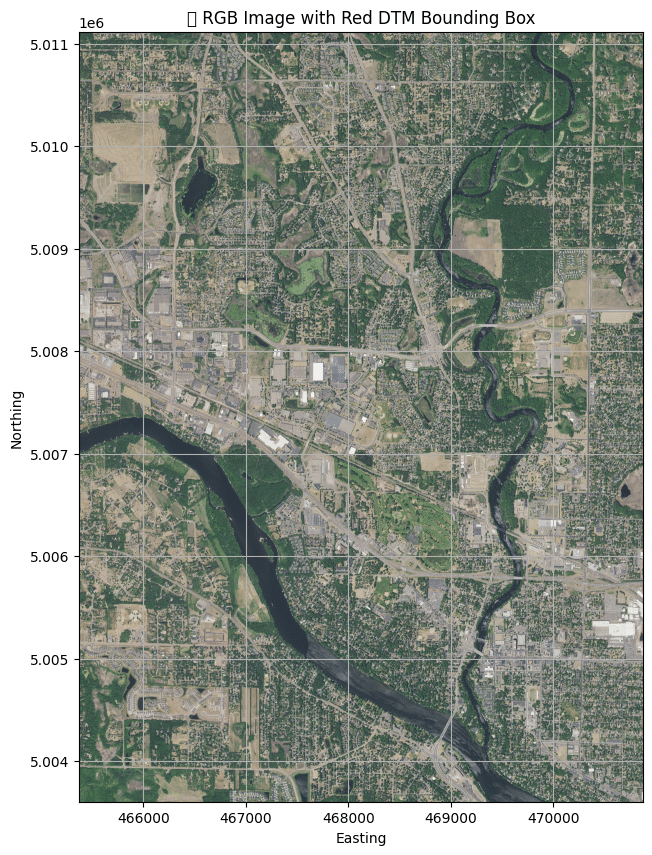
Step 3: Satellite Imagery Extraction and Alignment
Initially, we tested satellite imagery from EarthExplorer, but inconsistencies in projection and coverage led us to adopt Google Earth Engine (GEE). Through GEE, we queried and exported Sentinel-2 RGB imagery matched to the LiDAR tile’s extent and resolution.
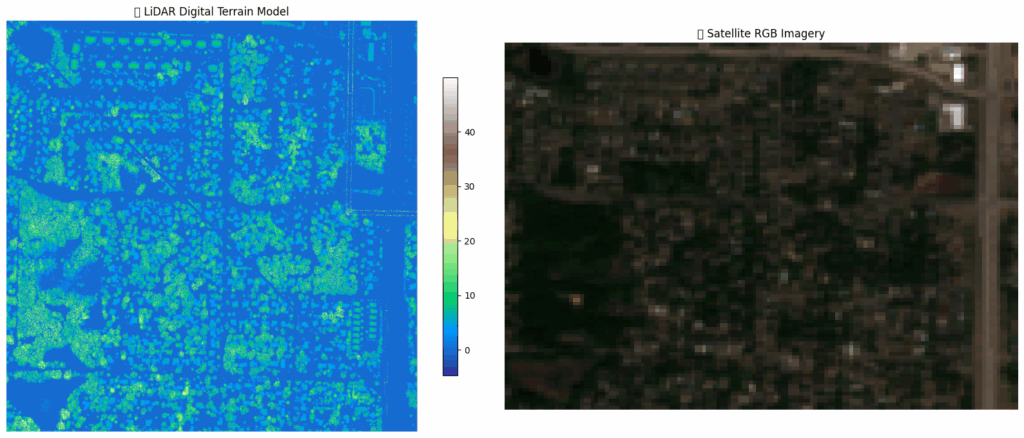
Step 4: Visualization and Validation
We visualized and compared the DTM and RGB satellite imagery to verify spatial alignment — a necessary validation step before feature extraction and model training. This is where we had an issue of quality and scaling that need to be fixed for a proper geospatial overlap that ensures each RGB pixel can be matched with corresponding LiDAR height data.
Limitations
1. Using Google Earth Engine maps proved more challenging than anticipated for small areas, as it produced extremely low-resolution tiles unsuitable for our purposes.
2. Although CNNs can predict tall vegetation areas, we faced constraints related to technical expertise, dataset construction for training, and available time.
Future Direction
We plan to focus exclusively on researching CNNs and alternative models to predict the locations of green elements from satellite imagery. This research builds on emerging studies that demonstrate the potential of these techniques to segment vegetation in detail—even distinguishing individual plant species. Further literature review is needed to fully explore the state-of-the-art methods in this field.
Further time is needed to scale the process to multiple LiDAR tiles and their corresponding RGB satellite imagery. The goal is to build a supervised machine learning pipeline capable of estimating vegetation height and type based on satellite features. The planned workflow includes:
1. Extracting visual features (e.g., texture, color, spatial patterns) from RGB satellite images using convolutional neural networks (CNNs).
2. Matching each pixel or spatial unit in the satellite image with corresponding height values derived from the LiDAR Canopy Height Model (CHM).
3. Training a model capable of predicting vegetation height and classifying tree types from RGB data alone — emulating human visual interpretation using automated inference.
This integration of remote sensing and machine learning aims to enable large-scale, automated urban vegetation analysis.
References & Future Outlook
This project is inspired by recent research that integrates LiDAR data with RGB imagery for urban vegetation analysis. The following references have guided the design of our initial pipeline and suggest future directions, particularly in applying machine learning to assess vegetation structure and climate resilience.
Wu et al. (2024) – Fine Classification of Urban Tree Species Using UAV-Based RGB and LiDAR Data
This study combines UAV-acquired RGB imagery and LiDAR to classify urban tree species. A set of spectral, texture, and structural features is extracted from both data sources, including vegetation indices and normalized Digital Surface Models. A Random Forest model is trained on these features, and the classification is refined using spatial post-processing.
Relation to this project:
This approach supports the combination of RGB and LiDAR-derived features to identify vegetation types. It provides a reference for using supervised models and feature fusion to classify vegetation across urban environments.
Oshio & Asawa (2023) – Mapping 3D Structure of Urban Trees from Airborne LiDAR for Topographic Survey
This paper estimates 3D leaf area density (LAD) using low-density airborne LiDAR data by applying a voxel-based method. Despite the lower point density, the approach successfully models vegetation structure, showing that national topographic survey data can be used for vegetation estimation at a meaningful resolution.
