
The Landscape of Risk
India has witnessed 3782 major landslides between 2015–2022.
Regions like Himachal Pradesh, Uttarakhand, Kerala, and the North-East are especially vulnerable.
Landslides disrupt cities, block roads, damage homes — and in some cases, like Wayanad in 2024, result in loss of lives and millions in damages.
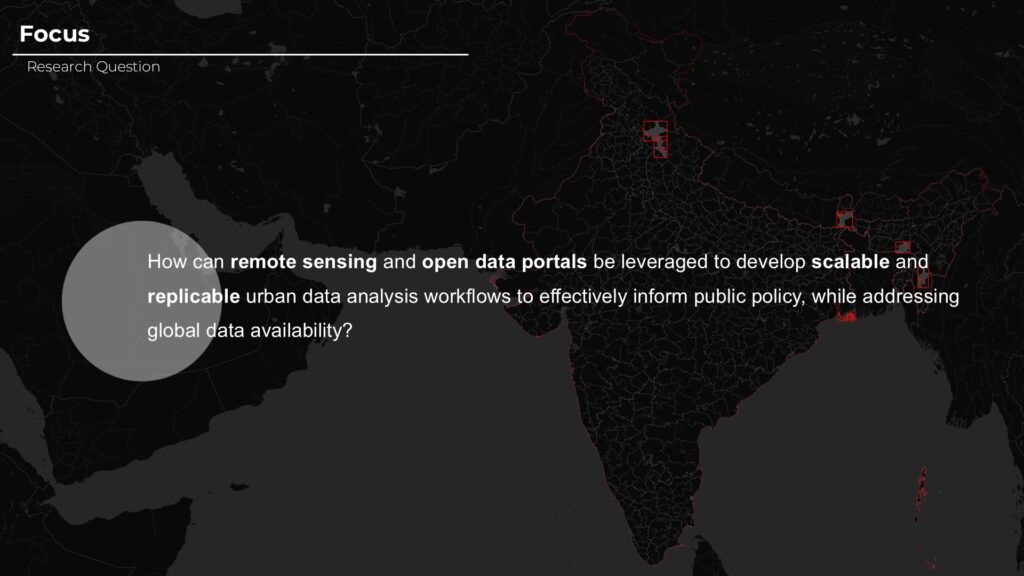
The Research Question
How can remote sensing workflows help identify and assess landslide risks in Indian cities?
This is approached through:
- Identifying high-risk areas
- Correlating risk with urban conditions
- Validating patterns across geographies
The Dataset Stack
Cities chosen based on three filters:
- High landslide susceptibility
- High population density
- Urban clusters
Result Validation
Identified results, and screening false positives by overlaying city administrative boundary bounding boxes, and historical data of landslide points to identify citied with active landslide activity in urban and peri-urban areas.
The Study Set
The identified study set includes the following cities for the research:.
Aizawl, Darjeeling, Dehradun, Shillong, Shimla
These cities would be used for experimenting and testing correlational/analysis workflows and thus divided into:
Pilot & Test Cases
Aizawl is the pilot city, with the rest as test cases.
Each case reveals unique urban-rural dynamics, terrain variation, and vulnerabilities.
The Workflow
1. Landslide Cause Mapping
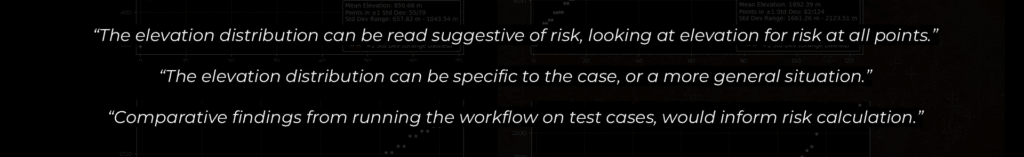
By extracting elevation, slope, land use types, and more — correlations are established.
2. Urban Vulnerabilities_Density Calculation
Using OpenStreetMap to assess how buildings and roads intersect with landslide zones.
3. Urban Vulnerabilities_Proximity Calculations
Measuring how close landslide points are to urban elements — especially roads and buildings.
Insights & Implications


The Path Forward
The methodology is:
- Replicable across geographies
- Adaptable to other risks
- Built entirely with open data
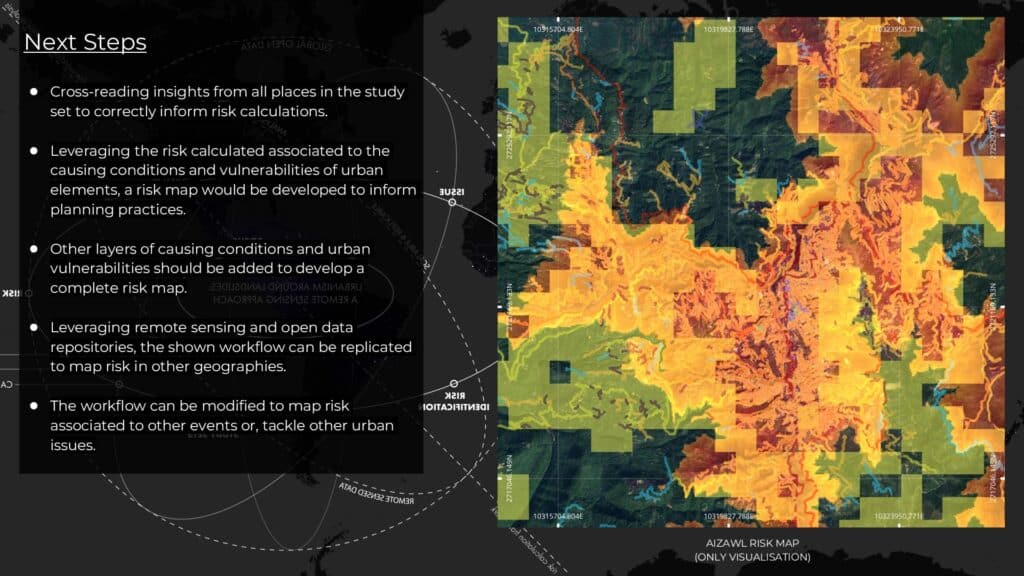
Final goal: Generate urban risk maps for urban resilience planning.
