Hemp industry is one fast-growing, environment-friendliest, and perspective branch of the World economy. The hemp market is driven by the growing demand for industrial hemp from application industries, such as the food & beverage, personal care, and animal care industries, across the globe.

This infographics of hemp production is made in Grasshopper using imported geojson shape files and the CSV dataset about hemp harvesting and production by country from https://www.fao.org/faostat/.
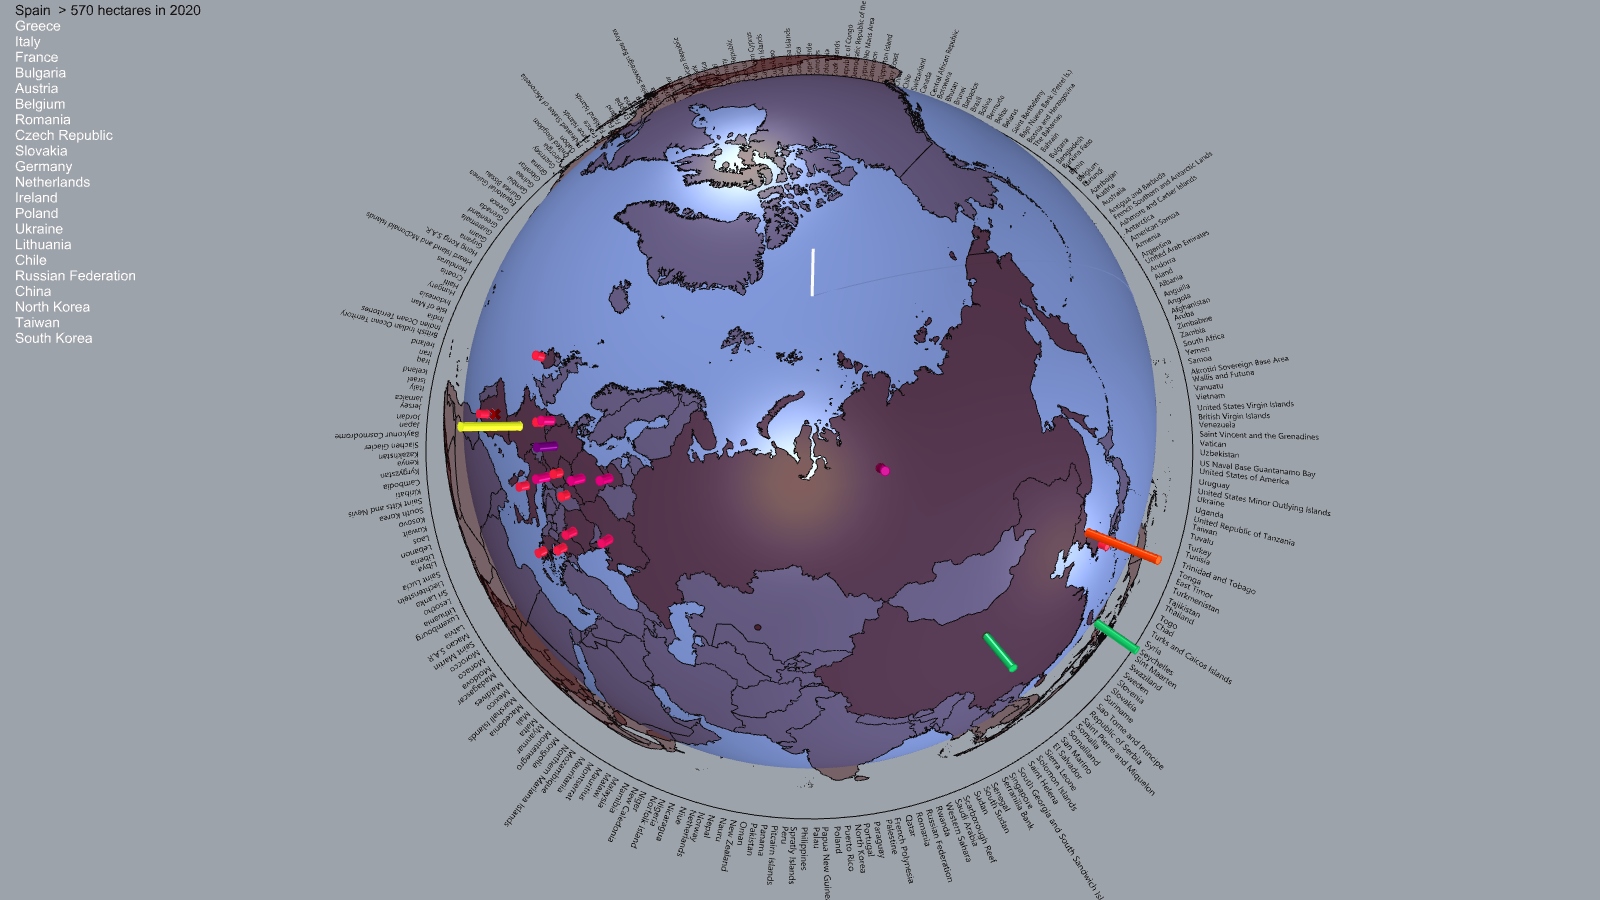
According to FAOSTAT, 3D bars represent total hemp harvesting areas by country in 2020. The interactive infographic in the top left corner shows the top 20 countries and incrementally highlights the relevant data.
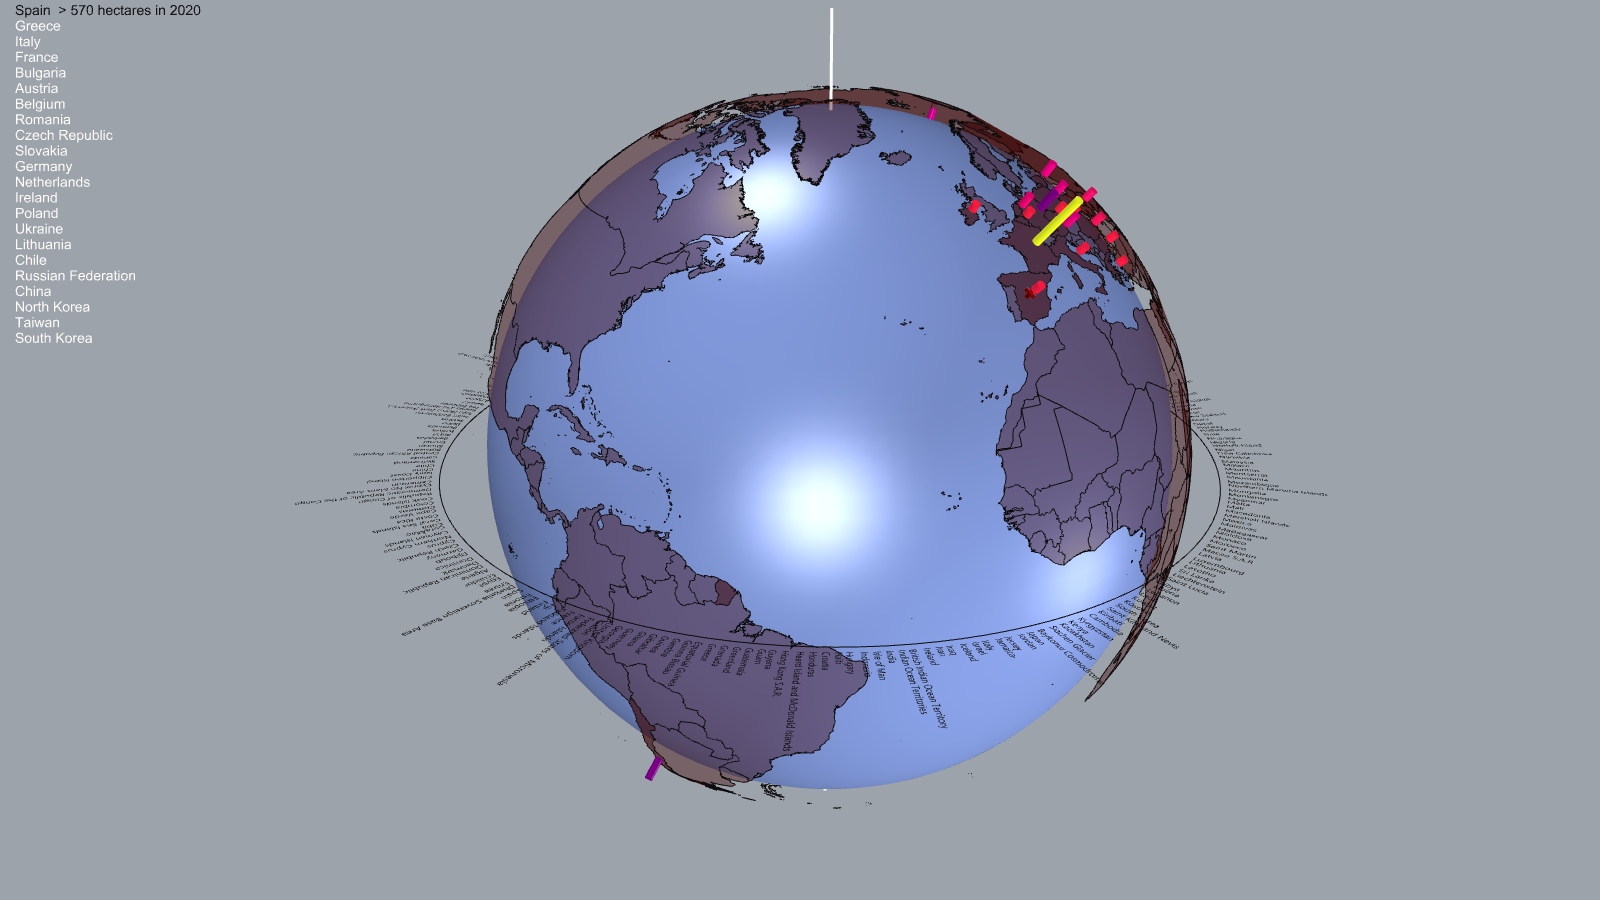
The equator circle visualizes the list of names of 255 countries and territories.
Animated image represents each of the top-20 hemp production countries consequently.

The next step of analysis is dedicated to hemp construction and the potential of CO2 mitigation with this technology in Europe. Hempcrete is quite a new innovation in construction, but the only one that can sequester CO2 from the atmosphere. Consisting of hemp hurds, hydrated lime, water and a binder, hempcrete, positively, is one of the future materials for construction that in combination with wood can sufficiently help to mitigate the climate change effect.
Hempcrete, embodied in renovated building, can sequester approximately 165 CO2 kg per 1 tonne of material. The majority of new hempcrete buildings have timber-frame structures, although also hempcrete could be efficiently used for brick, concrete and stone buildings in terms of renovation, especially for heritage. Nevertheless, considering the CO2 sequestration by hempcrete and embodied carbon of timber, the most environment-friendly building comes out from the combination of hempcrete and timber.
This analysis evaluates selective areas of production of two main compounds of hempcrete in Europe – hemp hurds (shives) and hydrated lime. 27 locations throughout Europe have been selected to cover whole area of all countries evenly . Literally, there is the way to understand what area around a hemp production site is accessible for delivery of hempcrete construction by specific ranges: 30, 60, 90 and 120 min. Using the GeoMining technology and of the Global Friction Surface 2019 from the Earth Engine Data Catalog hempcrete delivery areas are shown as isochrones of accessibility.
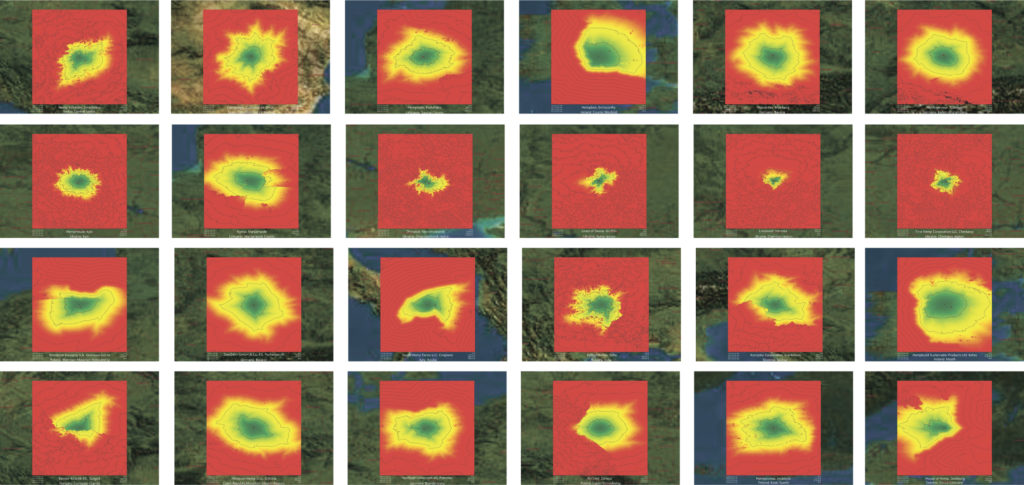
Animated infographics represent each location subsequently. The information below the image contains the name of a manufacturer, location name, country and region according to NUTS2 classification. On the corners, we can see the information of three sequentially increasing isochrones: CO2 emission produced by a 40-tonne delivery truck with diesel fuel consumption of 13 liters per 100 km to the most remote point on the isochrone – on the left, and a potential delivery area of hempcrete materials within a specific time range – respectively on the right. This part of CO2 emission calculations can be used in the total balance of CO2 sequestration, although other CO2 emitting sources were not considered in the analysis, and are the topic of more profound research.
For geography orientation reasons, boundaries and names of NUTS2 regions are plotted on a global map.
The same methodology applies to manufacturers of hydrated lime. Mining sites of lime are used as locations here.
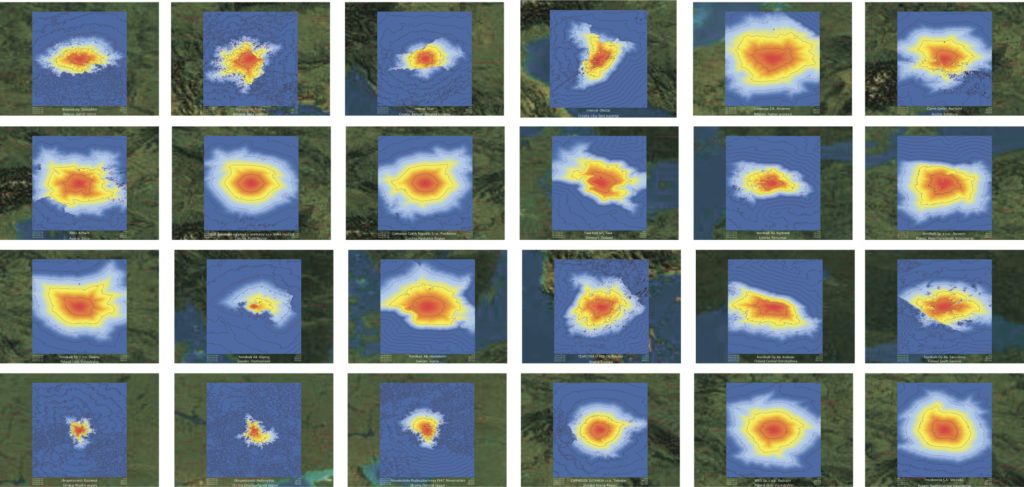
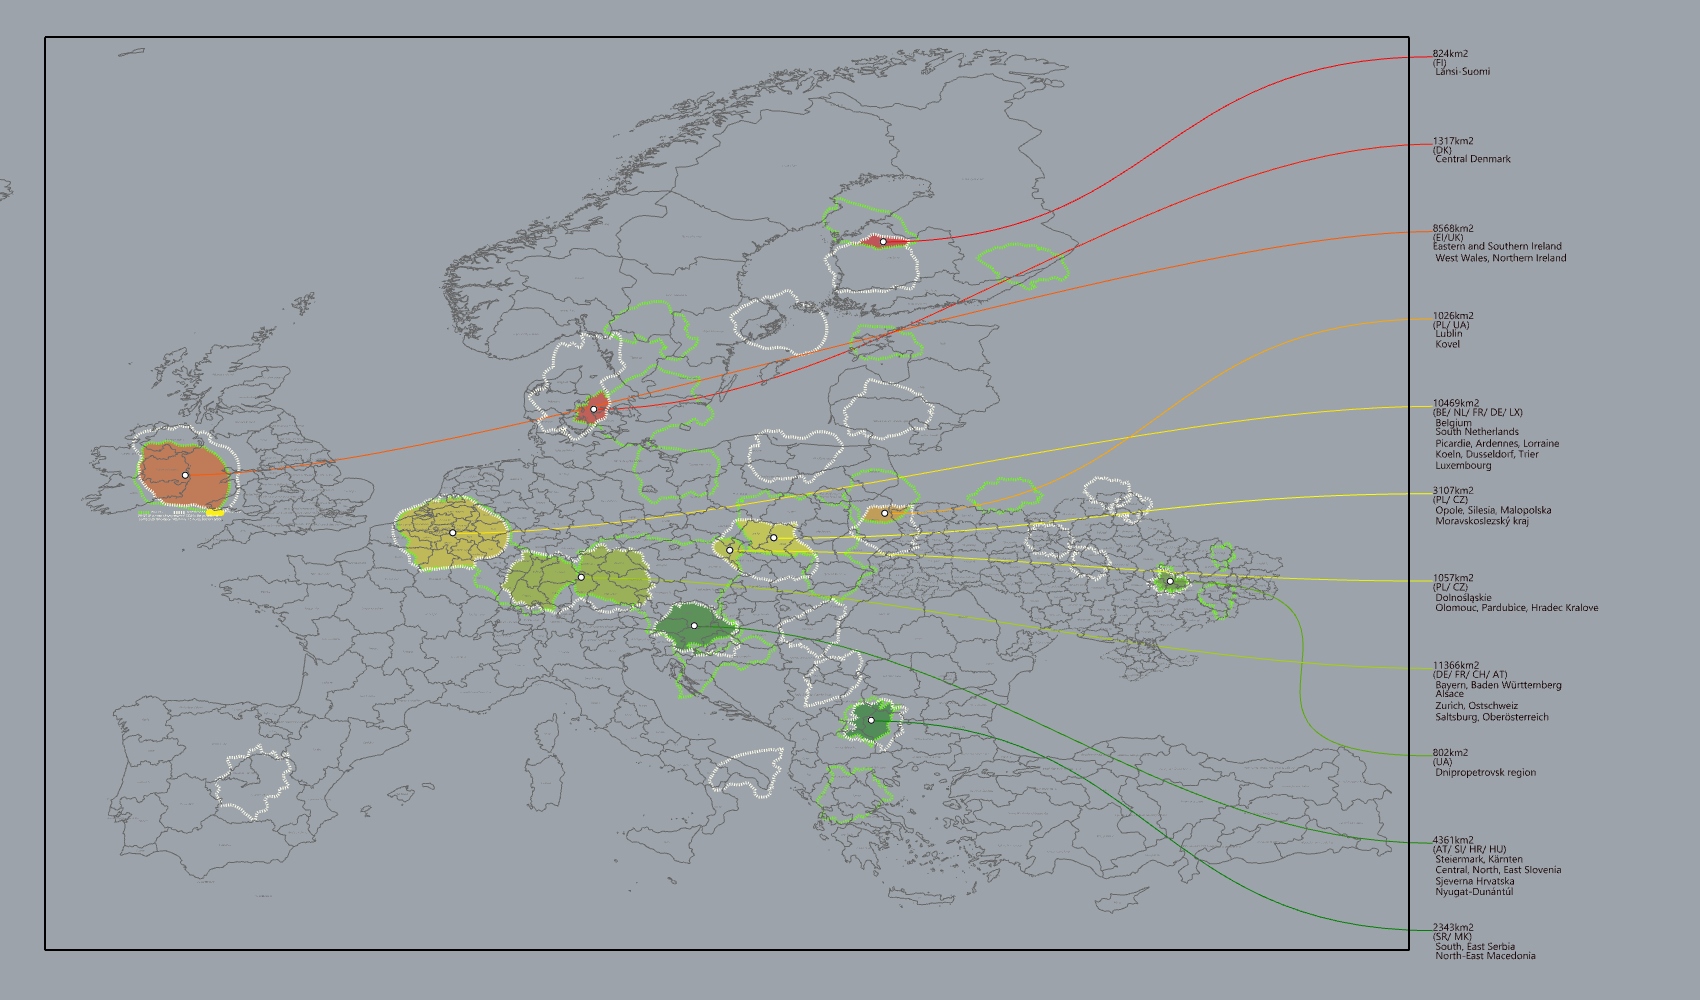
In the next part, analysis is focused on identification of overlapping isochrone areas of two hempcrete compounds and figuring out the potential of CO2 sequestration by hempcrete renovation of cities within overlapped areas. Isochrones of the 3rd level-distance (approx. 1.5 hours) were selected for the overlapping test. Thus, here we can see where exactly two components of hempcrete intercross and evaluate a potential CO2 mitigation in the overlapped areas.
Animated infographics represent each overlapping area subsequently. The information below an overlapped area contains the calculated amount of CO2 tonnes potentially sequestered by the renovation of housing stock within the overlapped area. A simplified methodology applies to math, the sequestration. The continuous urban fabric was identified (codes 101 and 102) within overlapped areas using technologies of GeoMining and Earth Data engine dataset Copernicus Corine Landcover CLC 2018 (countries beyond EU has no coverage, so data can be wrong there). As a sequence, the final amount of housing stock to renovate can be calculated from the area of specified urban fabric by the application of factors of residential plots (30%), average floors (3.5), and renovation demand (10%). Further, after figuring out factors of building volume, the share of hempcrete, construction correction, and the CO2 sequestration share 165 kg/1m3, the pursuing amount of sequestration are calculated. For geography orientation reasons, boundaries and names of NUTS2 regions are plotted on a global map.
Please note that this analysis is experimental with the purpose of sublimation of a general idea and its visualization only, has data biases, and does not shape the whole image of the hempcrete industry.
References:
- Food and agriculture data FAOSTAT – https://www.fao.org/faostat/en/
- Region boundaries NUTS 2 – https://ec.europa.eu/eurostat/web/nuts/nuts-maps
- Members of European Industrial Hemp Association – https://members.eiha.org/#/members-directory
- Members of European Lime Association – https://www.eula.eu/about/members/
- Global Friction Surface 2019 – https://developers.google.com/earth-engine/datasets/catalog/Oxford_MAP_friction_surface_2019
- Copernicus CORINE Land Cover CLC 2018 – https://developers.google.com/earth-engine/datasets/catalog/COPERNICUS_CORINE_V20_100m
- GeoMining technology. Iacopo Neri – https://github.com/neriiacopo/GeoMining-EE-Hops
- Assessment of Carbon Sequestration of Hemp Concrete. Tarun Jami, Sumit Kumar – https://www.researchgate.net/publication/320058537_Assessment_of_Carbon_Sequestration_of_Hemp_Concrete

