Hypothesis
Optimizing Self-Shading in Clay 3D-Printed Geometries
Methodology
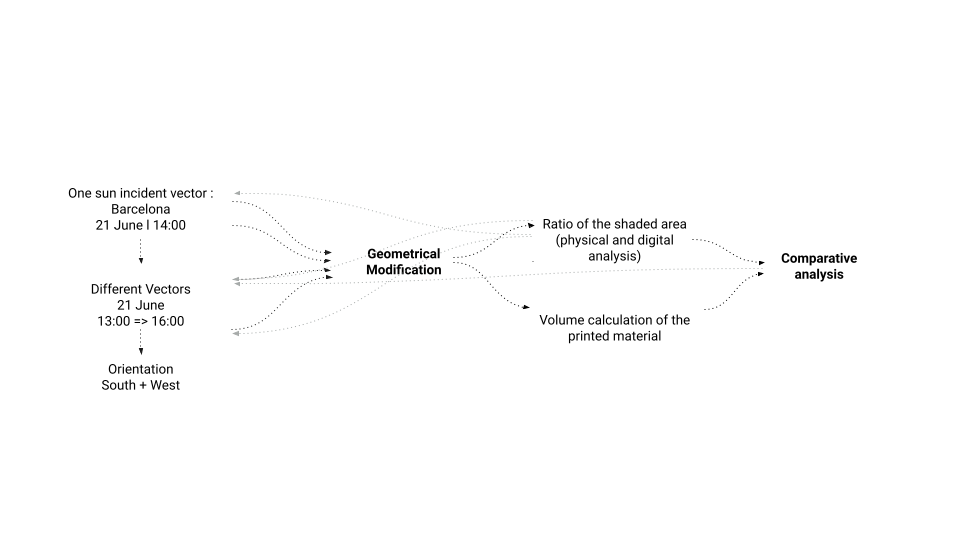
Incidence vector analysis:
Using the position of the sun in Barcelona to simulate realistic shading.
Evaluation of different vectors and orientations to identify optimal shading configurations.
Geometric modification:
Create geometric modifications according to vectors at a precise hour, 14:00 on 21 June and then at different hours 13:00, 14:00, 15:00, 16:00.
Adjusting angles and shapes to improve self shadowing
Comparative shadow analysis:
Physical and digital analysis: Measuring the ratio of shaded areas across modified geometries.
Develop Grasshopper code for accurate shadow simulations to verify physical results.
Volume Calculation:
Calculate material volume for each geometry to evaluate shading efficiency in relation to material usage.
Target designs that balance shading effects
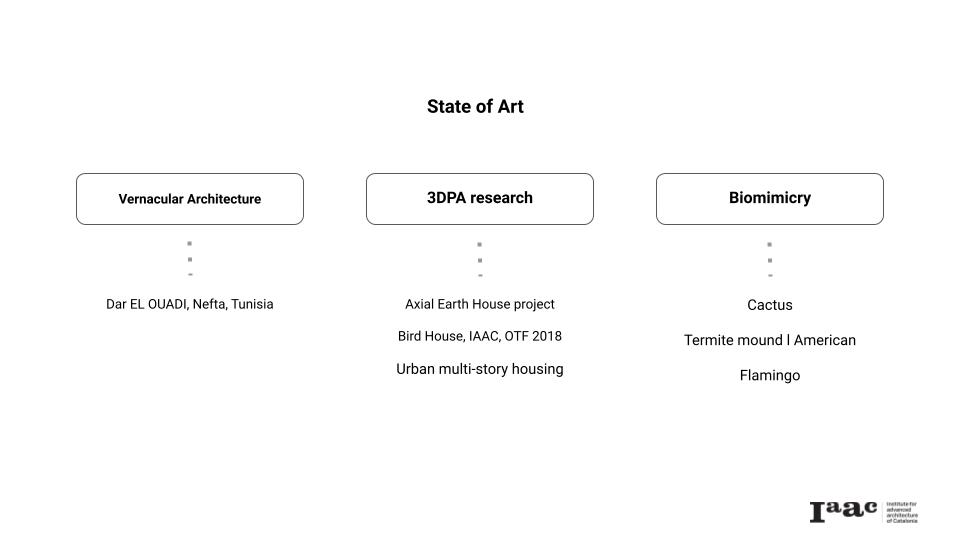
State of Art
Design Process
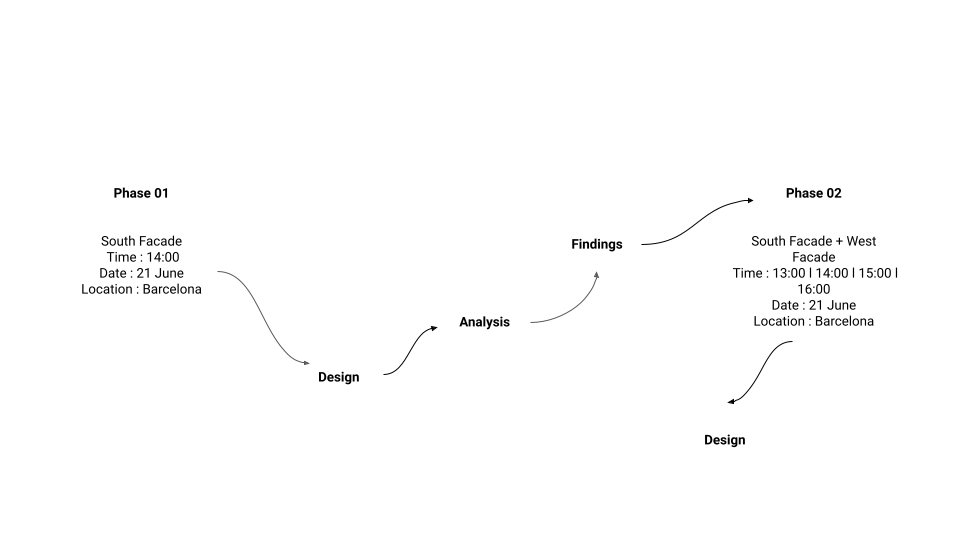
Design l Phase 01
Design Concept
South Wall
Location : Barcelona
Time : 14:00
Date : 21 June
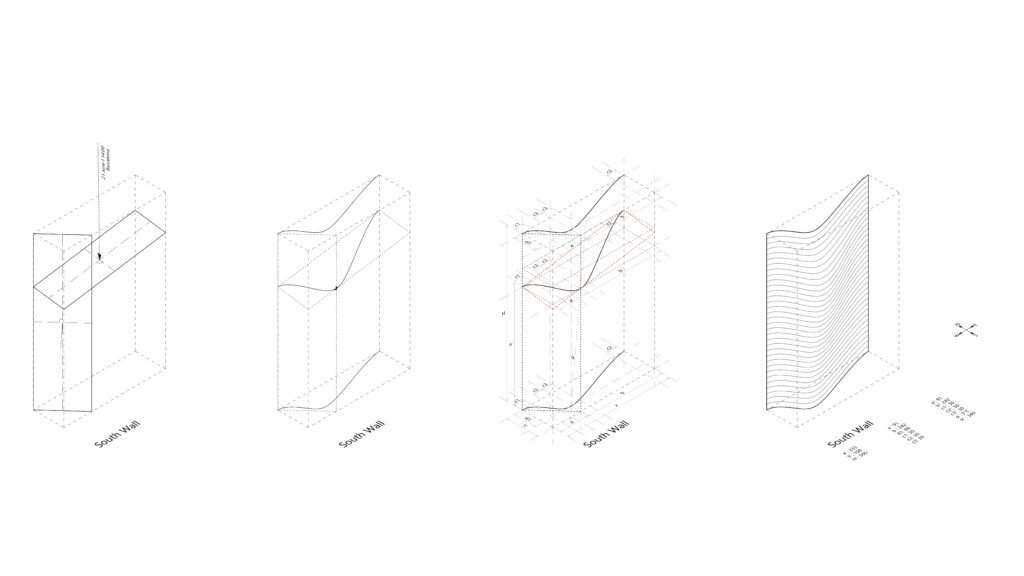
Geometrical Modification
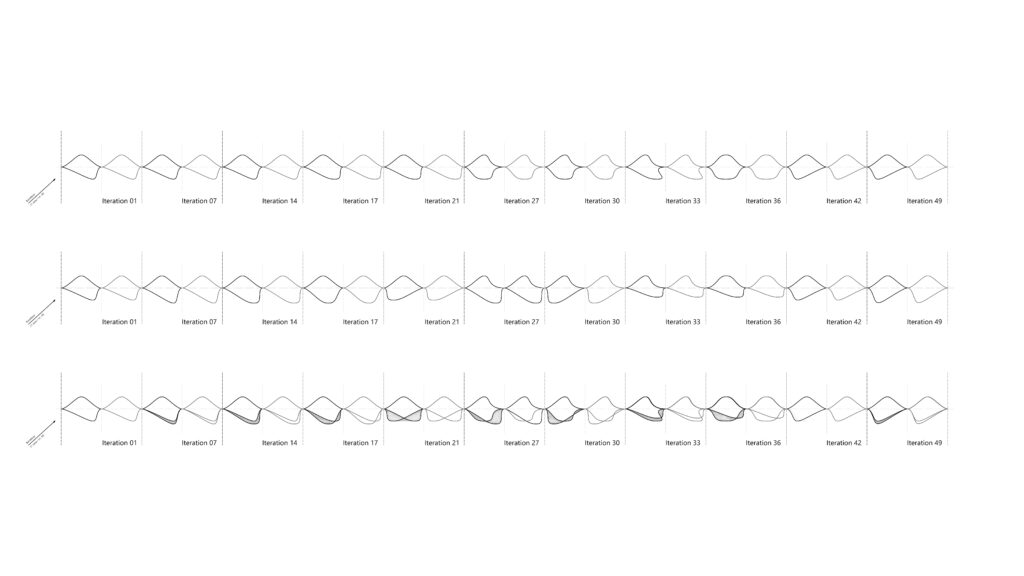
Catalogue l Geometrical Modification
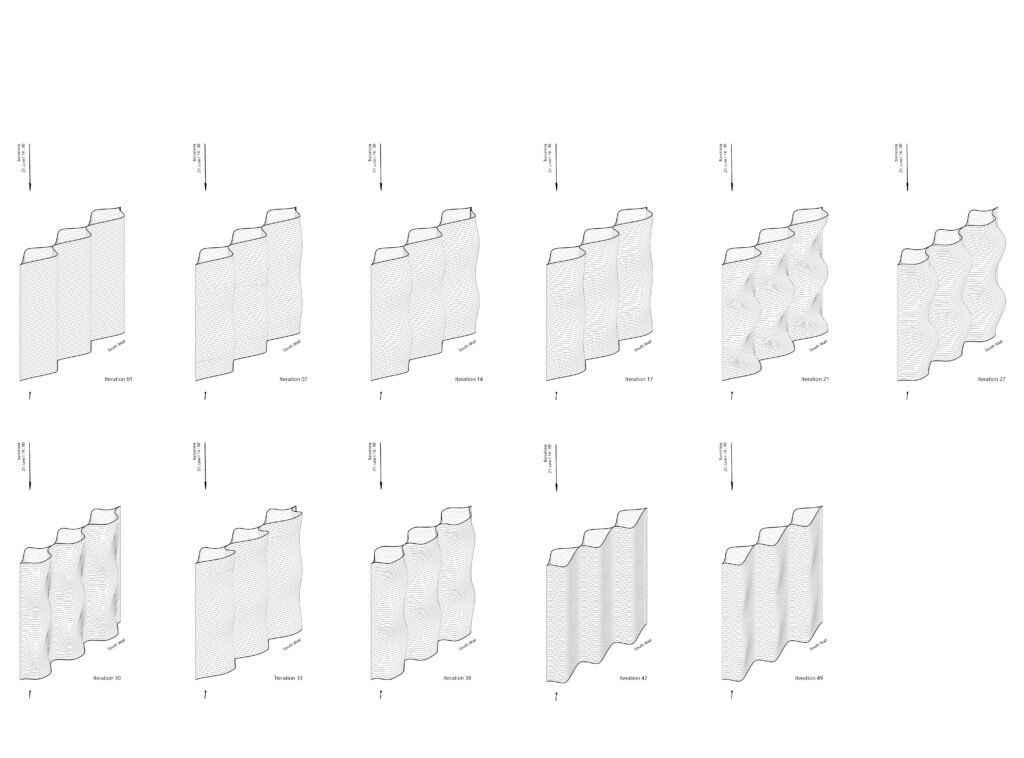
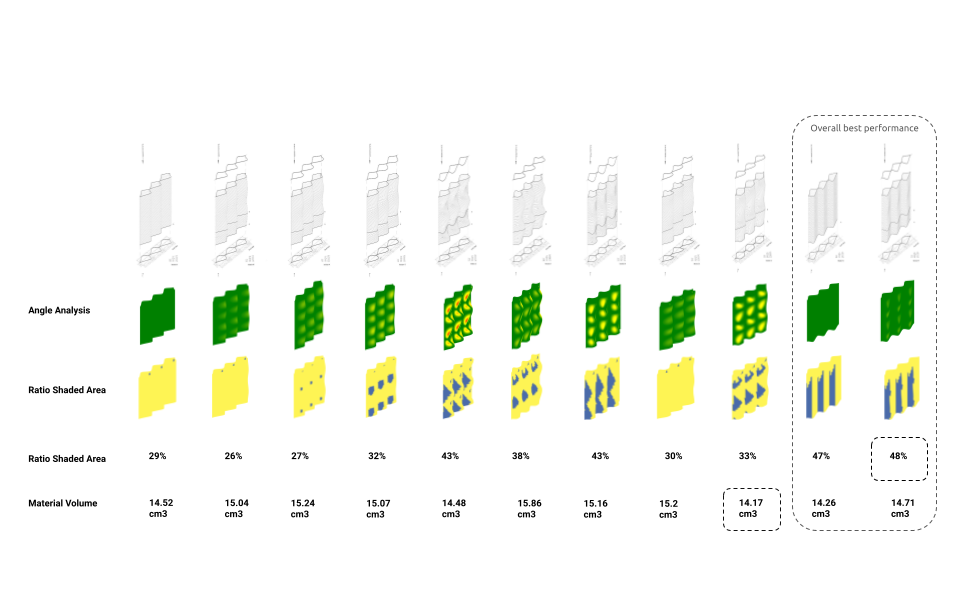
Digital Analysis
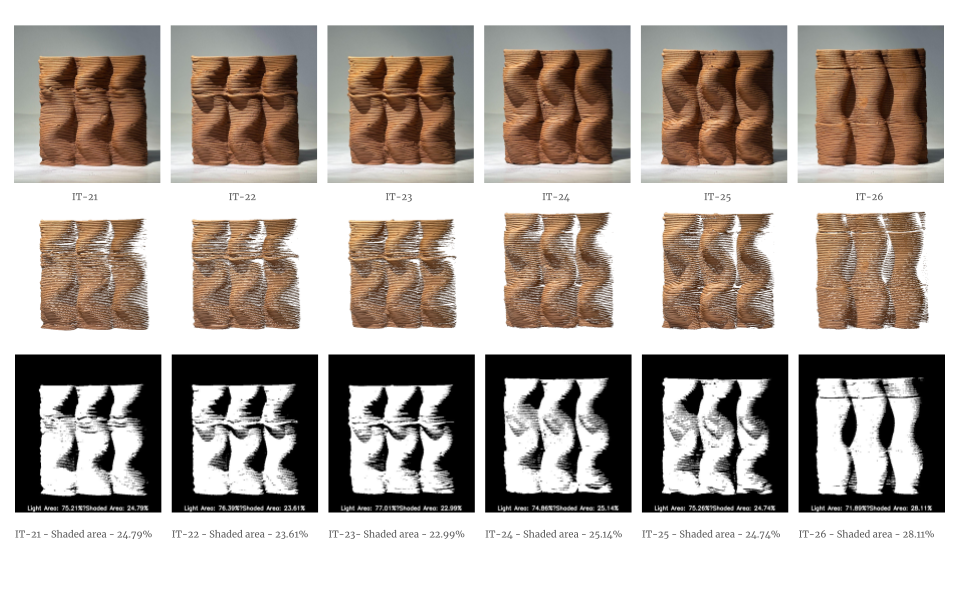
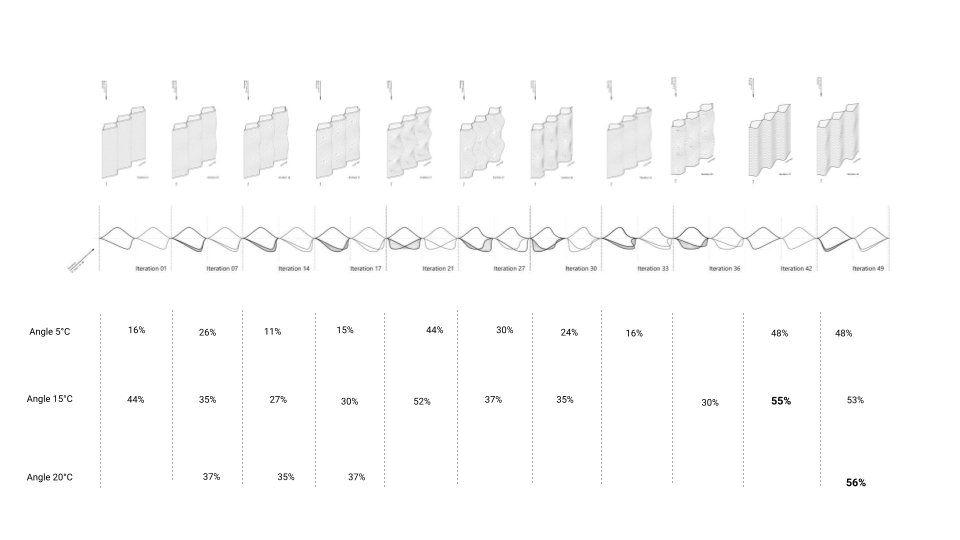
Shaded area Analysis
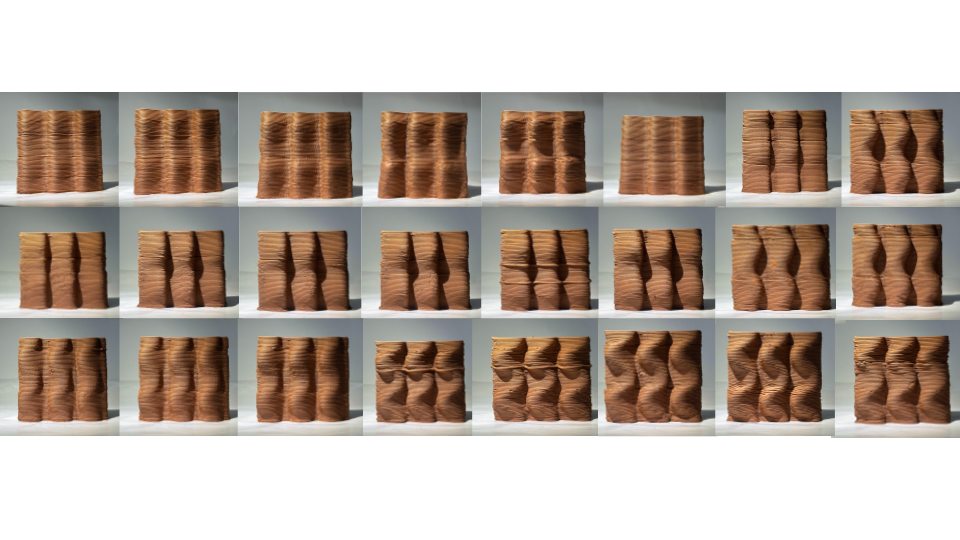
Physical Test
Physical Setup
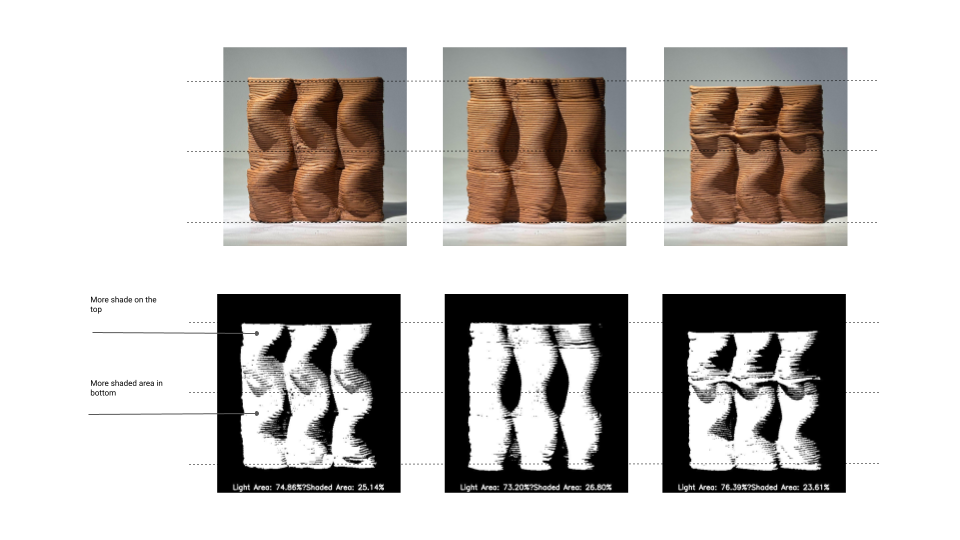
Physical set up consists of a backdrop with a light attached to it where the models could be analysed on sciography with the azimuth angle of 220° and with an altitude of 70°. This mimics the setup of the actual sun on the summer solstice on june 21 at 2pm
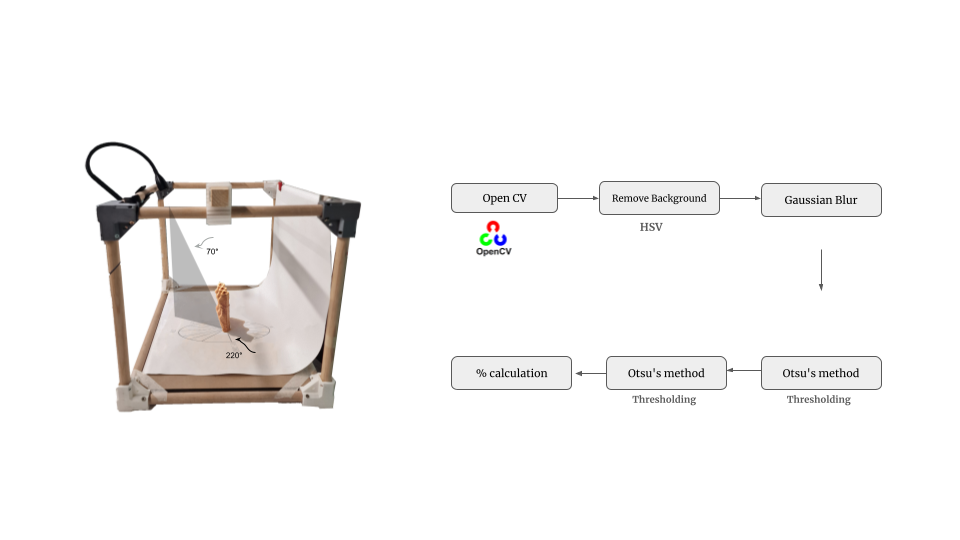
Physical Test l Shaded Area
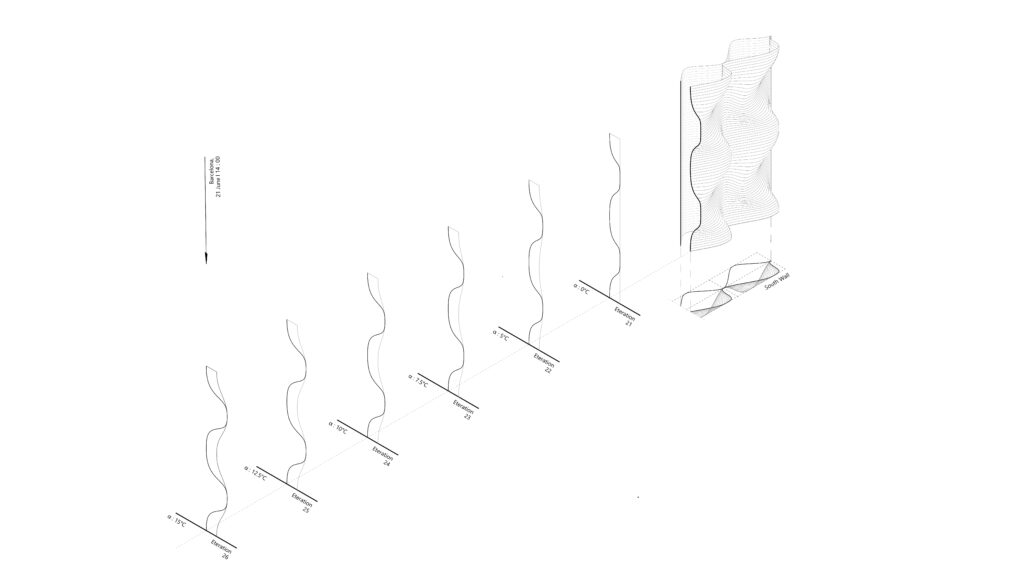
Iterations l Cantilever
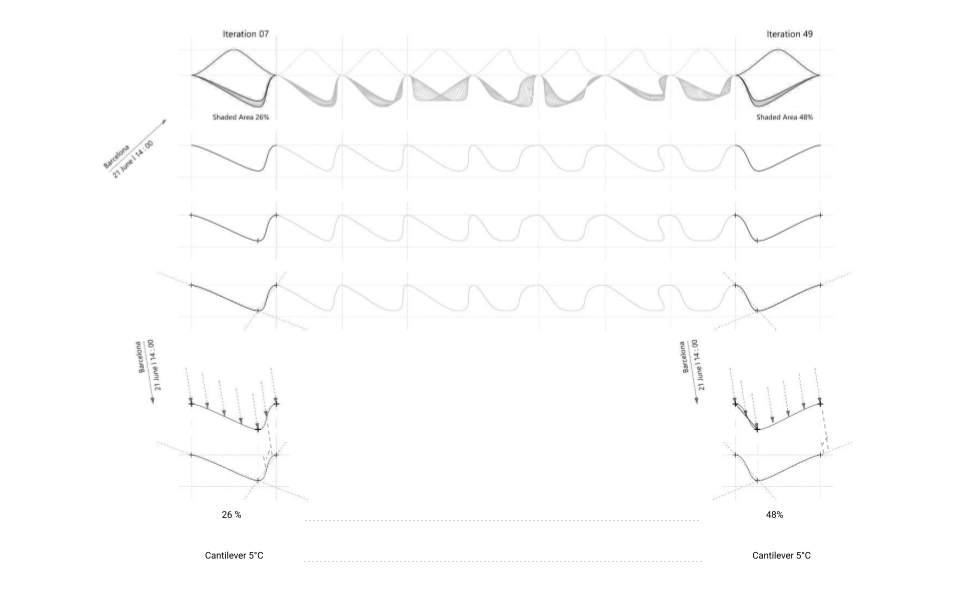
A series of overhangs and cantilevers were implemented through a series of iterations with the objective of optimising self-shading.
Iterations l Cantilever : Digital Analysis of Shaded Area
Findings l Phase 01
Tangents : An increase in the tangency surface of a wall to the vector of the sun on a specific date and time results in a reduction in the surface area exposed to solar radiation and an enhancement of self-shading
Period l Self Shading
The partitioning of the wall into periods of varying heights will result in an increased exposure to solar radiation.
Design l Phase 02
Design Concept :
South Wall
Location : Barcelona
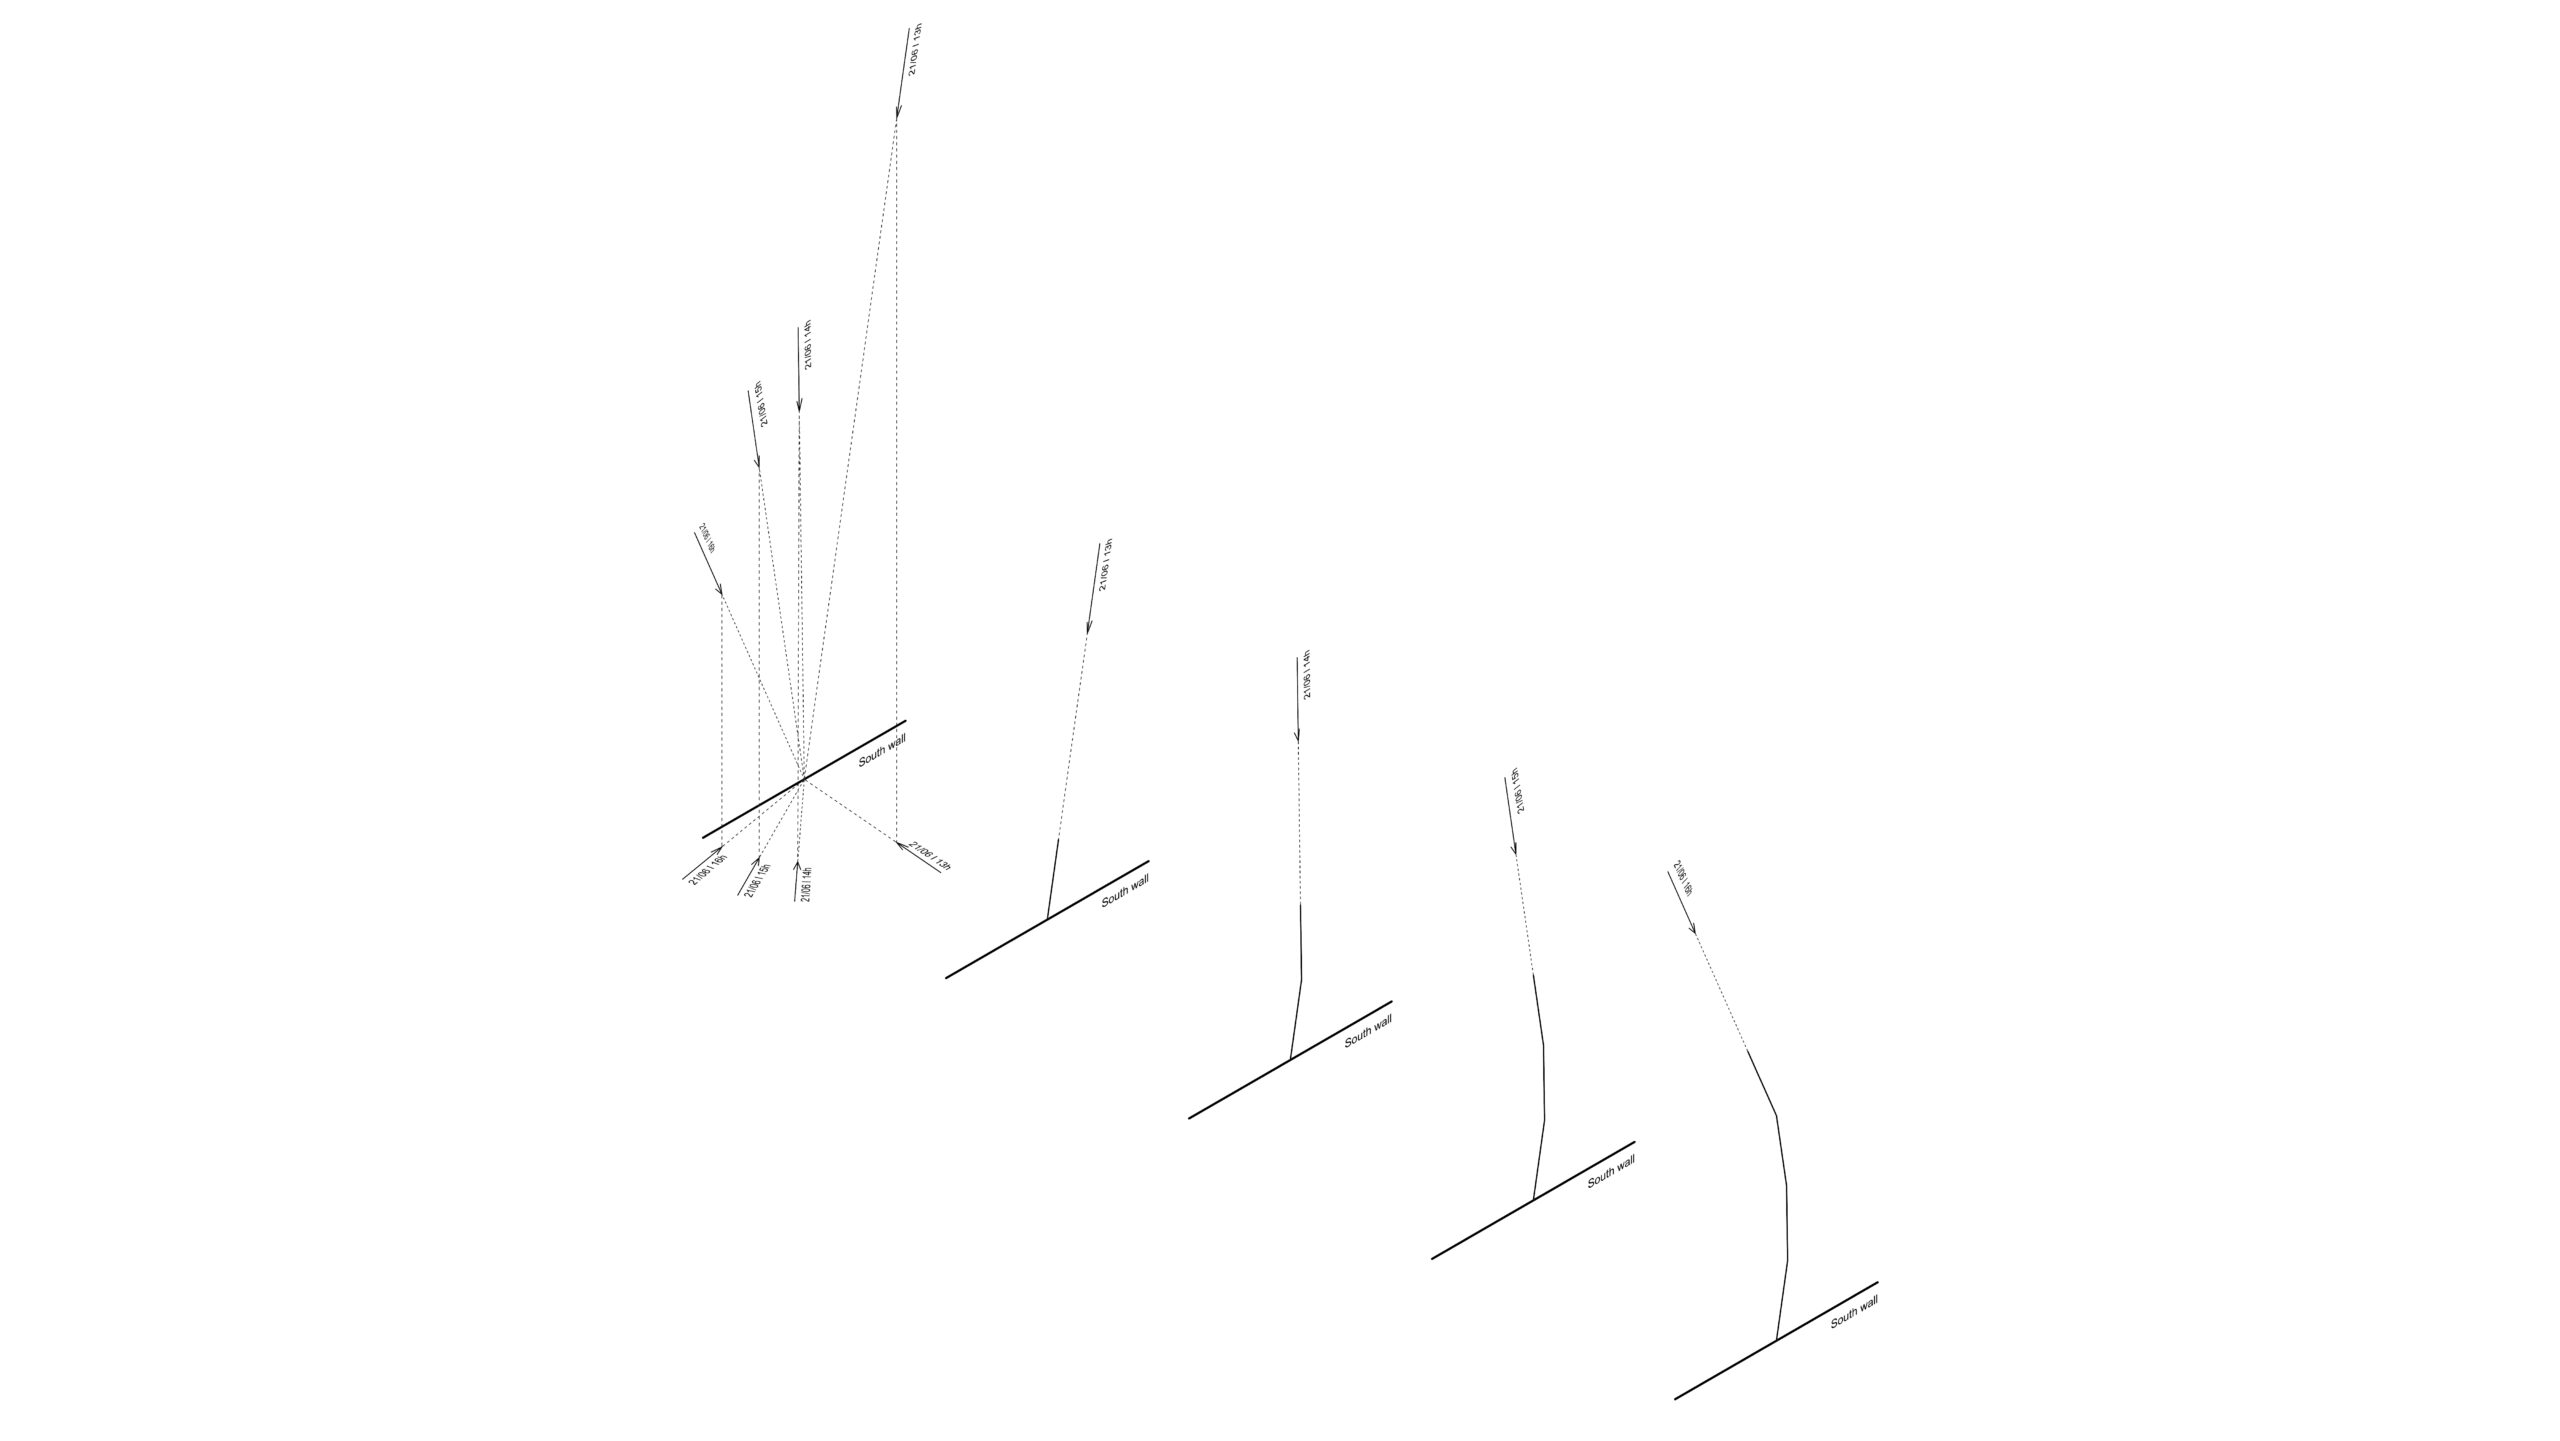
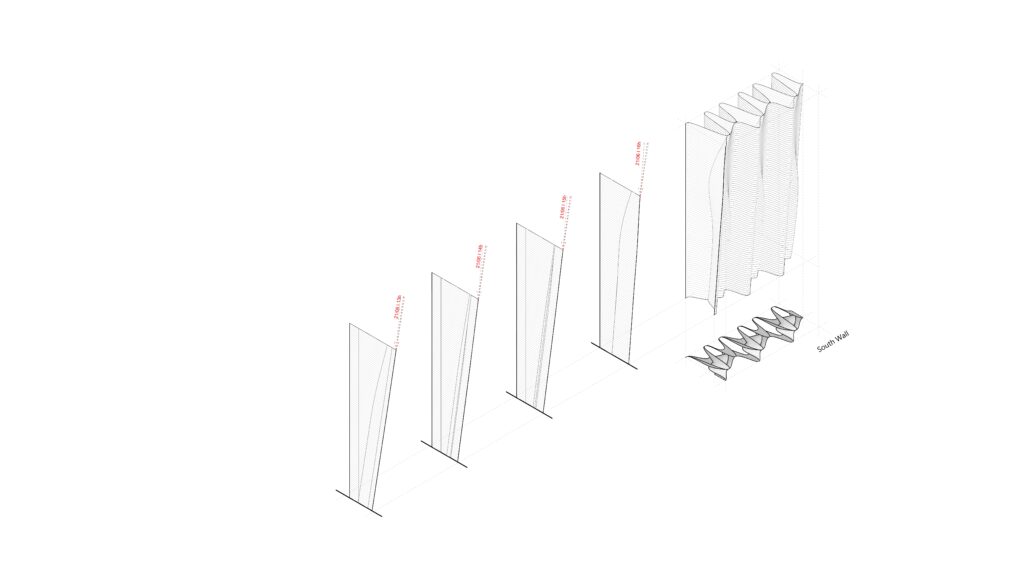
Time : 13:00 l 14:00 l 15:00 l 16:00
Date : 21 June
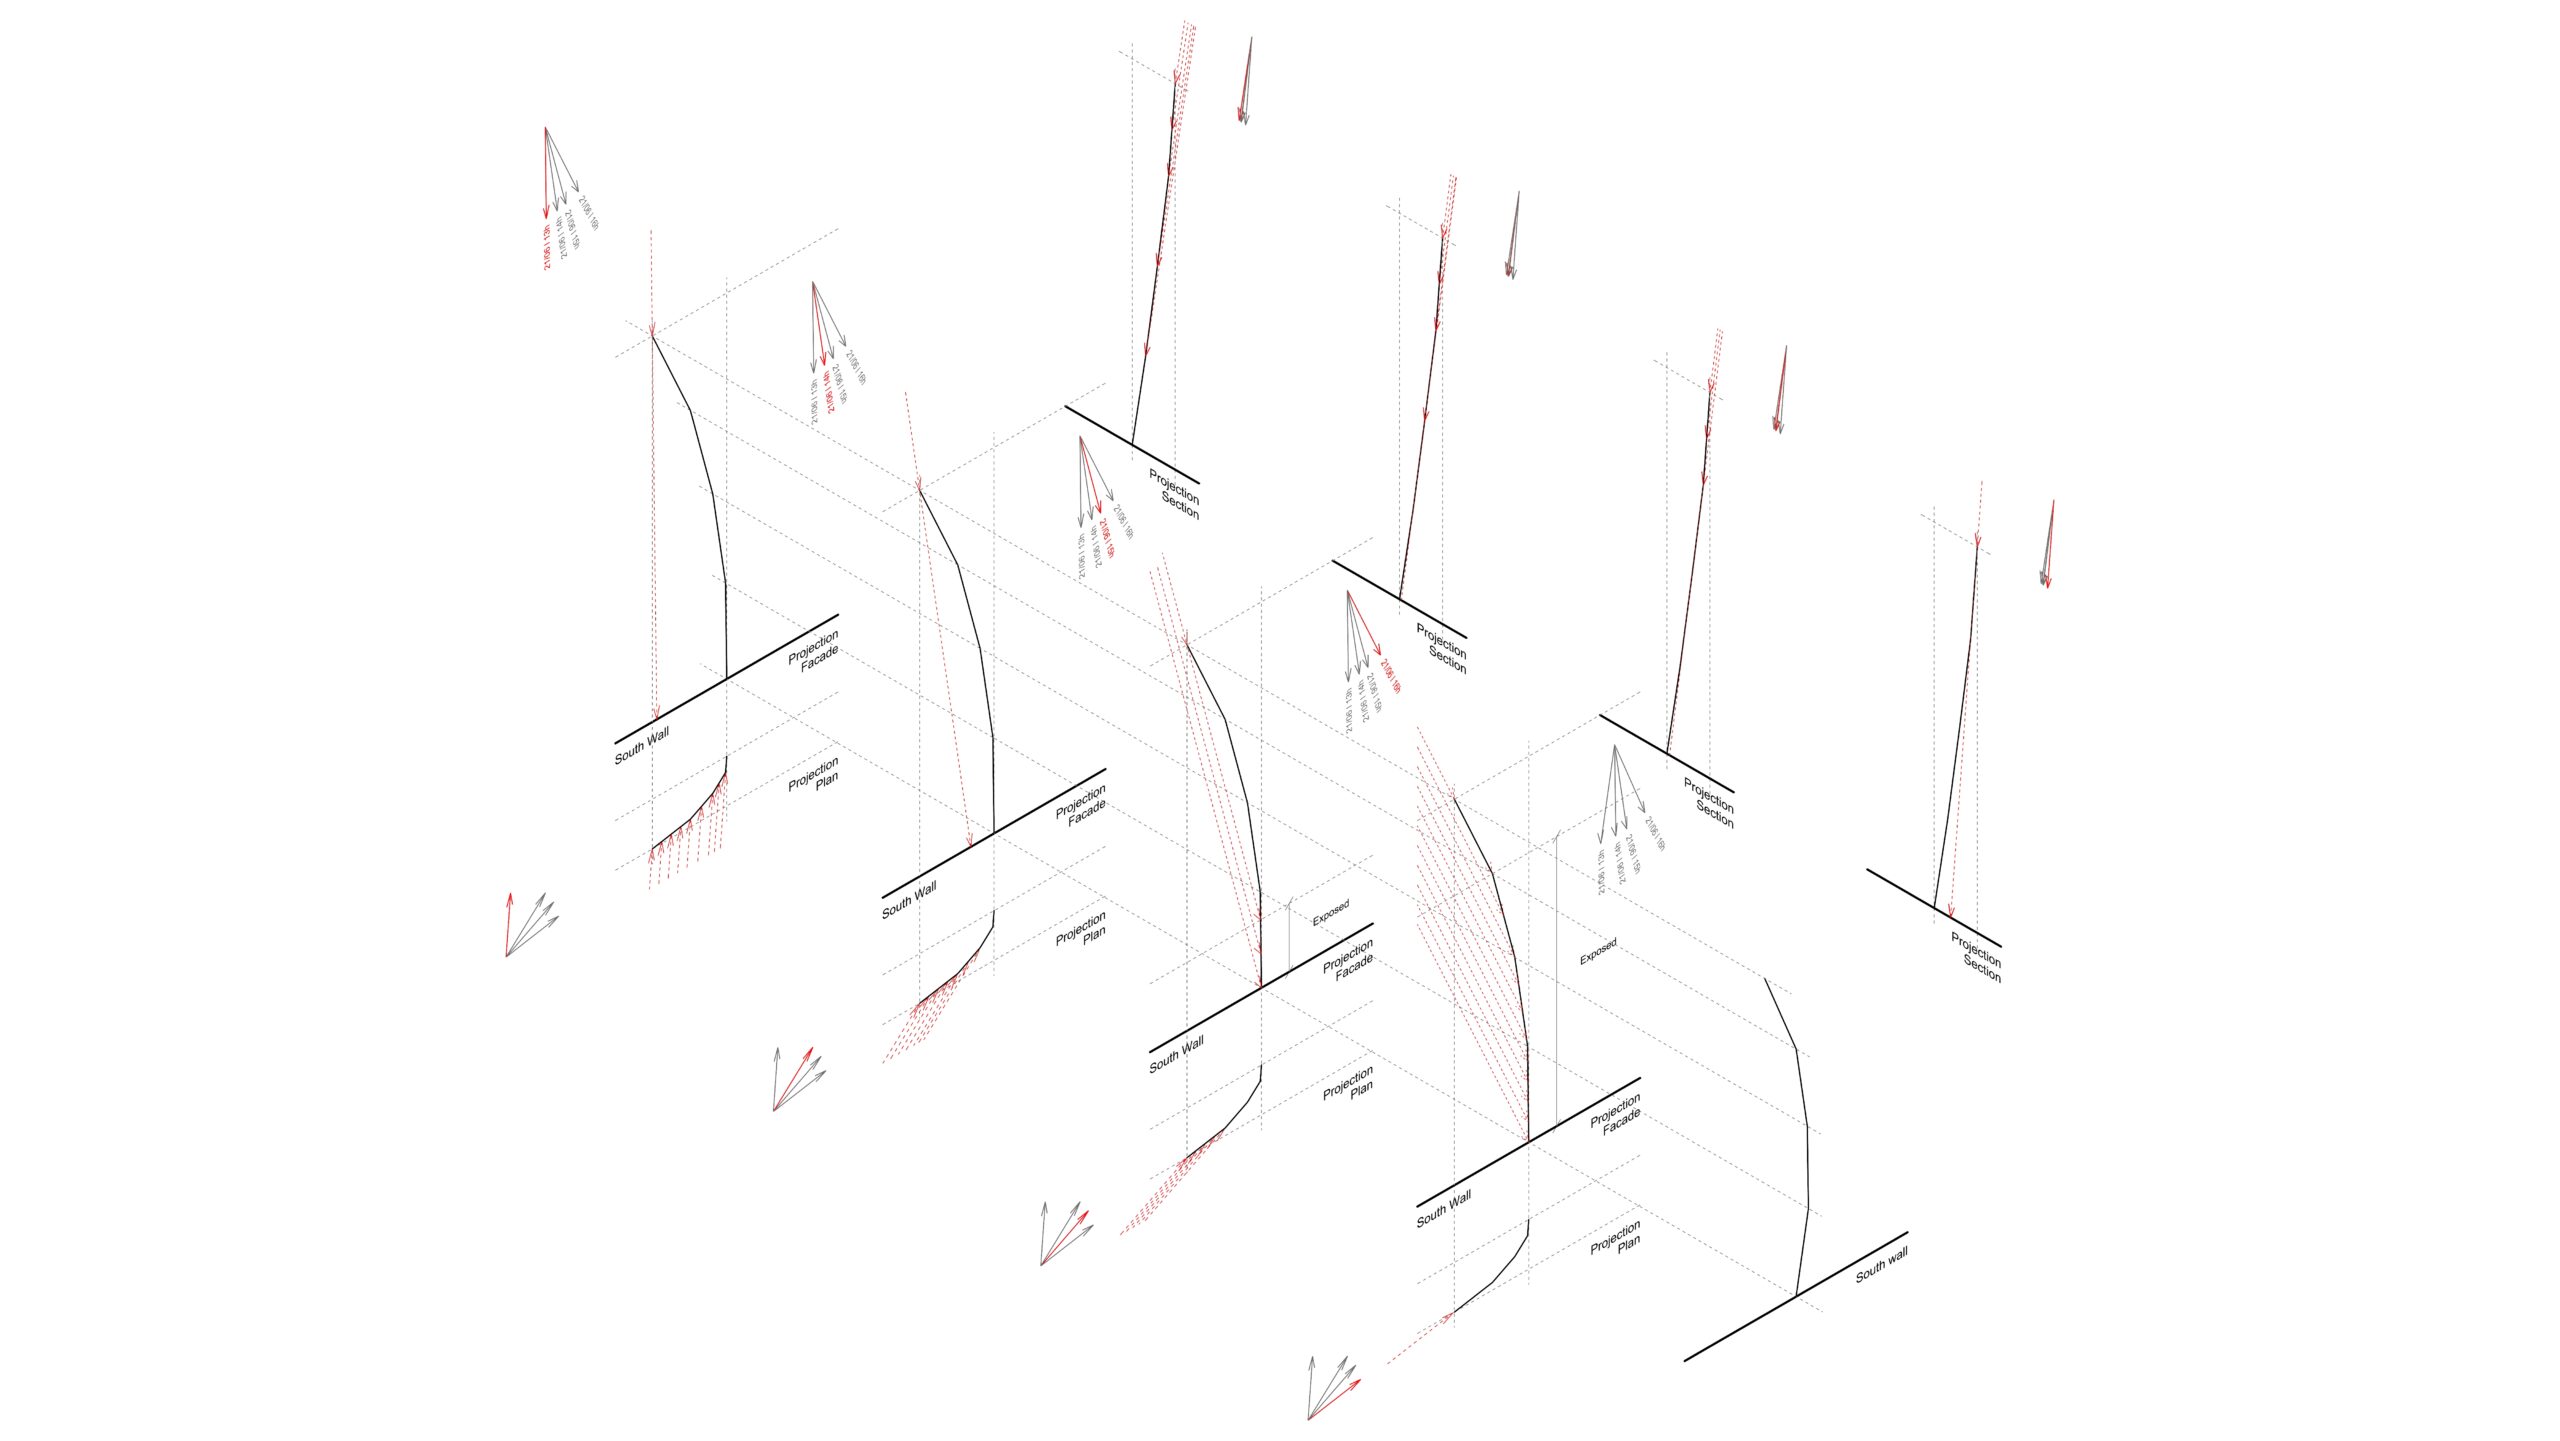
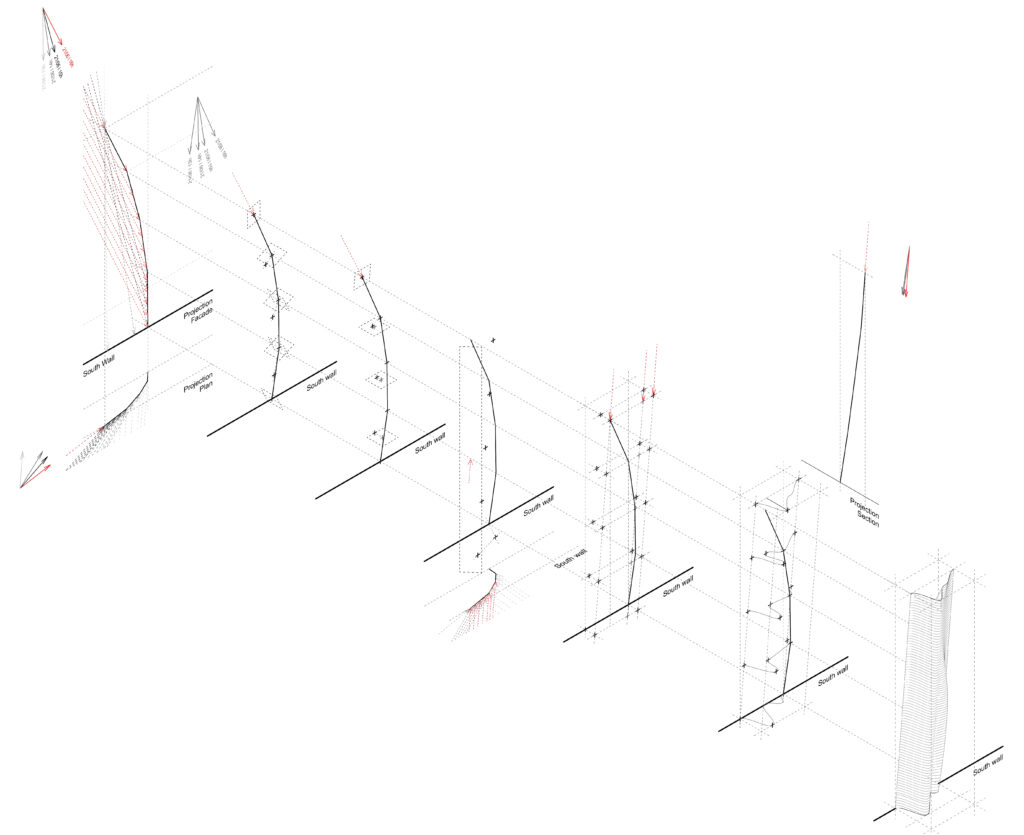
South facade l Cantilever
A series of cantilevers were generated from the tangents of the solar radiation vectors at varying times of day (13:00 / 14:00 / 15:00 / 16:00)
Printing
Mix : Pourcentage bu soil
14 % Water l 0.03 Enzyme l 0.2 sisal fiber
West Facade
The same methodology was employed in the creation of the west wall.
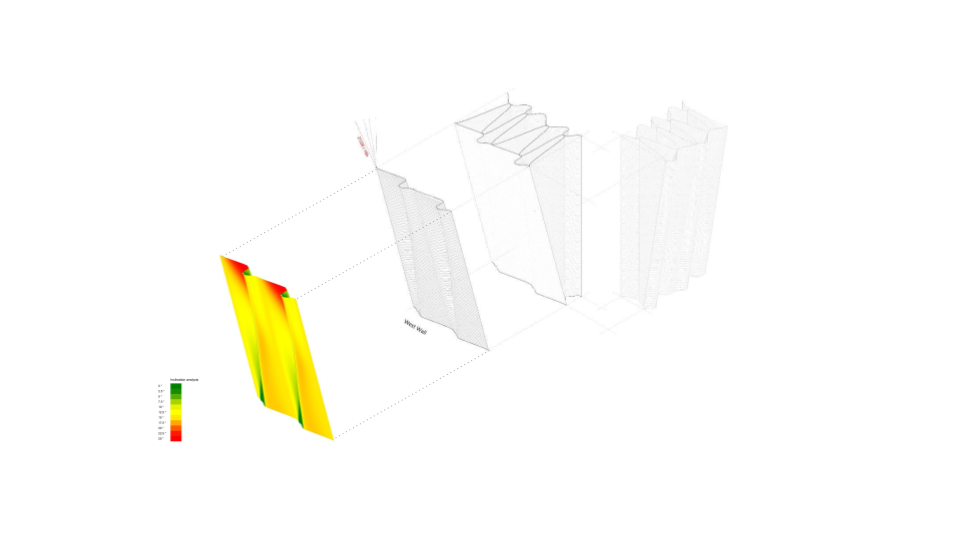
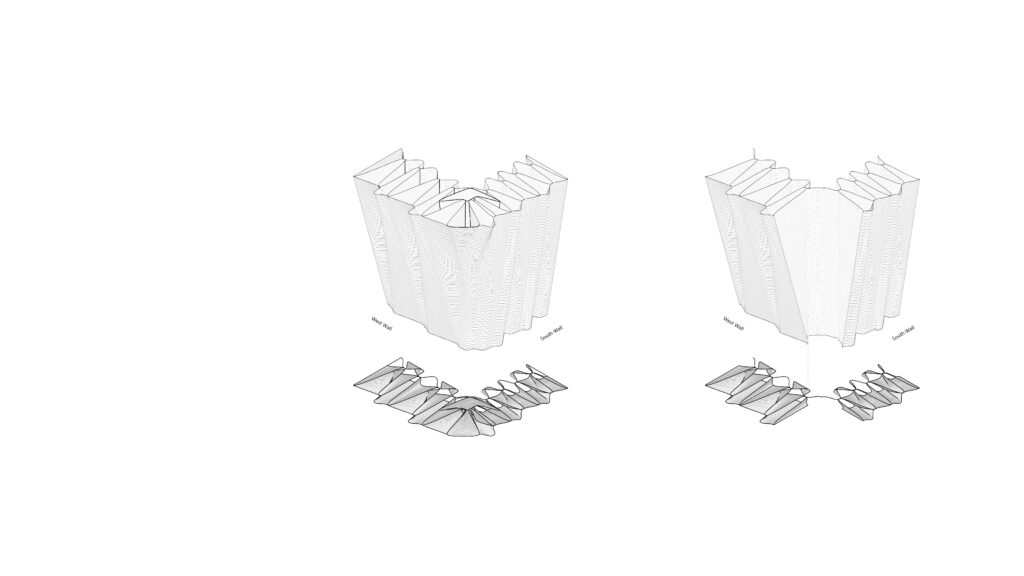
Corner l South and West Facade
The corner represents an intersection of the west and south optimised walls of self-shading.
South Wall
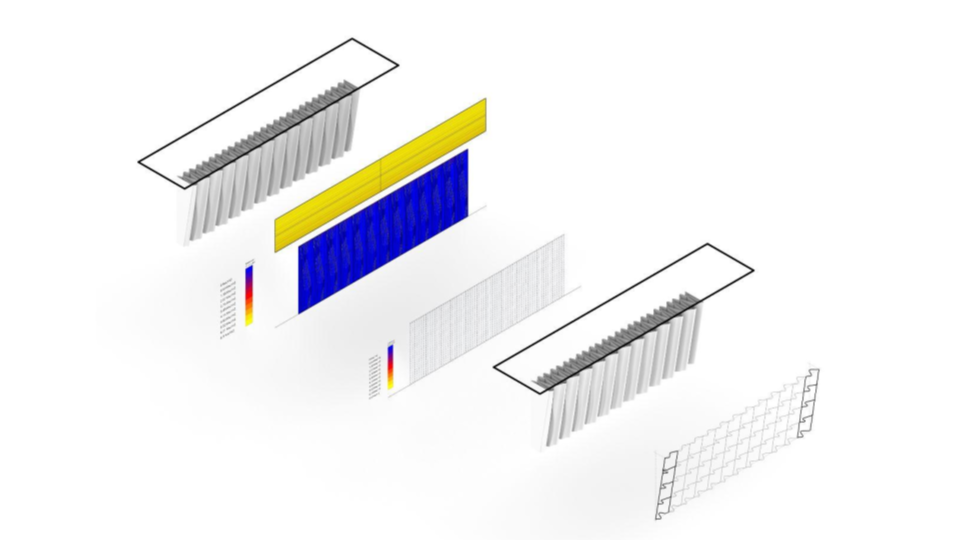
Performance Map
South Wal
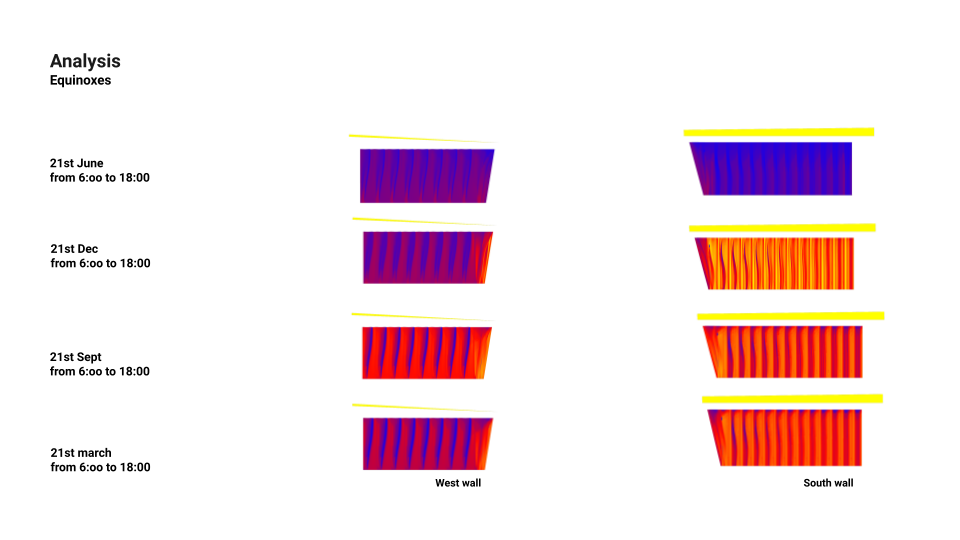
Equinoxes
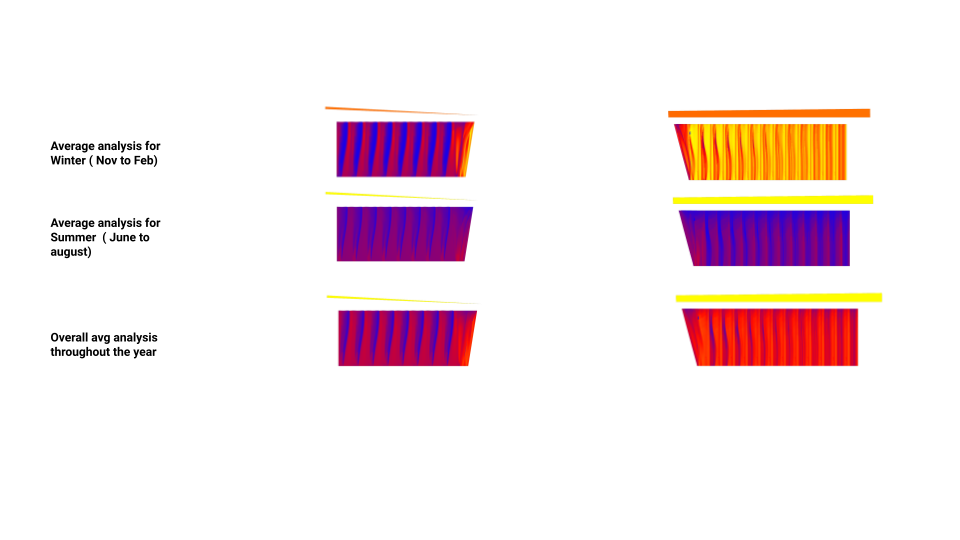
Conclusion and Further steps
The south wall design is optimised for self-shading on the 21st of June, and this could be developed further for all the other equinoxes
The development of openings in the optimised self-shading wall
Surface optimisation for weight where less material could be used

