
Jakarta’s rapid urbanization has outpaced the development of equitable mobility infrastructure, exacerbating safety disparities, particularly for low-income women navigating the city at night. While formal policies fall short, informal transport networks like Angkot fill critical gaps, despite exposing riders to physical and psychological risks. This study explores how machine learning can be used to fill the spatial-temporal data gap causing safety injustice in Jakarta by unpacking qualities of the alternative transport networks, in order to build a tool that aligns public policies with community needs through an intersectional lens in Jakarta
Spatial-temporal constraints
Despite the extensive coverage of Jakarta’s mobility network, spatial analysis reveals significant accessibility gaps within 250- and 500-meter buffer zones of transit nodes. When overlaying income and population density data, a clear disparity emerges: low-income, high-density areas experience disproportionately limited access to transportation infrastructure. This spatial mismatch exacerbates mobility inequities, particularly for marginalized communities reliant on public transit.
This spatial mismatch exacerbates mobility inequities, forcing residents, particularly those reliant on public transit, to undertake longer, inefficient trips.
However, these only represent part of a complex decision-making matrix for transport users. There are many different factors that significantly influence the choice of a particular mode of transport.
Transport in numbers
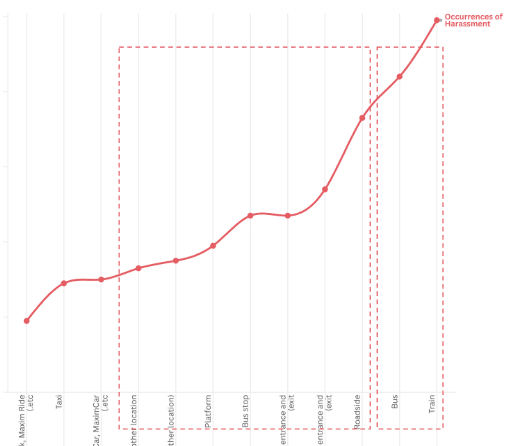
Modal choice is further shaped by intersecting factors beyond proximity: while spatial-temporal limitations drive demand for private vehicles (e.g., cars and motorcycles), a pronounced gender disparity persists, with men dominating private vehicle use and women depending disproportionately on public transport. Environmental barriers, such as Jakarta’s extreme heat, compound these challenges, as studies show pedestrians cannot tolerate walking beyond 400 meters or 5 minutes by late afternoon, rendering active mobility infeasible for most. Above all, safety concerns dictate transit accessibility, especially for women; harassment peaks after dark in vehicles and at interchange nodes—a critical temporal gap given that most public transport ceases operations by 10 PM. Together, these spatial, temporal, and social constraints create a fragmented mobility landscape where infrastructure inefficiencies, environmental stressors, and gendered risks converge to limit equitable access.
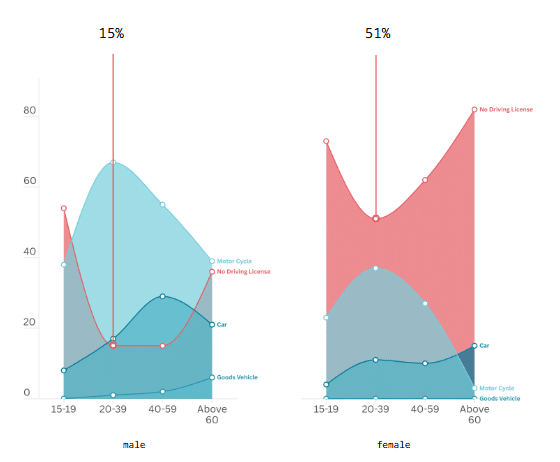
Driving license: gender share
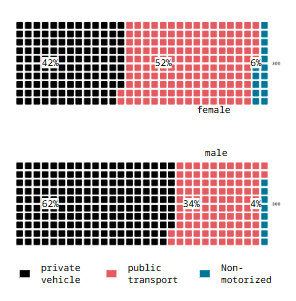
Modal split by gender
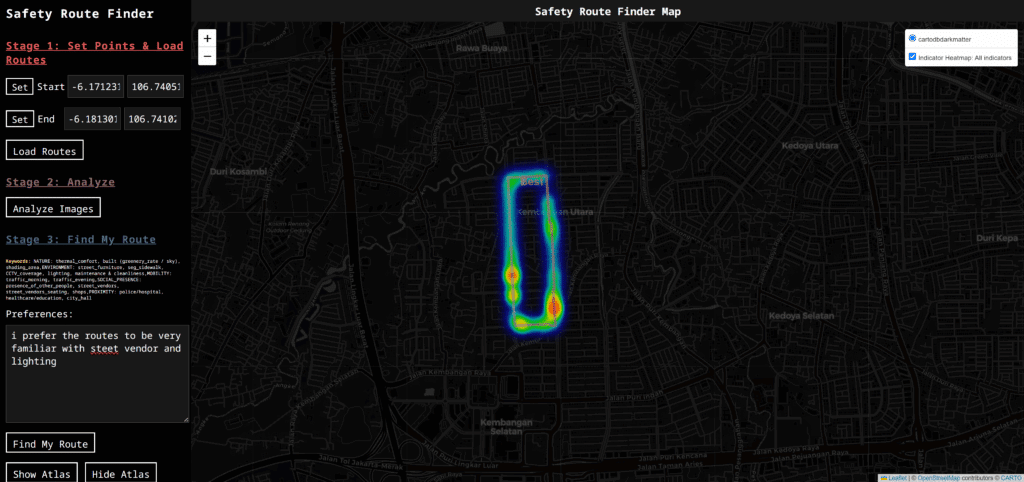
The Safety Route Finder is a web-based tool designed to help the NGOs of Jakarta coordinate with government agencies to choose the safest, most livable path between two points. Built on top of OpenRouteService and Google Street View, it automatically:
The Safety Route Finder is a web-based tool designed to help the NGOs of Jakarta coordinate with government agencies to choose the safest, most livable path between two points. Built on top of OpenRouteService and Google Street View, it automatically:
- Fetches and decodes routes for driving or walking.
- Samples key locations along each path at evenly spaced intervals.
- Downloads street-level imagery to capture the real-world environment.
- Runs an AI-powered analysis on each image—counting lighting, vendors, CCTV, pathways, furniture, cleanliness, pedestrian presence and more.
- Aggregates these counts into normalized densities, then scores each route using NGO-driven importance weights (derived from natural-language priorities via LLM).
- Visualizes both the raw routes and a heatmap overlay that highlights safety or livability hotspots, and even recommends the “best” route tailored to local needs.
- List the routes with
Under the hood, it’s a modular Python stack—FastAPI for the backend, Folium/Leaflet for mapping, and pandas/GeoPandas for data handling—so it runs entirely locally with minimal setup. Whether you’re an NGO working with city planners or coordinating with government officials, the Safety Route Finder makes route choice smarter, faster, and more transparent.
Beyond simply highlighting routes, the Safety Route Finder delivers a rich analytics dashboard for Jakarta’s NGOs and their government partners. For each route it provides:
- Indicator Counts & Densities
How many streetlights, CCTV cameras, vendors, pedestrian pathways, and other urban‐furniture elements appeared in sampled images—normalized to a 0–1 scale. - Heatmap Overlays
Spatial intensity maps showing where lighting is poorest, where informal vendor activity is densest, and where pathways lack proper markings. - User‐Driven Scoring
A transparent, weighted scoring model (0–5) that translates NGO priorities—like increased street lighting or safer pedestrian crossings—into a single “safety score” per route. - Time‐of‐Day Comparisons
(Planned) Split analytics for day vs. night to reveal temporal safety gaps that disproportionately affect low‐income women traveling after dark.
Conclusion
Jakarta’s explosive growth has outstripped its mobility infrastructure, leaving vulnerable communities—especially low-income women—facing unsafe, inefficient journeys after sundown. Traditional data sources and formal policies rarely capture the lived realities of informal transport networks like Angkot, who bridge critical gaps but often at great personal risk to riders.
The Safety Route Finder uses machine-learning–driven computer vision and natural-language preferences to close this spatial-temporal data divide. By unpacking the real-world qualities of alternative transport corridors and transforming them into actionable maps, indicators, and scores, the tool empowers NGOs and government agencies to align public policy with community needs through an intersectional lens.
There is no escape but to advocate for safer and more equitable mobility. With this platform, Jakarta’s advocates now have the data-backed insights they need to demand change—ensuring every journey through the city is not only possible, but also dignified and secure.
