
Introduction — Where My Interest Began
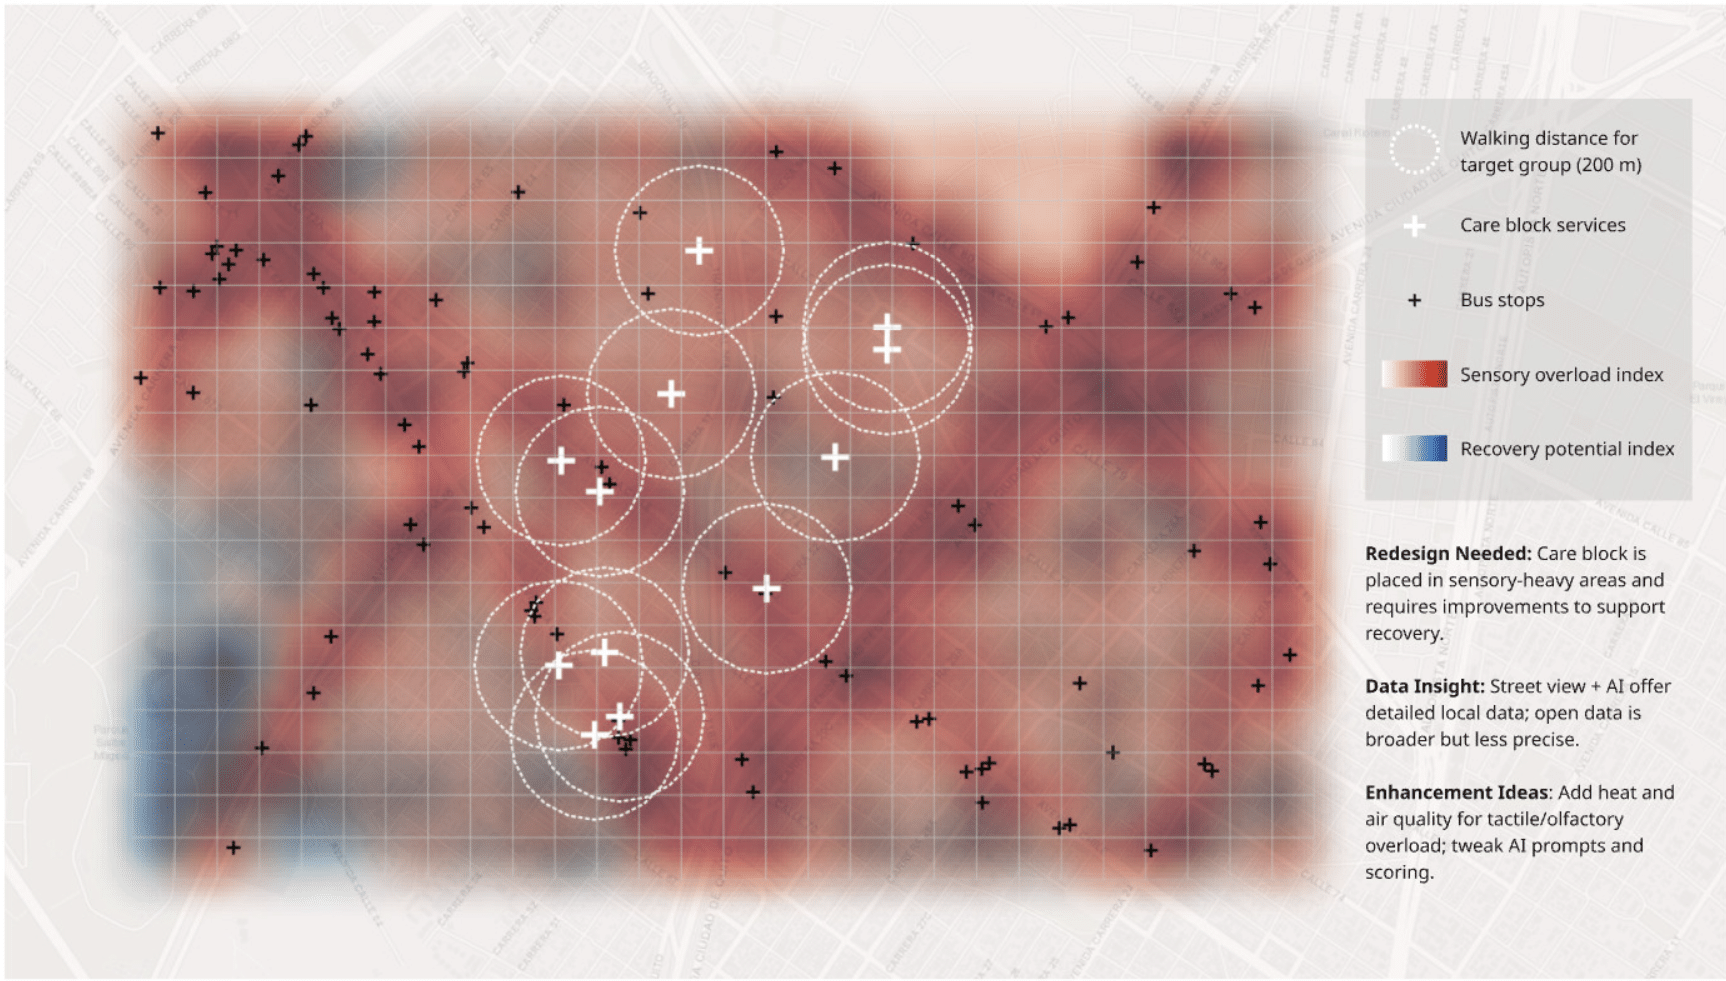
My interest in AI and its application in the AEC industry started before this course. During the IAAC GSS, I worked on a study in Bogotá using GIS and image‑recognition tools to map sensory criticality in care-focused urban zones.
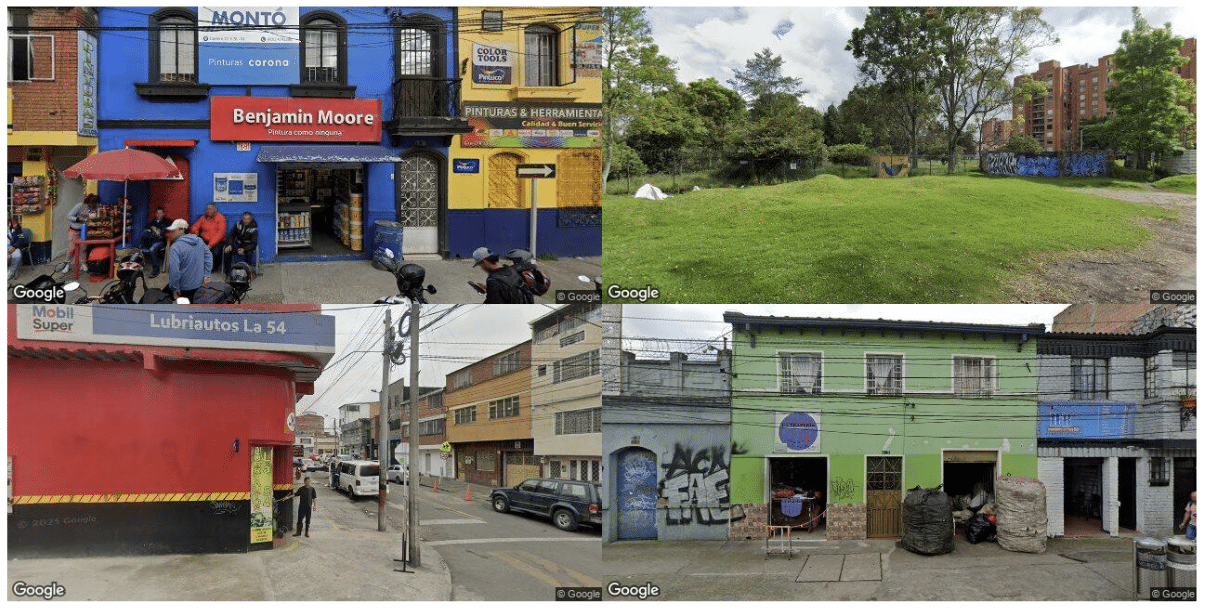
What surprised me most was how accessible the process was. I didn’t need to travel to Bogotá or collect photos manually. With a simple script, I could download a grid of street‑level images and analyse entire neighbourhoods in few hours. That moment showed me the real potential of technology: AI can reveal patterns we often miss and scale our understanding of cities in ways that would be impossible through manual observation.
What I Learned During the Course — Risks and Opportunities
The course helped me see AI in a more balanced way. Each speaker added a different perspective.
On one hand, Andrea Paindelli, Libny Pacheco, and Wen Sang demonstrated how AI can speed up analysis, highlight hidden issues, and free us from repetitive tasks.
On the other hand, Luca Belli -AI Safety Lead at Spring Health- explained how AI inherits the biases of its training data. If we don’t question the data behind our tools, we risk reinforcing the same inequalities already present in our cities.
Together, these lessons gave me a clearer understanding: AI is powerful, but not neutral.
Looking Back — What I Would Do Differently
After the course, I realised that the prompt I used for the Bogotá study wasn’t as robust as I initially thought. Asking the AI to “give a score from 0 to 10 to visual clutter” produced results that were inevitably subjective and opened the door to biases.
A more rigorous approach would be to break the problem into measurable indicators — for example, the number of overlapping signs, presence of flashing lights, density of people, availability of resting zones, and other environmental factors that contribute to sensory load.
From these indicators, I could construct a composite score using weights informed by surveys or interviews with people who have sensory sensitivities. This would make the method more transparent, accurate, and grounded in lived experience.
This reflection also helped me understand that while technology can accelerate the process, inclusive design requires the input of diverse groups of people. Without that, we risk reinforcing the very inequities we aim to challenge.
Conclusion
I now see AI as one part of a larger process. It can help us see more, understand more, and design with more empathy — but only if we use it with intention and include the people we aim to support.
