
The Problem
No single source of truth for KPIs
In our studio workflow, KPIs are everywhere and nowhere at the same time. Each team tracks performance in its own way—some in Grasshopper scripts, some in spreadsheets, some buried inside models—and none of these sources fully agree with each other. Because updates are slow and fragile, even small design changes can break the logic, leaving us unsure whether the numbers we’re looking at are accurate or outdated.
This creates a surprisingly big ripple effect. Decisions get made on inconsistent metrics. Teams spend time double‑checking or recalculating values instead of designing. Reviewers struggle to understand how performance has evolved because there’s no reliable history. And since everything depends on the specific Grasshopper setup used to generate the model, the whole process feels brittle and hard to scale.
Proposed Solution
Automated KPIs engine
We developed an automated KPI engine that takes over the heavy lifting. The model still comes from Grasshopper—nothing changes there—but once it’s committed to Speckle, the pipeline steps in. It reads the model, checks that the geometry and metadata are complete, and computes a full set of standardised metrics.
The core idea is to create a unified KPI model: a clean Speckle stream that publishes simplified geometry and consistent metrics in one place. The backend is independent, structured, and tested, so it stays stable even if modelling workflows shift over time. And because the pipeline runs automatically on every commit, the KPIs update in real time. No manual recalculation, no chasing missing data, no guessing which version is “the right one.”
Target Users
Who Benefits
Design teams get immediate, reliable feedback on the models they produce, without having to maintain fragile scripts or run extra calculations. Reviewers and faculty gain access to a clean, consistent KPI layer that helps them understand how the project is developing, even if they never open the model itself.
Automation
Data In / Data Out
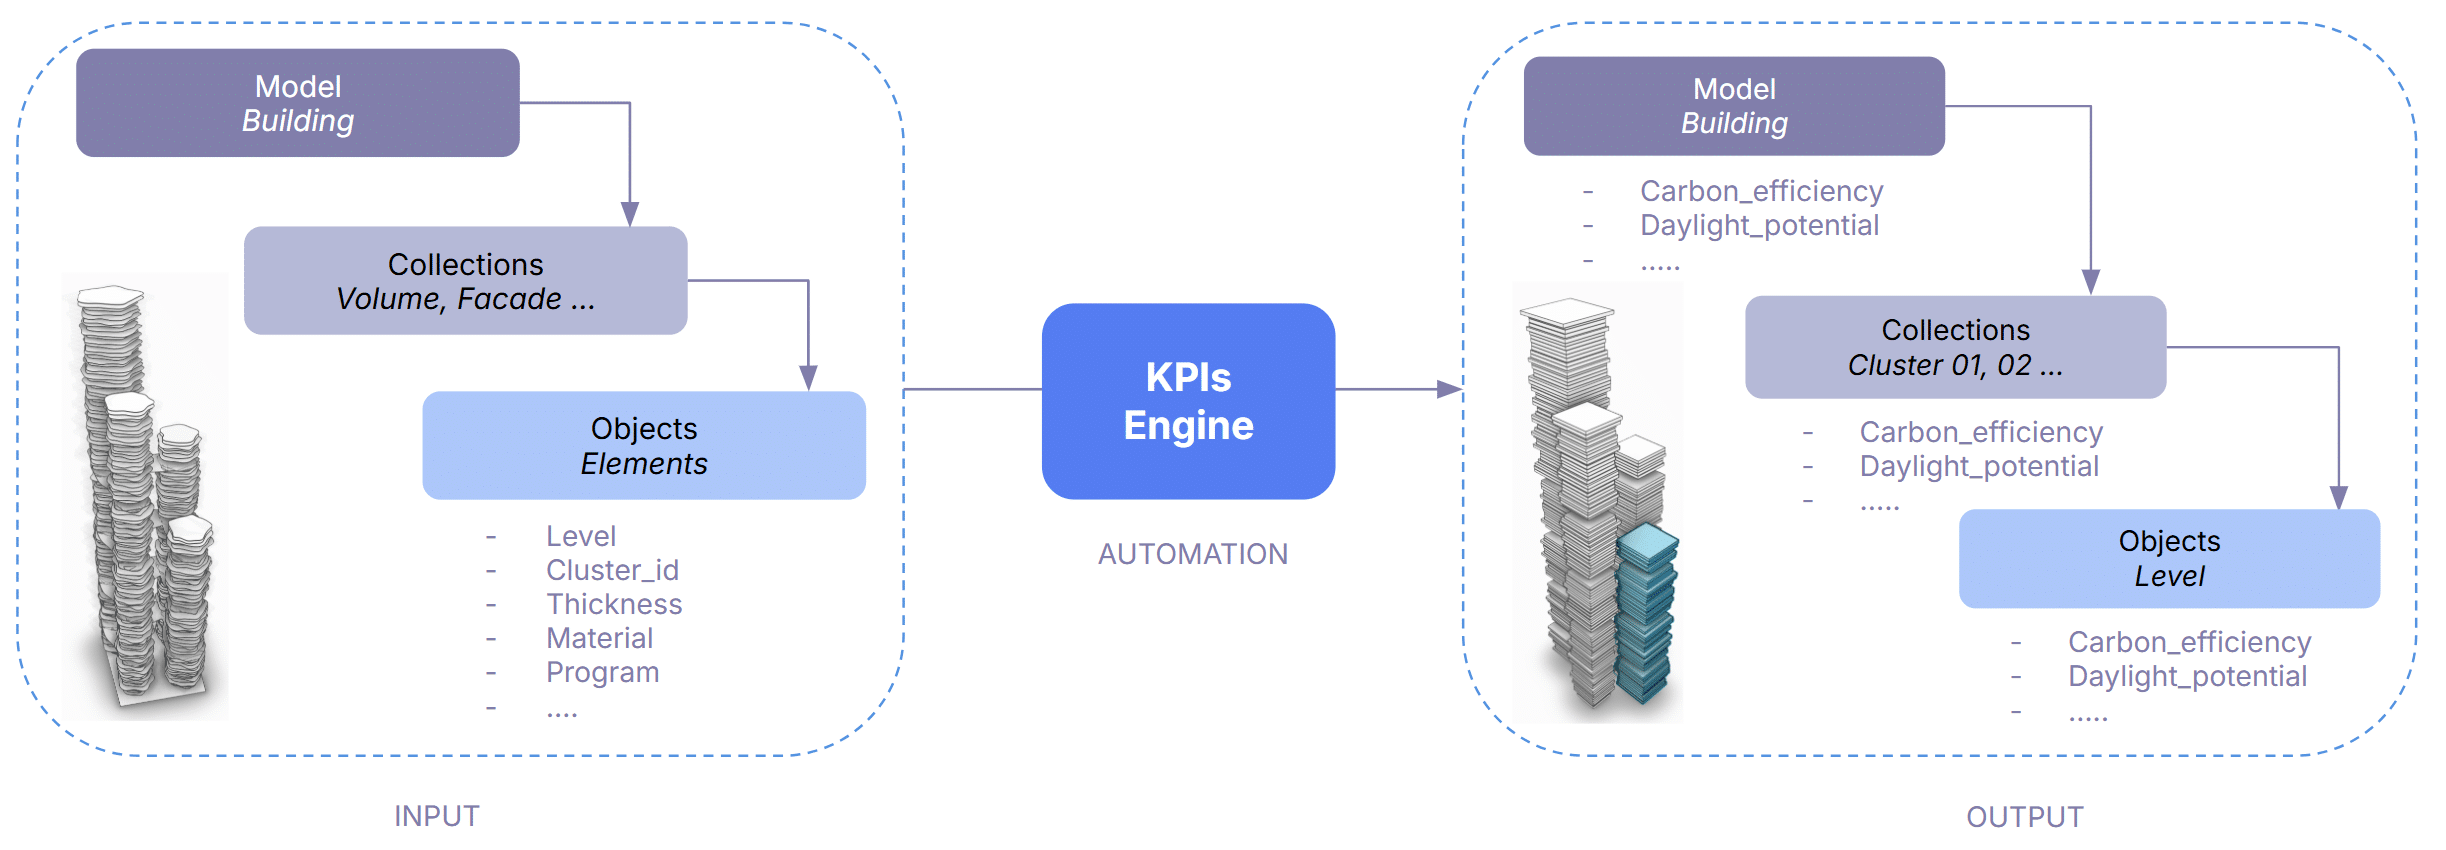
The model structure is changed in 3 ways:
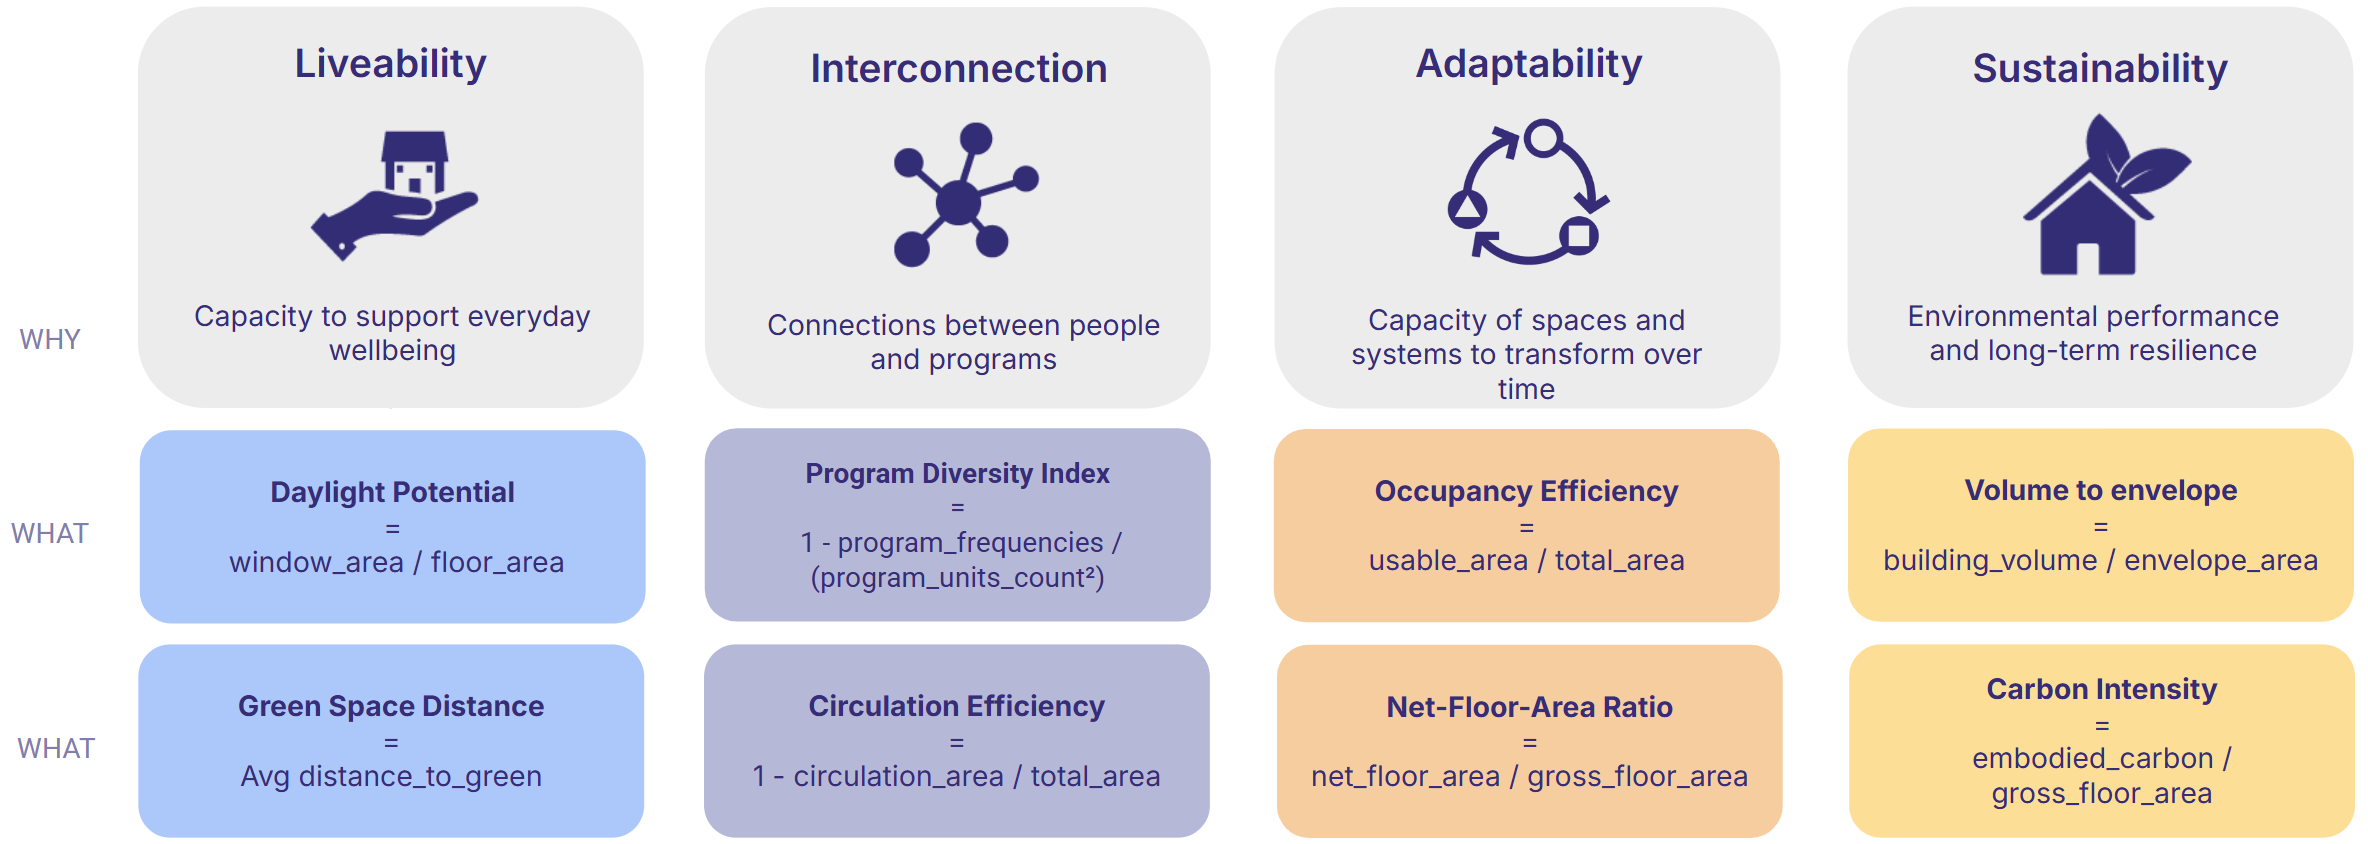
- metadata are used to derive all metrics – at project, collection and object layer
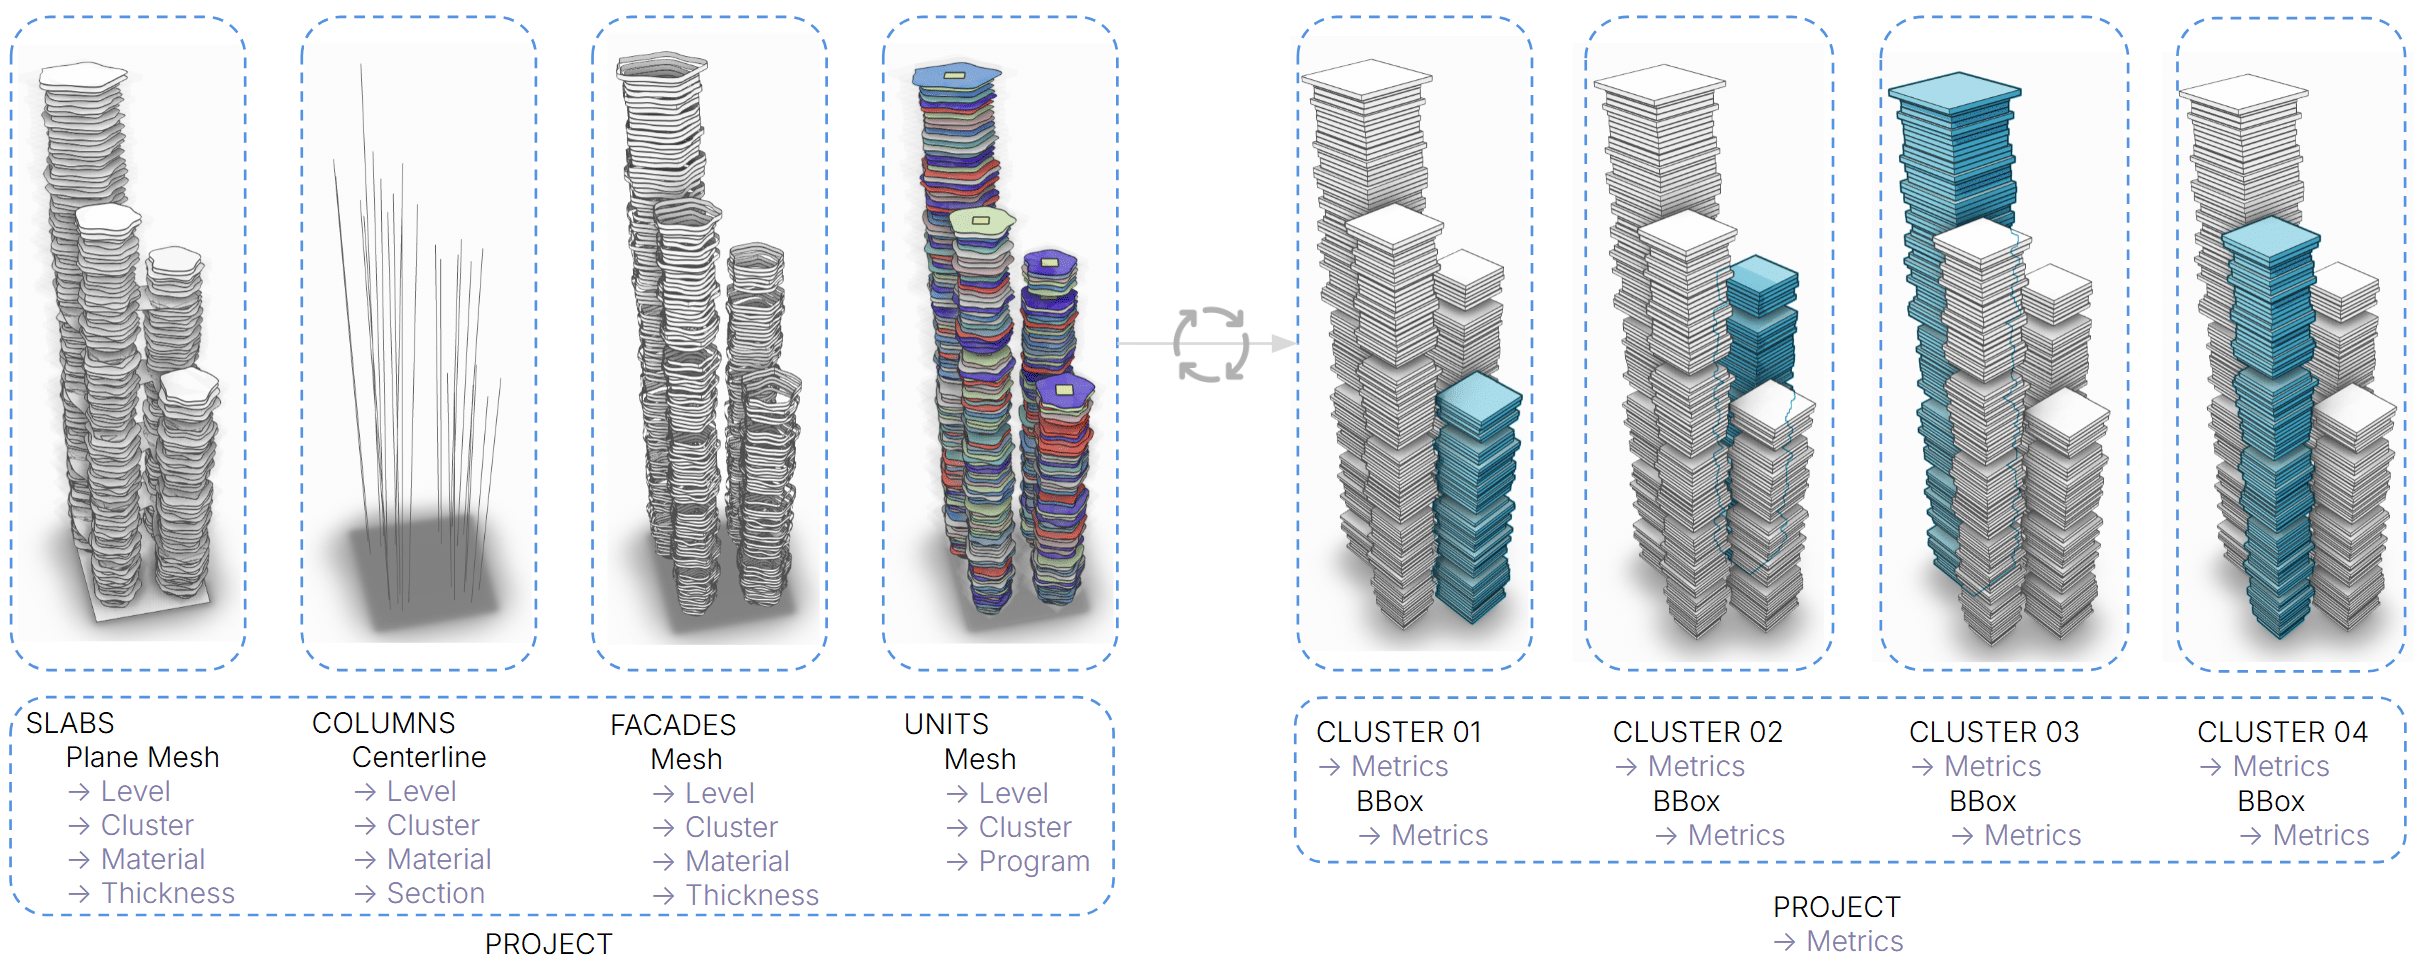
- collections by element type are converted into collections by cluster (tower)
- the geometry is simplified in a box per level for ensuring speed
How it works
Automation Workflow
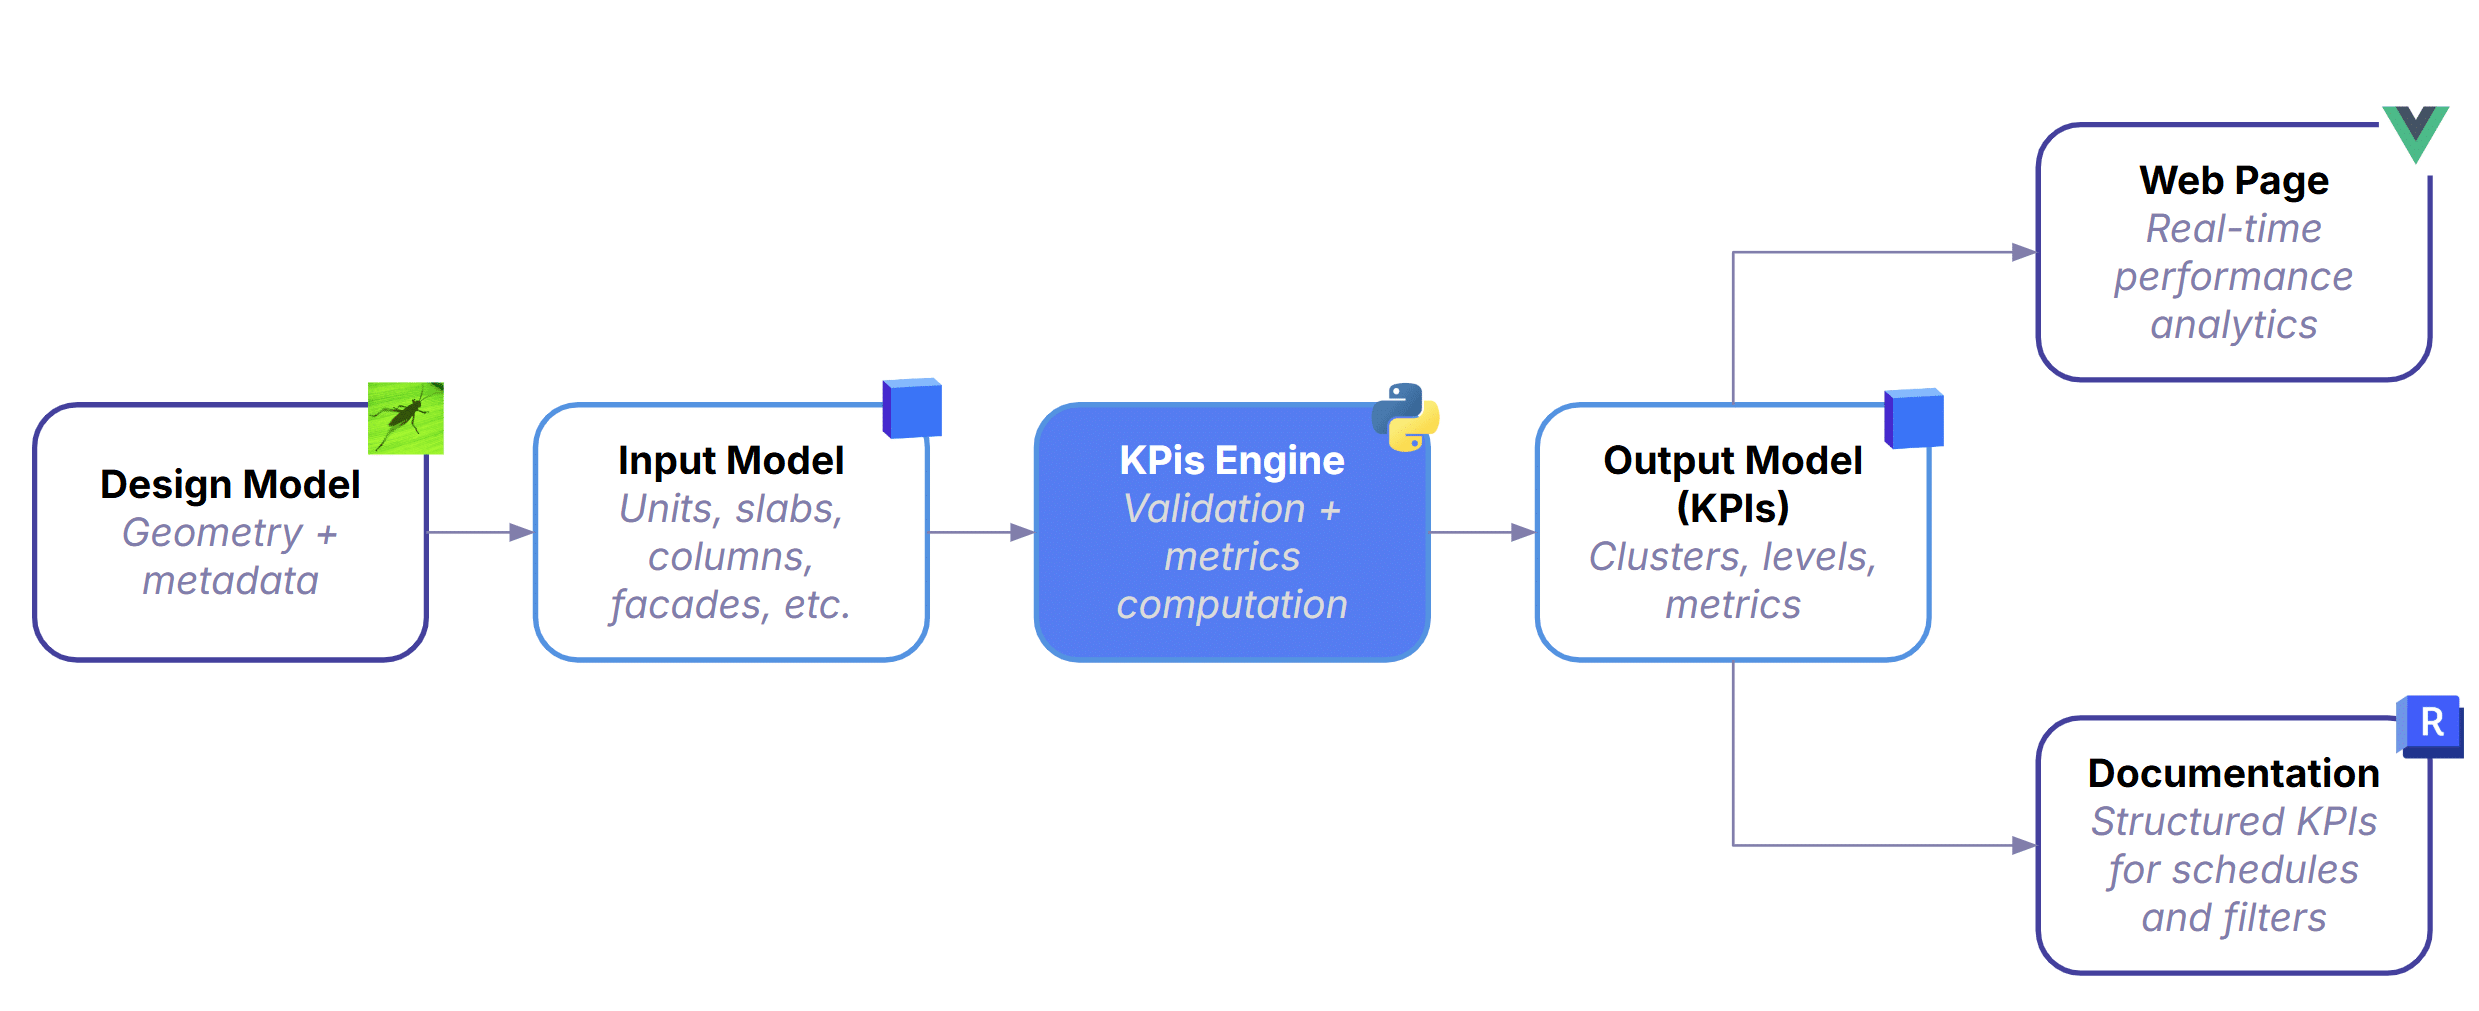
Input Model: Everything begins with the design model—geometry plus metadata for units, slabs, columns, façades, and everything else built in Grasshopper -or other design tool.
The Core Engine: It validates the model to ensure completeness and correct metadata, then computes standardized KPIs across clusters, levels, and the full project. This is where automation replaces manual scripts—every version is processed with the same logic, guaranteeing consistency regardless of how the Grasshopper definition was built.
The Output: After processing, the pipeline produces a lightweight KPI model containing simplified geometry, clusters, levels, and all computed metrics. It’s intentionally minimal so downstream tools can query and visualize it without friction.
Where data Goes: From there, the data branches into two outputs:
- Documentation — Structured KPIs flow directly into schedules and sheets, keeping documentation aligned with the latest model.
- Web Page — A real‑time 3D viewer and metrics charts view that updates automatically on every commit.
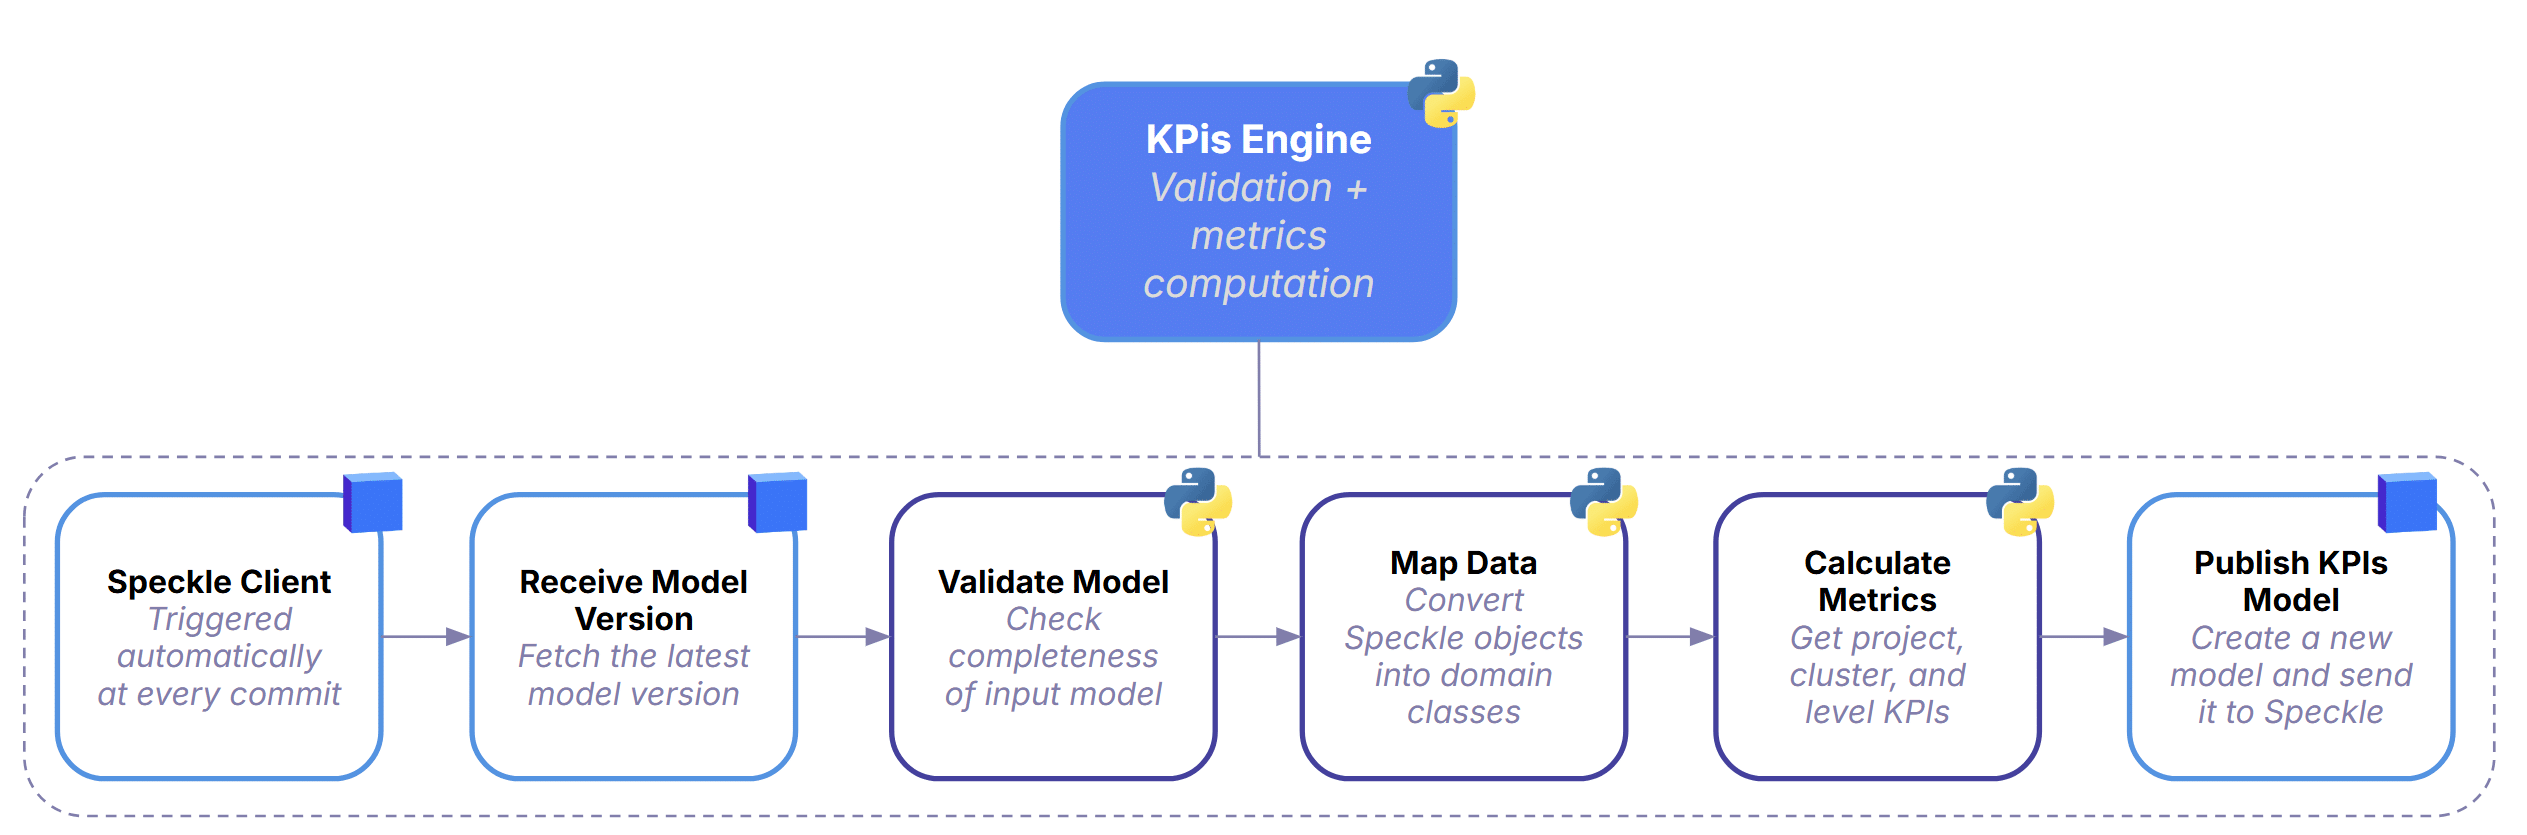
Runtime Pipeline
Every time a designer commits a new model version, the system automatically picks it up and starts a full KPI computation cycle.
It first retrieves the latest model from Speckle, then runs a validation step to check whether the geometry and metadata are complete enough for analysis. Once the model passes these checks, the data is mapped into structured domain classes so the backend can work with it reliably.
With the data cleaned and organized, the KPIs Engine computes all required metrics at project, cluster, and level scale using a consistent, repeatable logic. When the calculations are done, the pipeline publishes a fresh KPI model back to Speckle—essentially a clean, standardized dataset that downstream tools can read instantly.
The whole process runs in a straight, automated chain, ensuring that every version of the design is processed the same way.
Architecture & Components
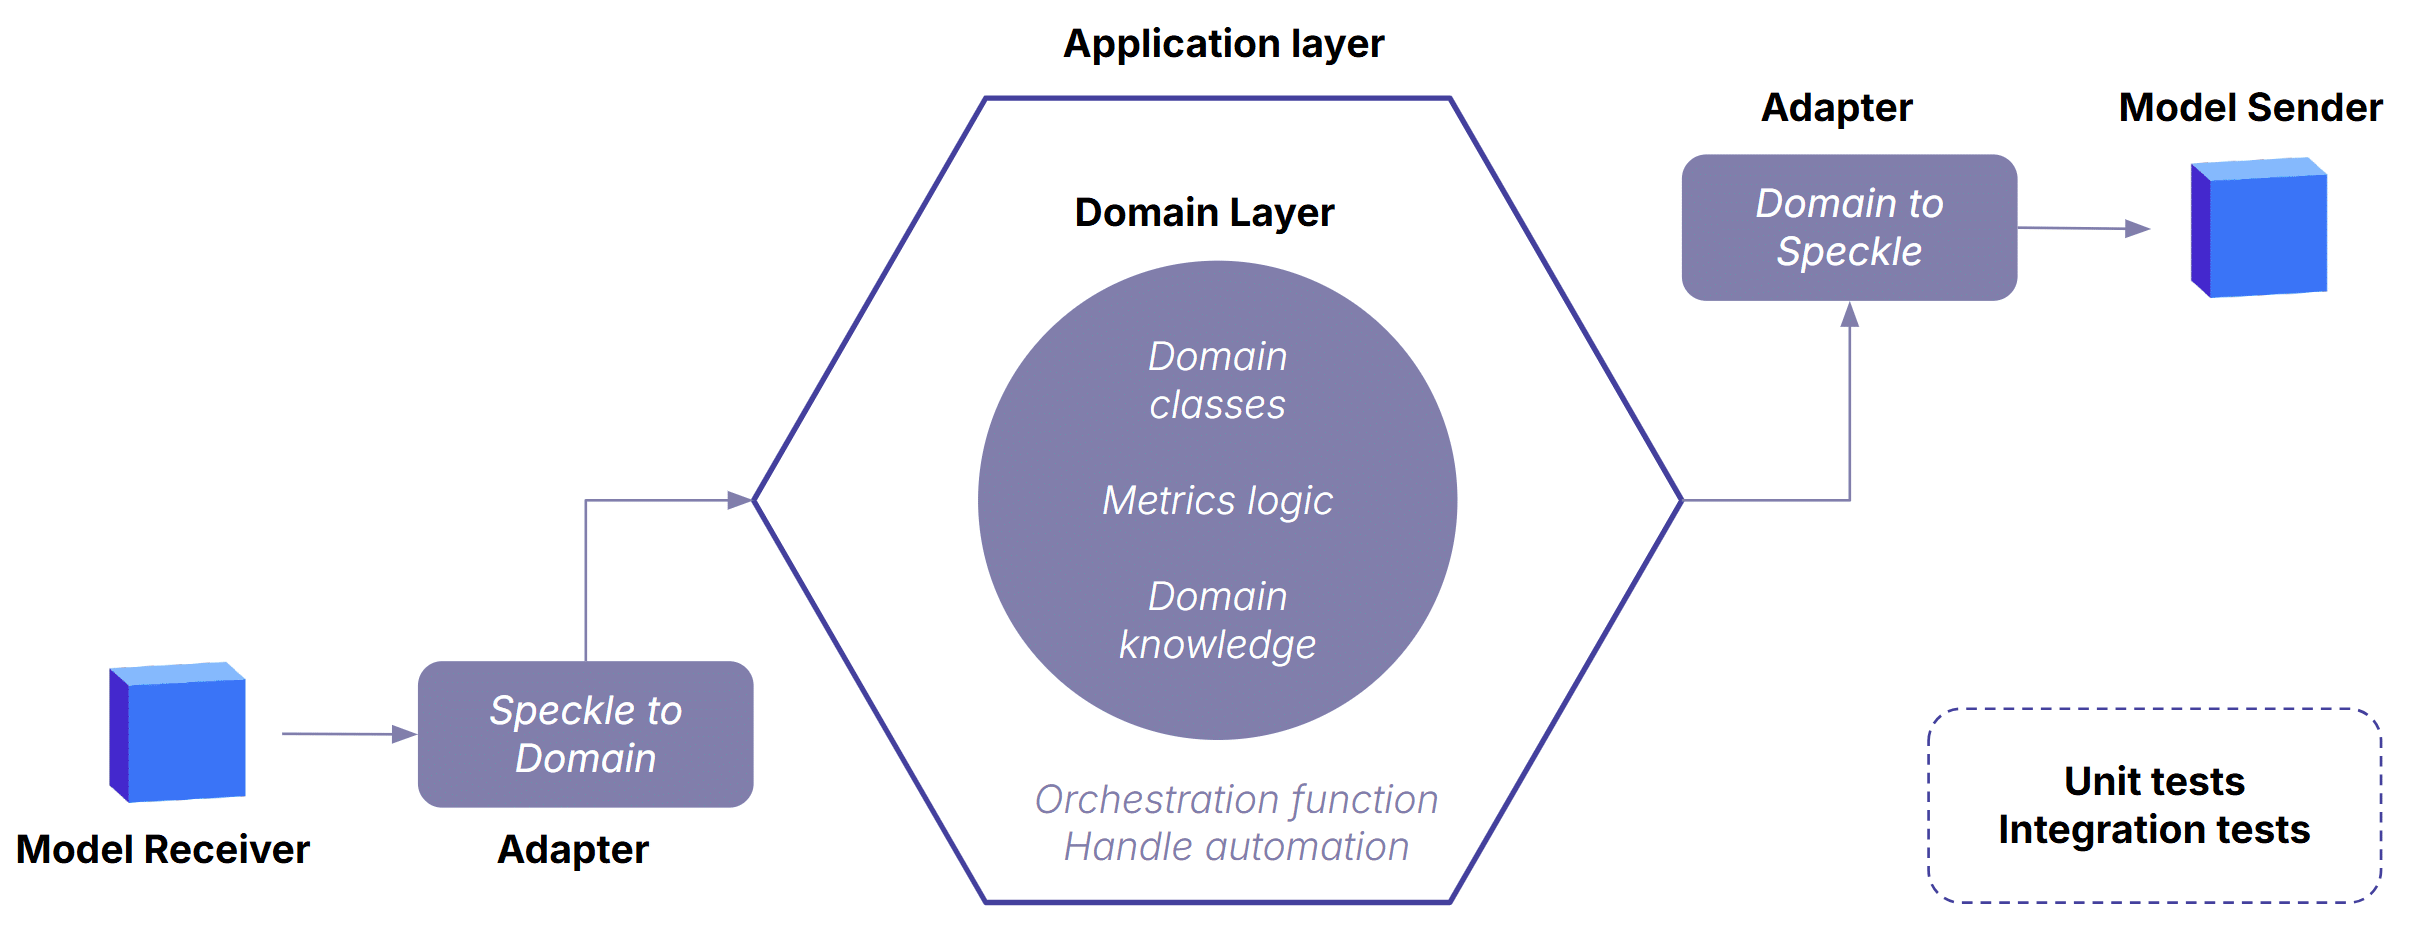
Hexagonal Architecture
The architecture keeps the domain layer stable and independent, even as modelling tools, data formats, or workflows shift around it. It follows a classic port-adapters pattern: pure domain logic at the center, adapters at the edges translating data in and out, and orchestration in the application layer coordinating the workflow. This separation is what makes the KPI engine reliable, extensible, and resilient to change — the core logic never depends on Grasshopper, Speckle, or any external API.
User Workflow
Creating New Automation
Publishing Design Model – Trigger
Evaluation
What Worked Well
One of the biggest wins was how quickly everything became available. As soon as someone published a new version, the web page updated within seconds—KPIs, geometry, everything. That immediacy changed the rhythm of the workflow: instead of waiting for scripts to run or asking around for the “latest numbers,” the data was simply there.
Another major shift was consistency. With all metrics coming from a single, unified pipeline, we finally had a shared reference point. No more comparing values from different scripts or wondering which spreadsheet was the “real” one.
Even better, the system proved surprisingly interoperable. A lightweight Grasshopper script was enough to push structured data into Revit, which made the whole process feel less like a technical hurdle and more like a natural extension of the design workflow.
What are the Limitations
The whole setup depends on a stable data schema—and that’s where reality hit. Designers constantly tweak model structures, rename things, or forget bits of metadata. It’s normal in a creative environment, but it makes consistency hard to enforce. And this isn’t just a studio quirk; it reflects the broader industry. There’s no standard modelling procedure across teams or offices, so any automated pipeline has to survive a fair amount of chaos.
What Comes Next
There’s a lot of room to grow. The system could support more KPIs and more element types, expanding beyond the initial scope.
Smarter schema handling is another big step: more flexible adapters, better fallbacks, and automatic recovery when certain metadata is missing would make the pipeline more resilient to real‑world modelling habits.
And then there’s the AI angle. With enough historical data, the pipeline could start predicting KPIs, flagging anomalies, or even suggesting design moves before the user asks. It’s early, but the potential is there.
