Block Classification
This project aims to classify urban blocks in Barcelona, focusing on the districts of Saint Martí and Eixample, based on their dominant functions. By identifying the primary uses of these urban blocks, we can gain insights into the spatial organization and functional distribution within the research area.
Saint Martí and Eixample, two vibrant and distinct districts of Barcelona, offer a diverse mix of residential, commercial, industrial, and recreational areas. Understanding the dominant functions of these blocks can assist city planners, developers, and policymakers in making informed decisions that enhance urban living conditions, optimize land use, and improve overall city management.
This study will involve collecting and analyzing various types of data. By leveraging advanced data analysis techniques, we aim to create a comprehensive classification system through Machine Learcning which that accurately reflects the primary functions of urban blocks in these districts.
research area : Saint Martí and Eixample
Custom Database: Mapping 3D design Space merging with OSM Web scraping
Gathering all the required information was a complex process that includes three step workflows :
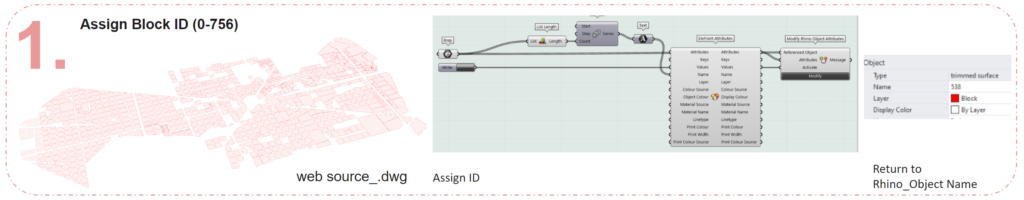
Firstable, we need ” block boundary” as research unit, we download and assign Block ID using elefront and further report back to rhino.
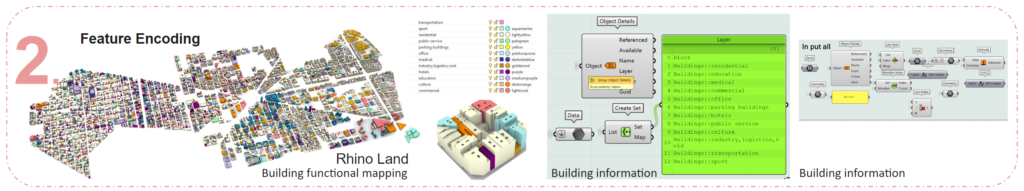
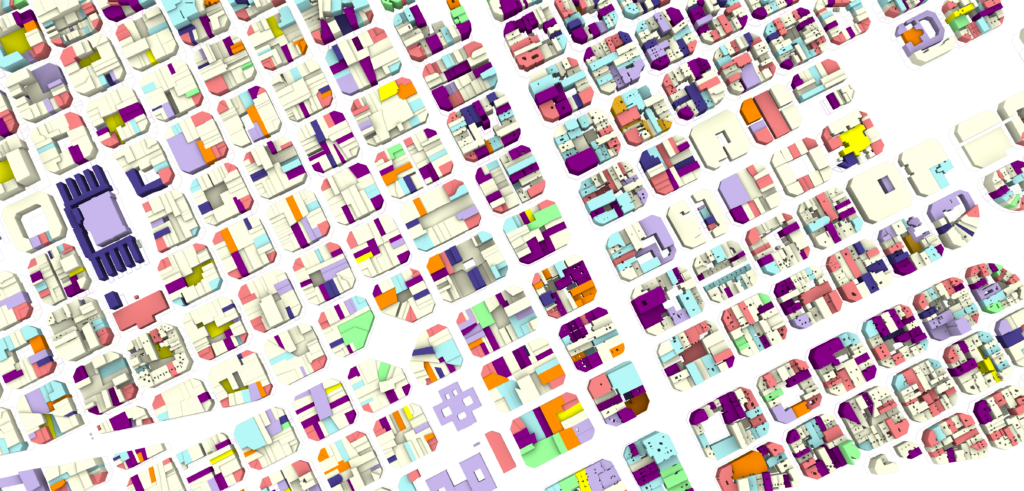
2nd, we import whole 3d model from rhino land plugin. We have to manually Mapping the function into layers. And finally, we group the buildings in GH and assign the building to the block where it belonged.
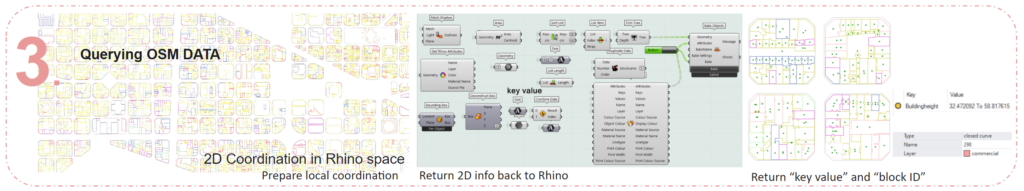
3rd, We further found there might not be enough data, we seek a way to connect our 3D model to Open Street Map in order to query more information.
Merging Data from 2 Design Space: Rhino /gh + OSM /oxmnx
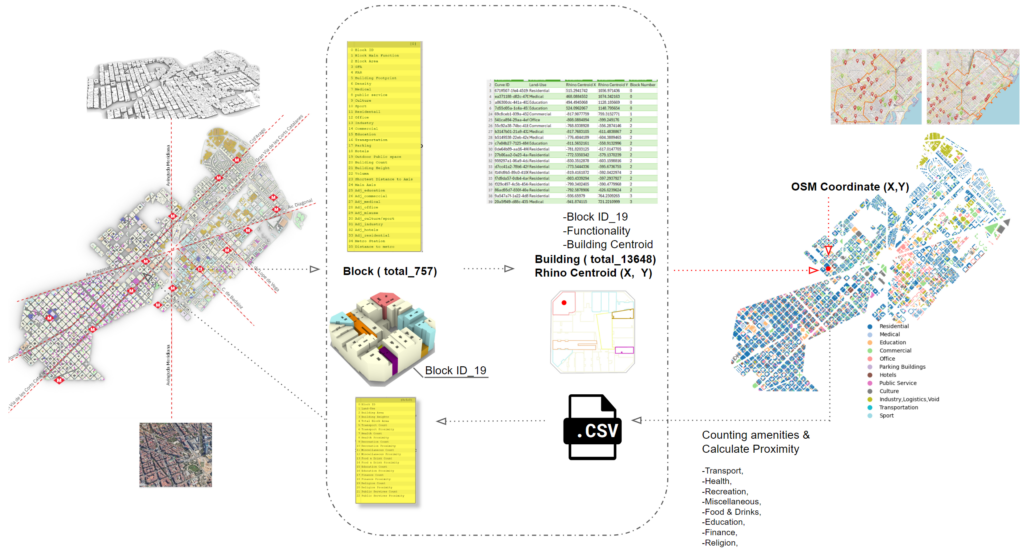
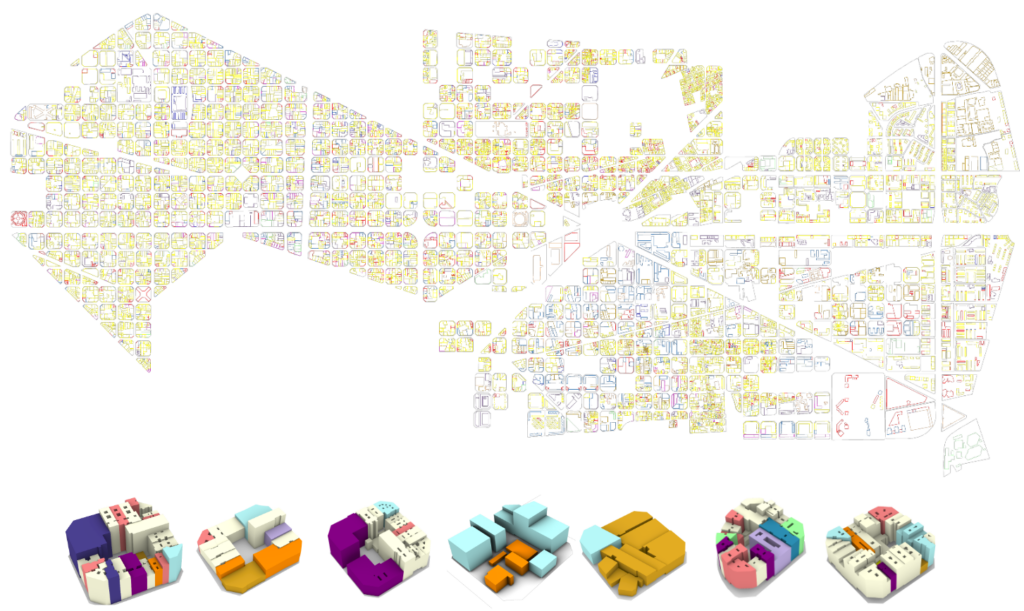
With elefront we can extract 2D building footprint with the information of building function and block ID. We further connection the two coordination with the centroid of the building polygon. So whatever information we query it will refer back to the block ID it belongs to. Here we mainly ask for amenity count and the proximity.
Input v.s. Output _ Define Block Class
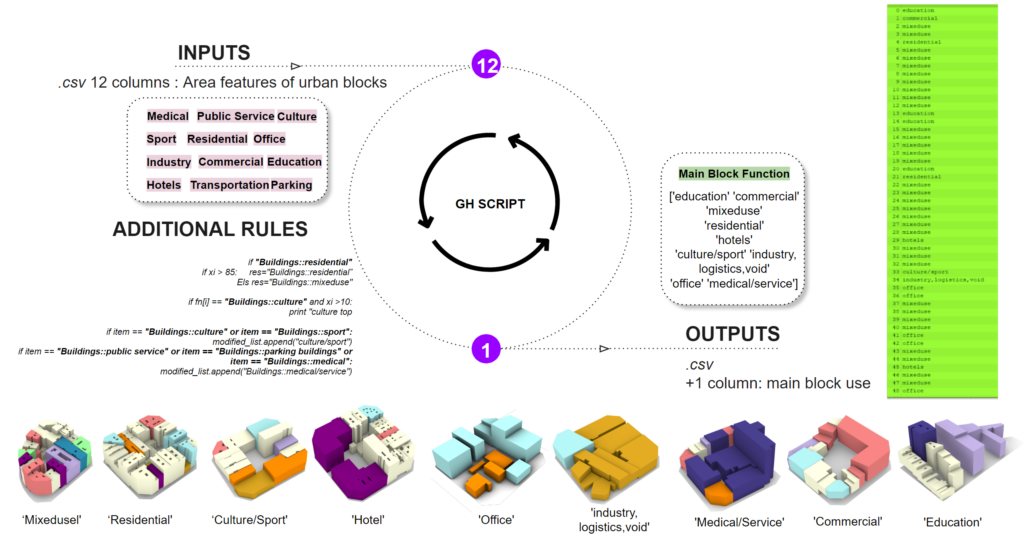
The big question is. How do we define the class for the exsisting blocks?
The main method to define a block function is to Calculate the area percentage of each building function in a block.. However. We found this will create huge data imbalance meaning a lot of residential block and few the rest.
We define a rule to help us.
Rule 1 :split residential block into residential or mixused. When the residential building is less than 85%, it will belong to mixed use.
Rule 2 :Culture priority. When Culture function is bigger than 15%, it will belong to culture block.
Rule3: Merging building function. we combine culture with sport as culture/sport block. Merging Medical with public service and parking.
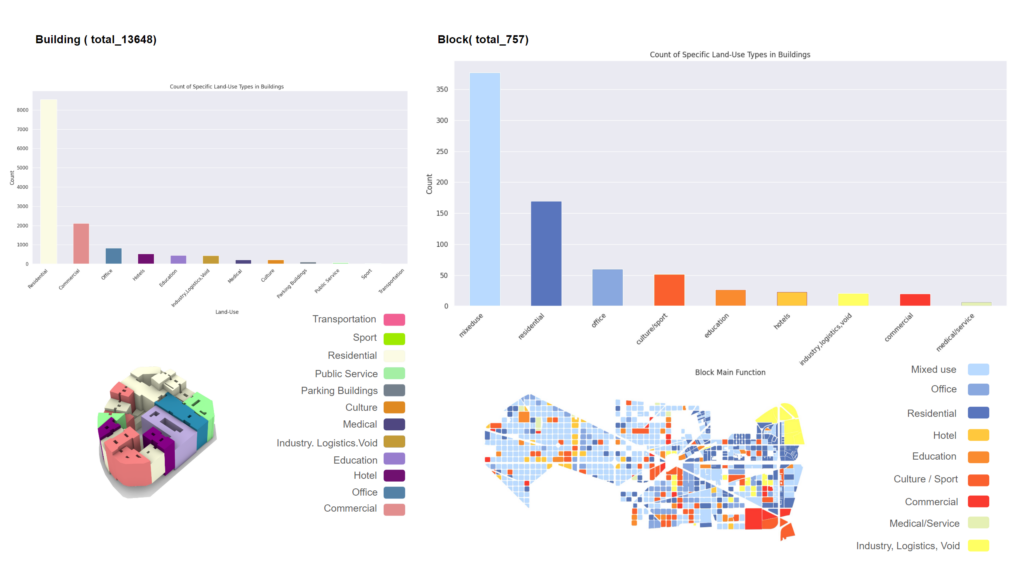
Here we see 9 final functionality of urban block in Barcelona.
Dataset Creation
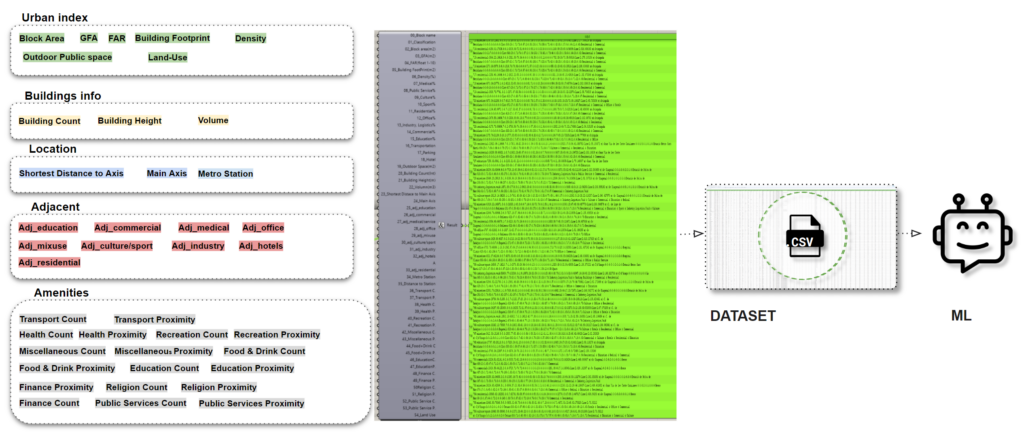
Our columns contain different categories such as Urban Index, Building Information, Block Location, Ajacent Block Function, Amenities Count.
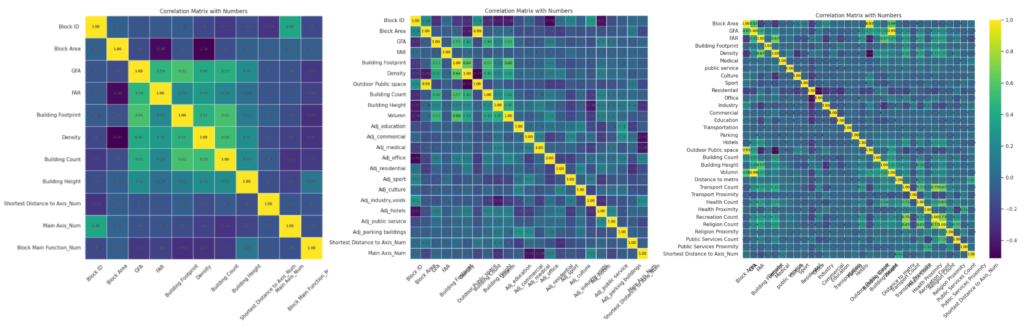
Data cleaning up and Correlation
Before diving into the analysis, it is crucial to preprocess the data by handling the numerical and categorical features appropriately. This step ensures that the data is clean, well-organized, and ready for modeling.
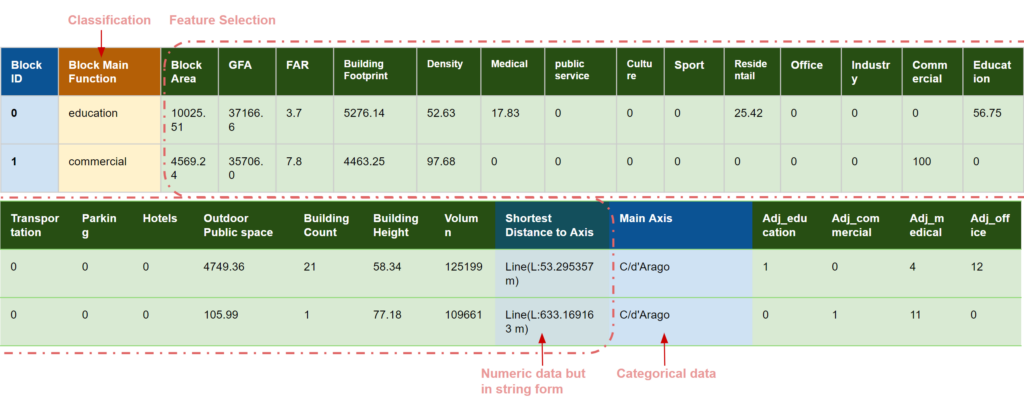
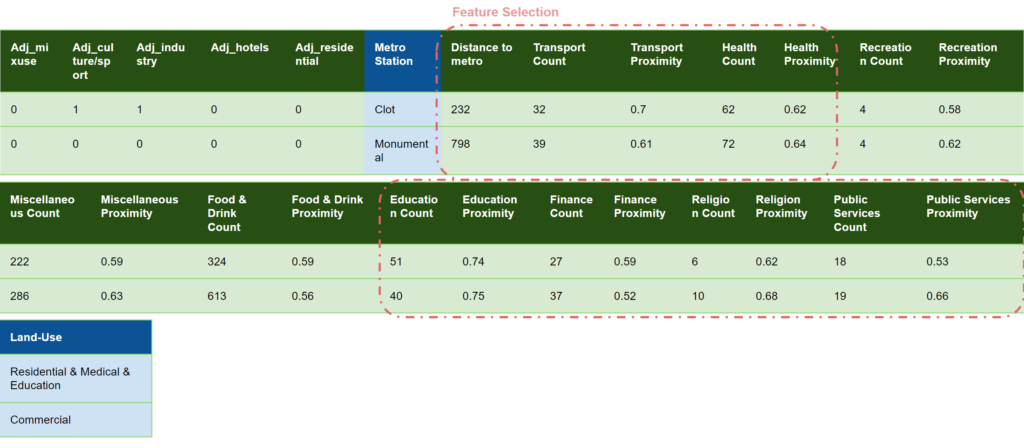
Out of the 53 features in our dataset, we focused on selecting those that are most relevant to predicting the Block Main Function. Our feature selection process included analyzing features related to the area percentages of different functions, along with other attributes describing the overall characteristics of each block. By examining the relationships between these features and the Block Main Function through various plots and statistical analyses, we identified a subset of 22 to 30 features that demonstrated significant correlations. This careful filtering ensures that our model is built on the most informative and impactful data, enhancing its predictive accuracy and reliability.
Data Analysis_Urban Index
We have define 12 building function but 9 block functional categories to reduce data imbalance.
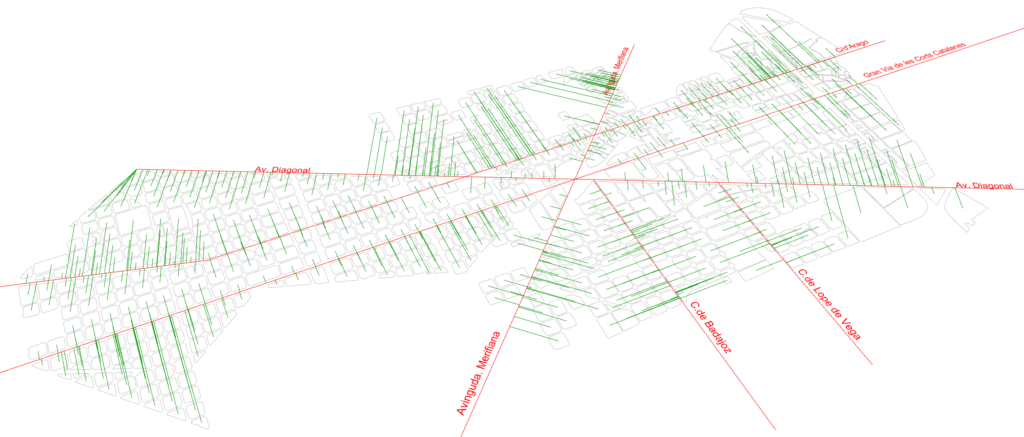
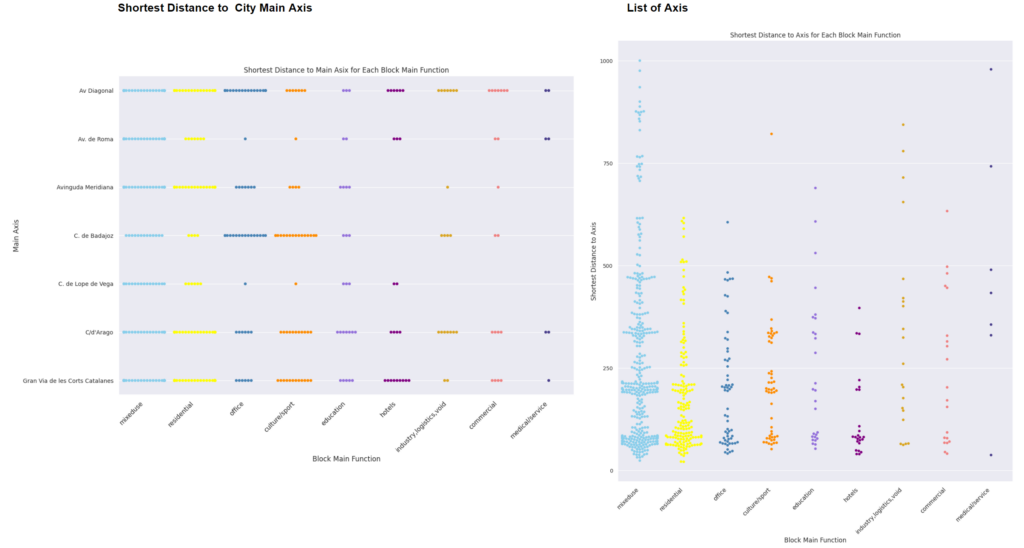
Data Analysis_Shortest Distance to Urabn Axis
We see block function can be related to where it is located. Is it close to urban major axis, or it need quick access to public transportation?
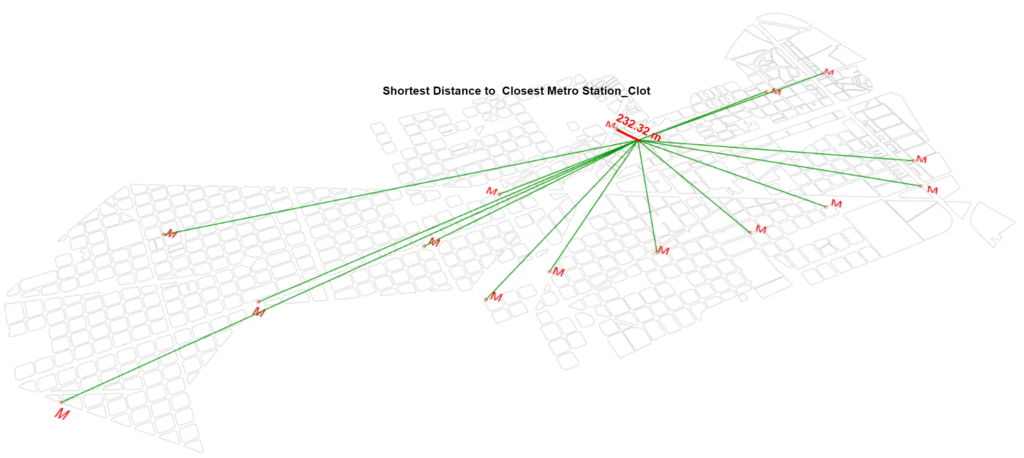
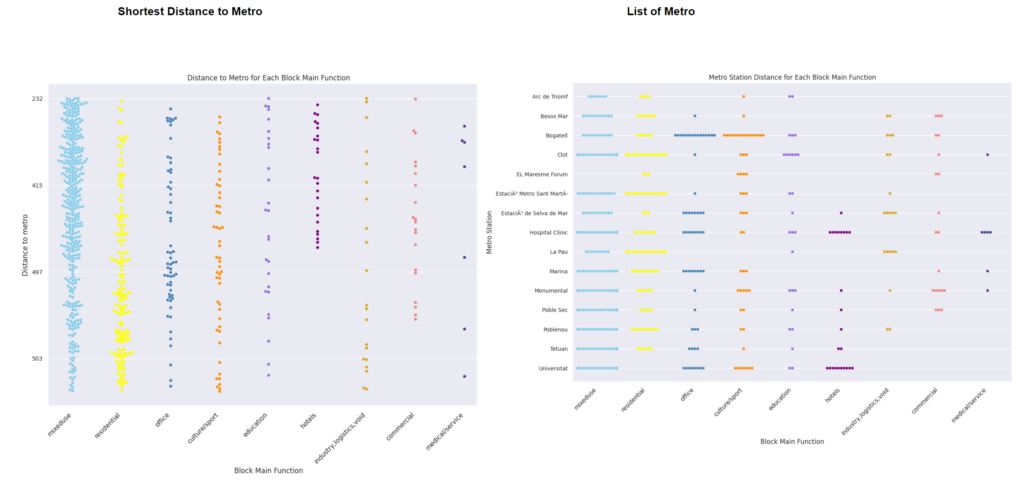
Data Analysis_Shortest Distance to Metro Station
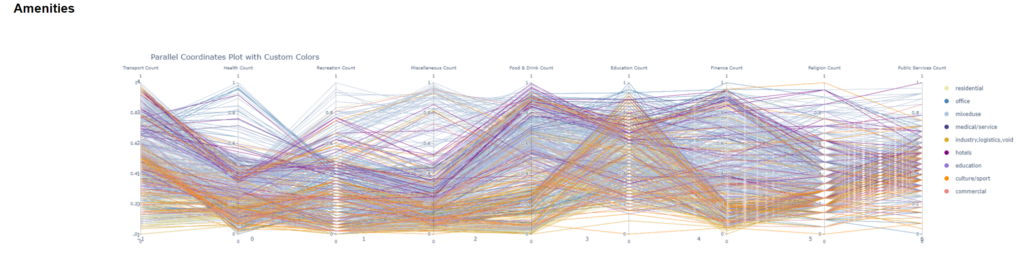
Data Analysis_Parallel Plot
Office and commercial blocks tend to start with higher transport counts.
Blocks with mixed-use show higher variability and often higher counts in recreation as well as food & drink categories. Residential and educational blocks often end up with higher public services counts.
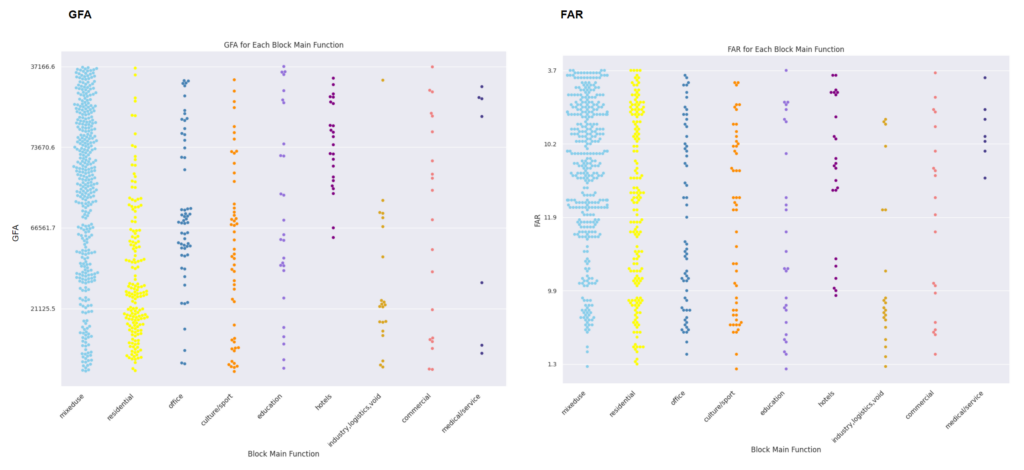
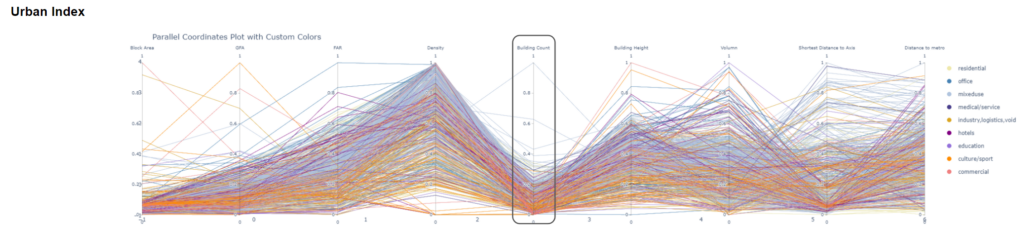
Categories like office, commercial, tend to have higher FAR, Building Height, and Density, indicating more intensive land use and larger buildings.Residential areas have lower values across these dimensions, indicating less intensive land use with smaller buildings.
Data Analysis_Area Anaylsis
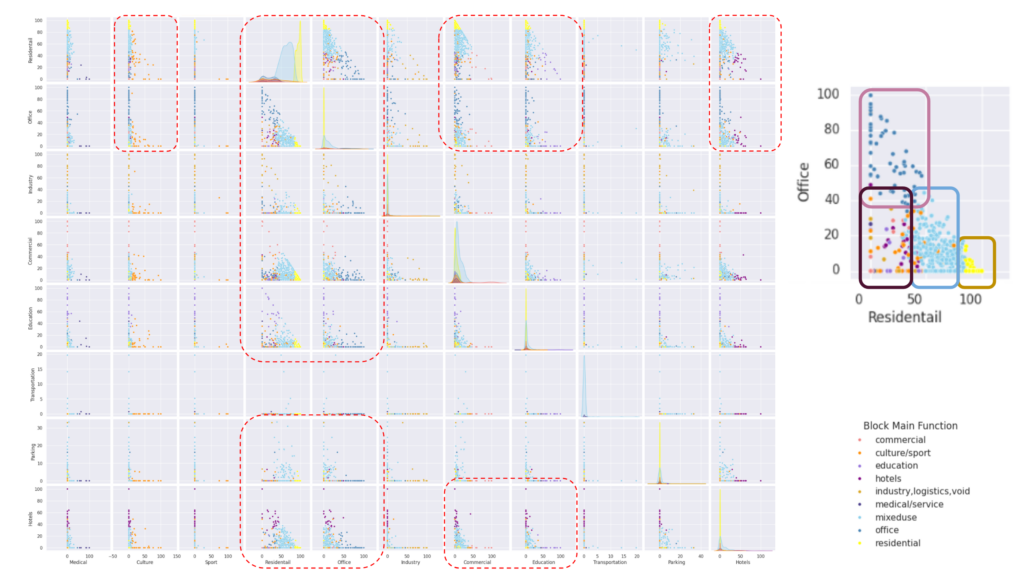
Comparing the pair plot of residential and office blocks reveals distinct patterns. Residential blocks predominantly consist of over 85% residential areas and less than 10% office space. Mixed-use blocks typically feature 50-85% residential areas and approximately 40% office space. Conversely, office blocks are characterized by over 80% office space and less than 45% residential areas. Other block functions, which have minimal residential and office space, exhibit overlapping characteristics, making them less distinct in comparison.
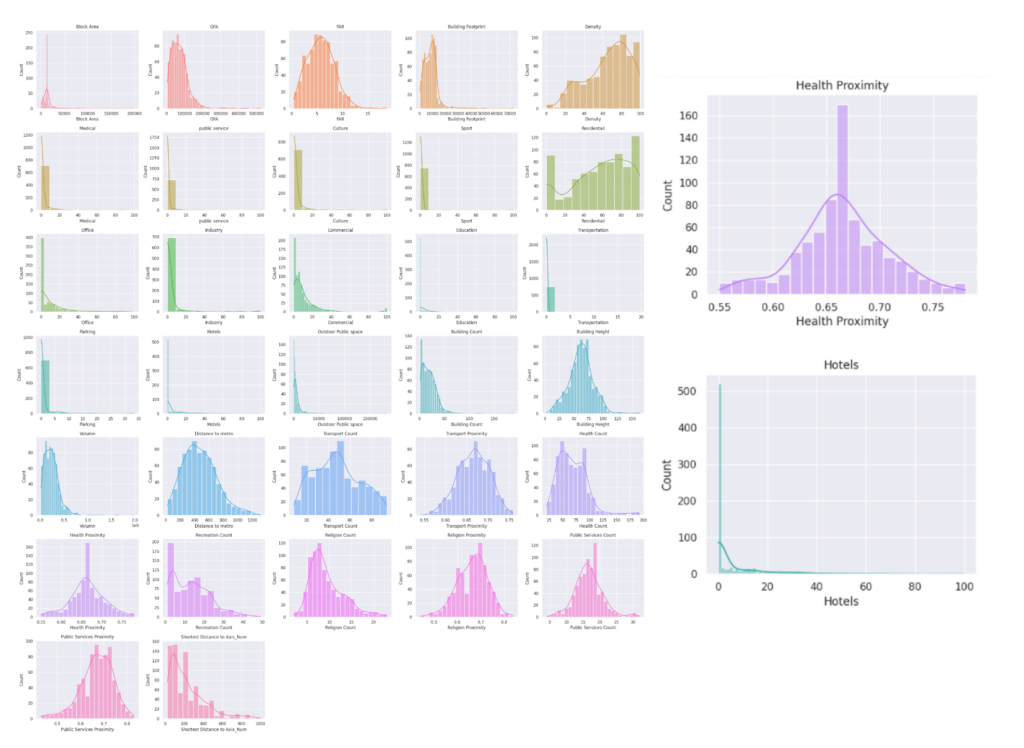
Data Analysis_Feature Distribution
Histograms provide a comprehensive overview of feature distributions, allowing us to easily identify where the majority of data points are concentrated. They offer a visual representation that highlights the central tendency and spread of the data, making it simple to spot areas of high frequency. Additionally, histograms are useful for detecting outliers, as these values will appear as bars that are distinctly separate from the main distribution. This capability to visualize the distribution and outliers in a dataset makes histograms an essential tool in exploratory data analysis.
Machine Learning
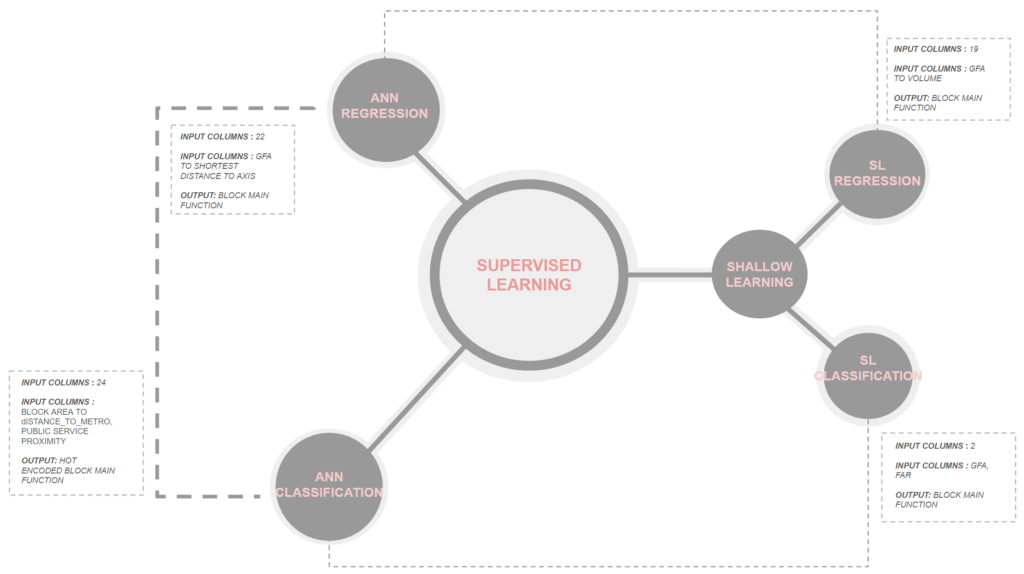
For training the model, we conducted trials using both Supervised Learning (SL) and Artificial Neural Network (ANN) regression and classification models to achieve optimal accuracy. By varying the inputs, we thoroughly tested these models to determine the best approach.
Initially, we started with training using shallow models. However, we quickly observed that the data complexity hindered these models’ predictive performance. Consequently, we explored more sophisticated techniques to better capture the underlying patterns and improve prediction accuracy.
ANN regression
we attempted Supervised Learning (SL) regression for classifying urban blocks. However, the training plots indicated that this approach was not compatible, as the predicted values did not align with the ideal prediction range. Subsequently, we switched to ANN regression.
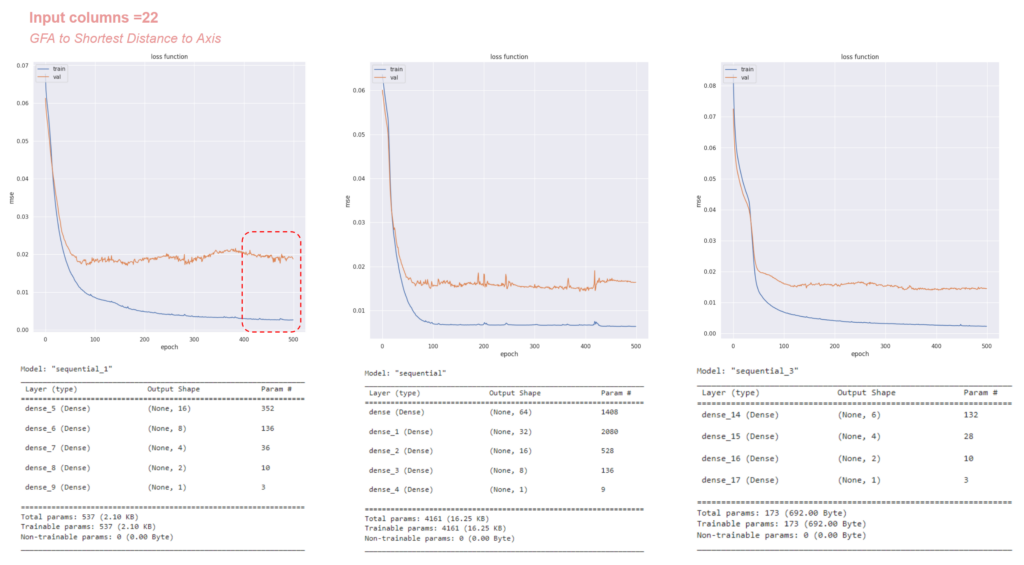
To understand the correlations, we created pair plots of the input columns. We began training with 16 input columns using an ANN model with three layers consisting of 6, 4, and 2 neurons, respectively. We then experimented with varying both the input columns and the number of neurons to optimize the model training process.
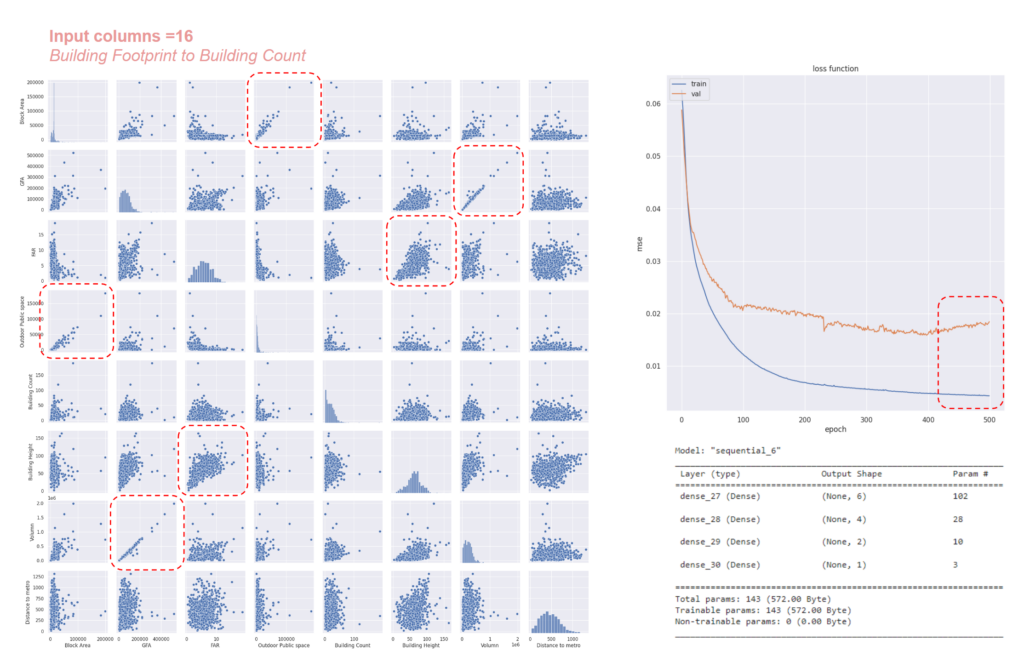
eventually we were able to reduce the loss with inputs being kept from GFA to shortest distance to axis coming down to 22 inputs. We varied the model layers to understand the number of parameters in training and by adding 6 more inputs and keeping to 173 parameters, our loss value reduced.
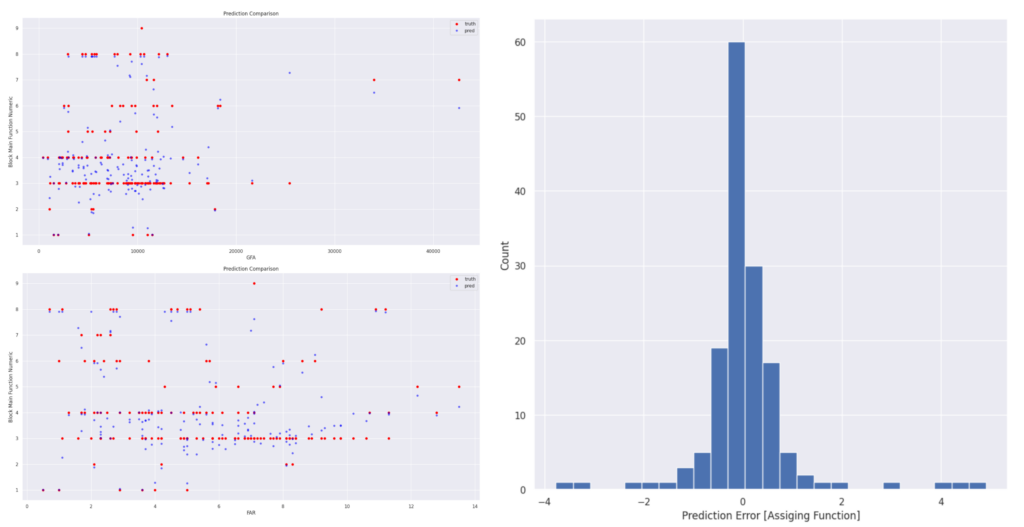
Yet we could see how the truth vs prediction showed variation when we look at with reference of GFA to Block main function or FAR to block main function.
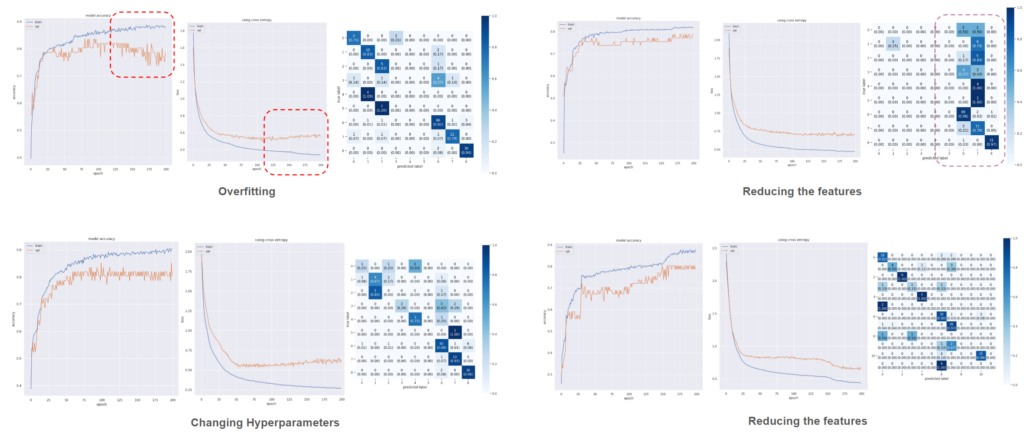
ANN Classification
Eventually, we succeeded in reducing the loss by carefully selecting inputs, ranging from Gross Floor Area (GFA) to the shortest distance to the axis, narrowing it down to 22 inputs. We experimented with different model layers to understand the impact of the number of parameters on training. By adding 6 more inputs, we adjusted the model to 173 parameters, further reducing the loss value.
However, despite these improvements, we observed variations in the truth vs. prediction plots, particularly when referencing GFA to Block Main Function or Floor Area Ratio (FAR) to Block Main Function. These variations indicate areas where the model’s predictions still diverged from the actual values, highlighting the complexity of accurately classifying urban blocks based on the selected features.
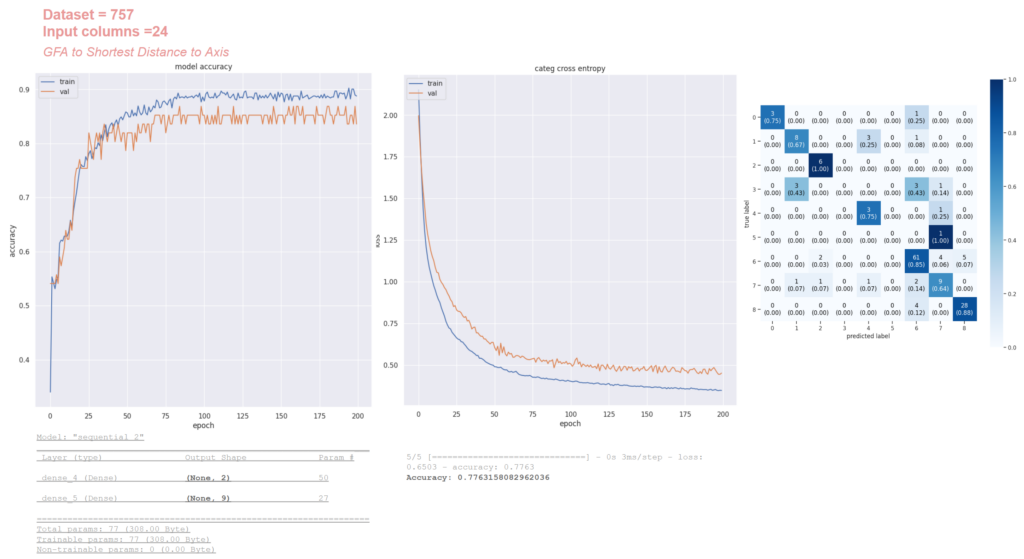
Our final neural network, consisting of two hidden layers with 2 neurons in the first layer and 9 neurons in the second activation layer, achieved a 77% accuracy rate on a dataset of 757 instances and 24 features. The narrowing gap between the training and validation curves indicates effective learning, despite some residual overfitting. This result demonstrates the model’s improved ability to classify urban blocks with reasonable accuracy, leveraging the selected features.
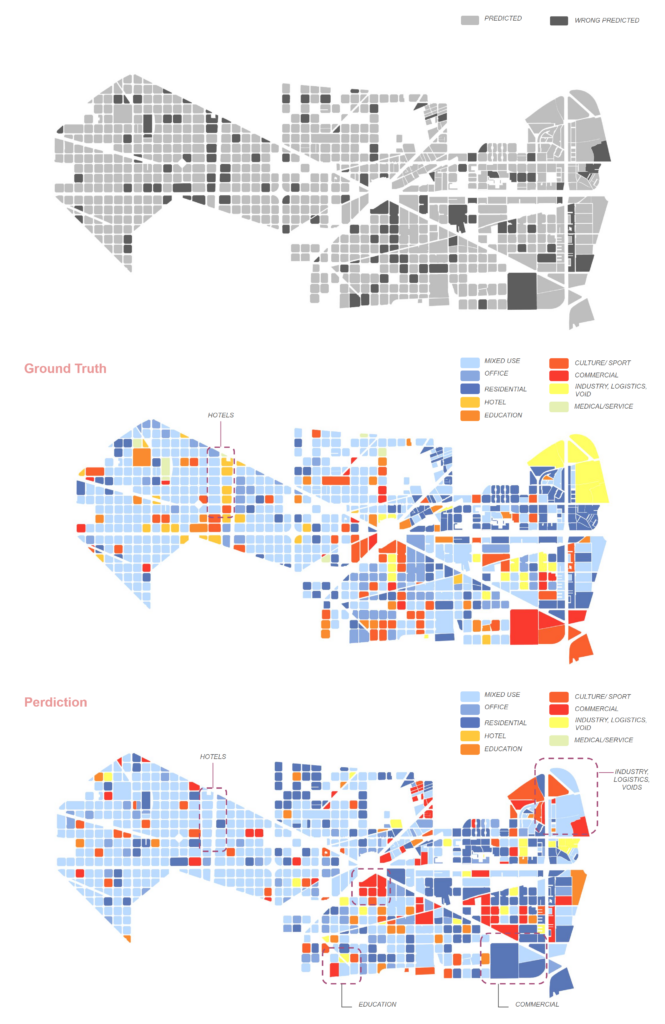
Deployment
Deploying the model in Grasshopper allowed us to visualize the mispredictions. Upon examining the results, we discovered that some blocks were erroneously classified as mixed-use. This was primarily due to the high number of mixed-use blocks in our dataset and the complexity of areas characterized by a blend of uses, such as those featuring hotels and historical buildings nearby. Despite these nuances, our model achieved an overall accuracy of 77%, demonstrating its capability to effectively predict class categories, albeit with occasional oversight of minor details.