
City-Oriented Modeling for Observational Radiative Thermal comfort
CONCEPT
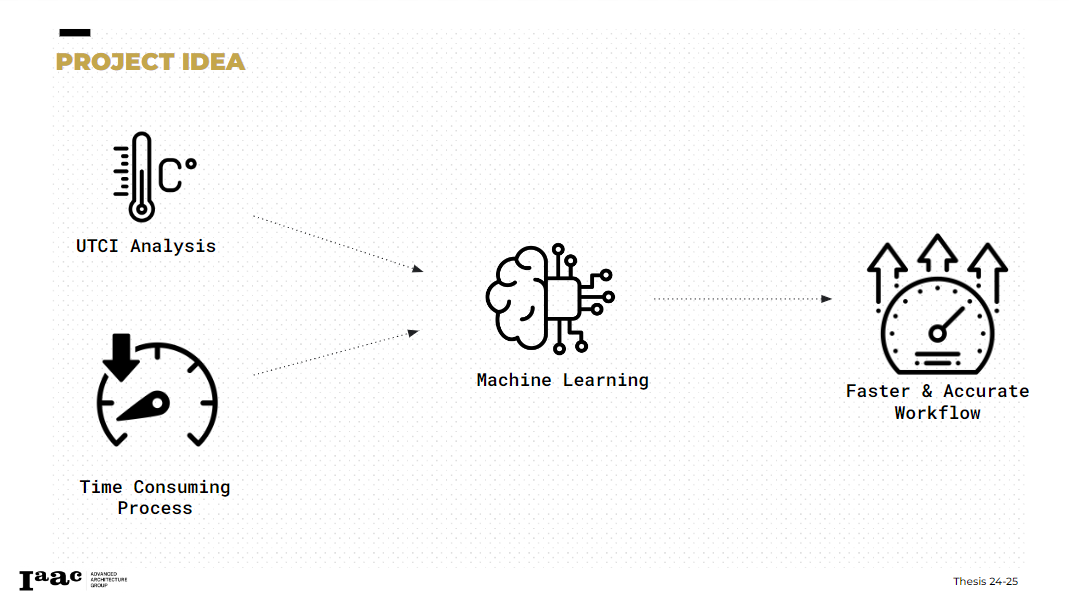
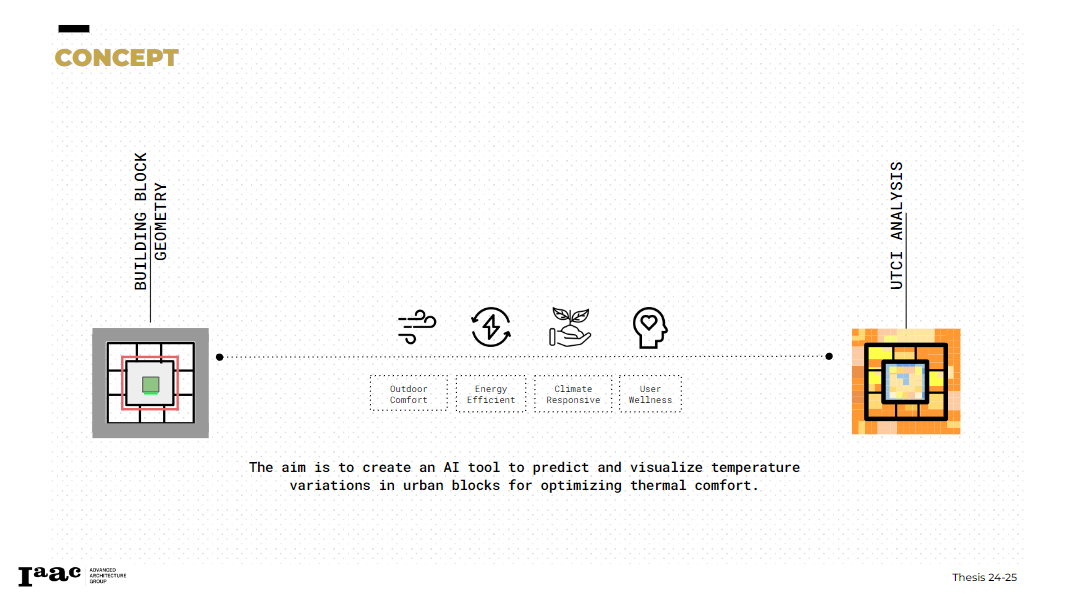
The idea behind C.O.M.F.O.R.T is to provide an effective tool for architects and urban planners to design cooler and more sustainable cities, leveraging the power of machine learning and AI technologies.
FACTORS OF IMPACT
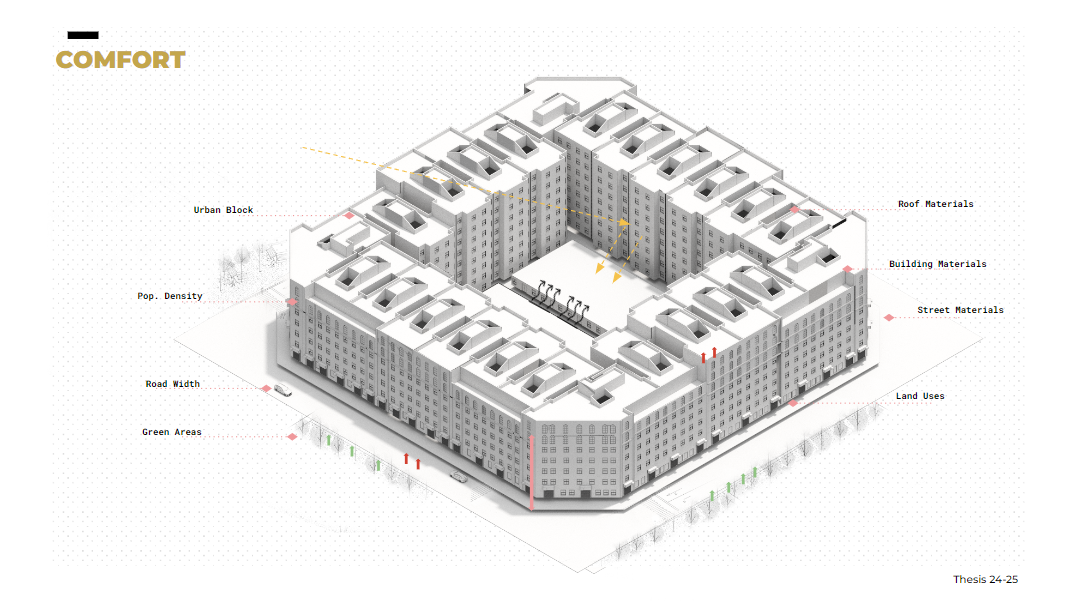
To create COMFORT we had to study the different factors of impact which links the Urban Blocks to the micro-climate
We also took a look on the different Urban Blocks compositions
BARCELONA
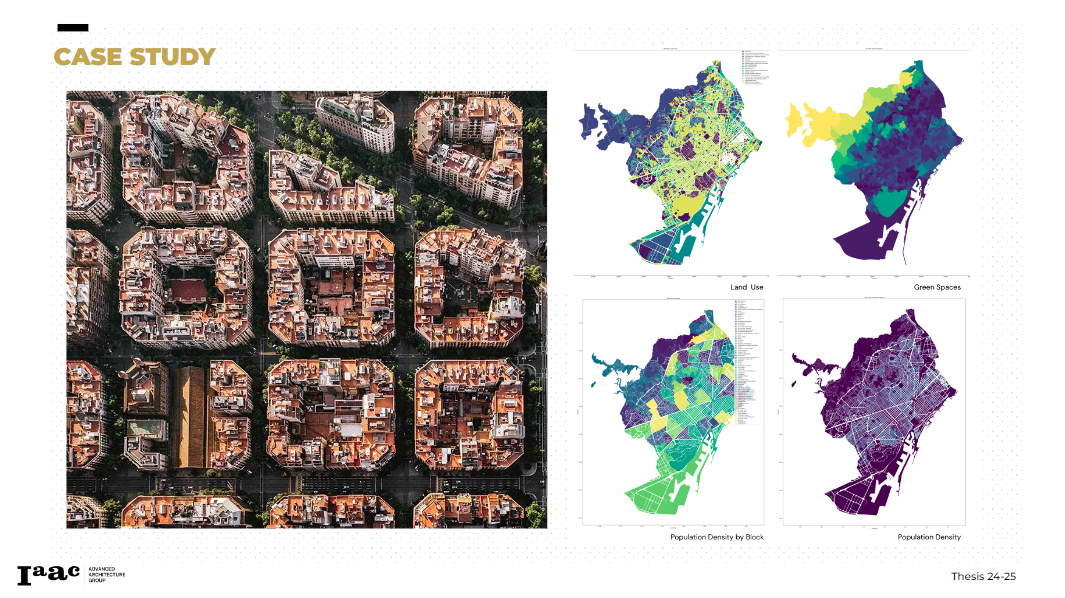
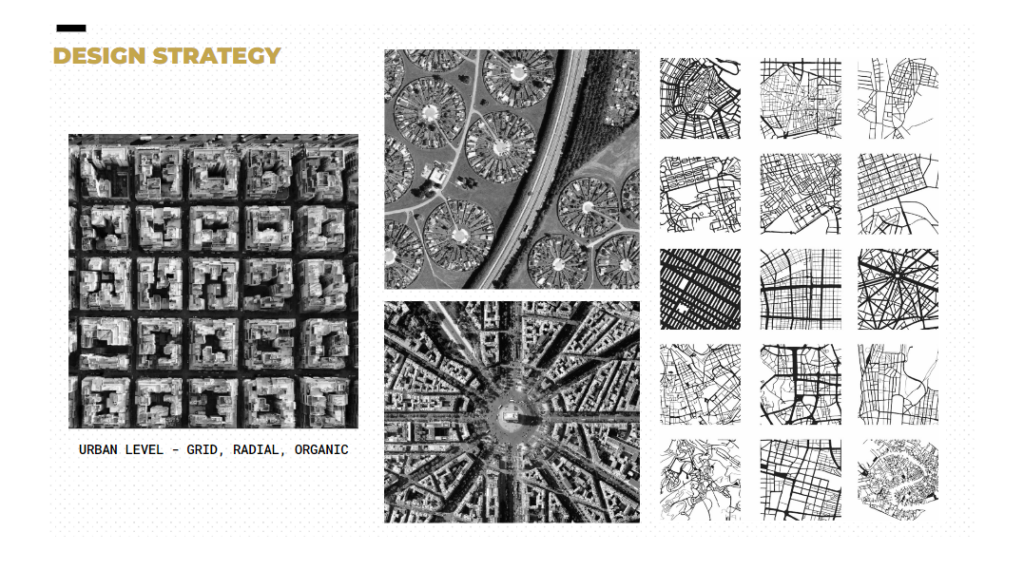
After a lot of research we chose the city of Barcelona as our case study especially with its distinctive grid composition and its unique Mega Block approach
METHODODLY
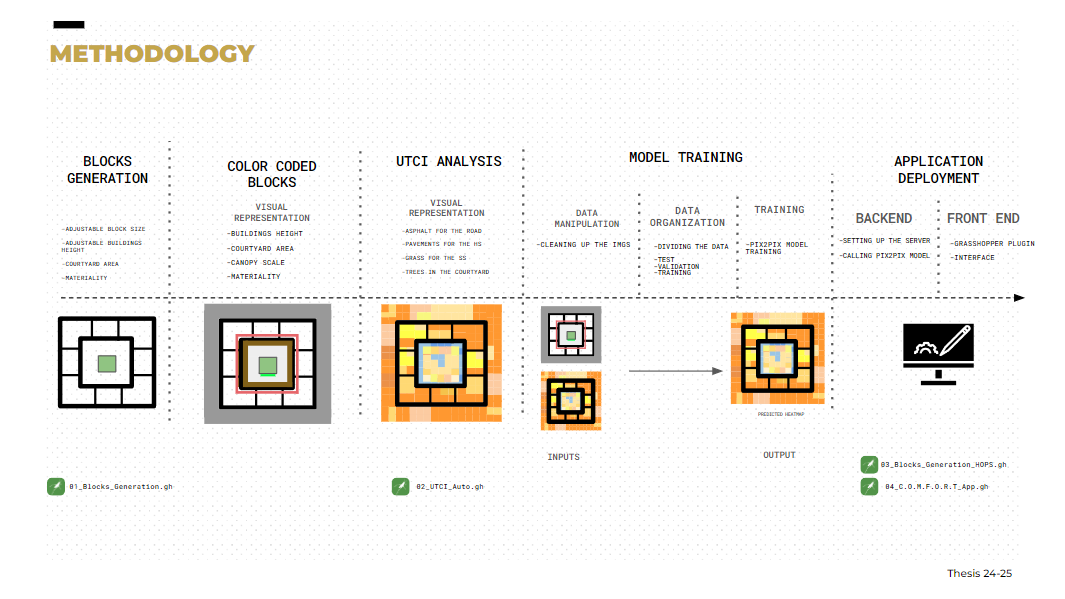
To reach our goal we followed a specific methodological approach. Each steps required its own tools and process.
1. BLOCKS GENERATION
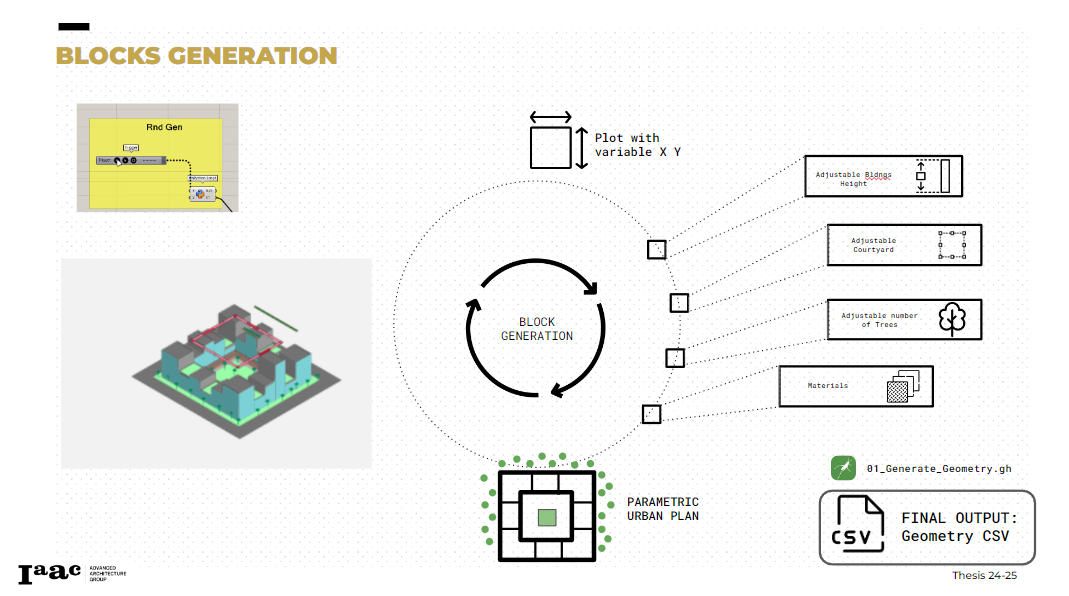
First step was to create our own parametric Urban Blocks to do so we had to encode different parameters including :
- Plot size
- Buildings Height
- Courtyard Area
- Trees
- Materials
The whole process of Urban Blocks creation was parametric and AUTOMATIVE relying on python scripts to randomize the parameters inputs within a given set of range.
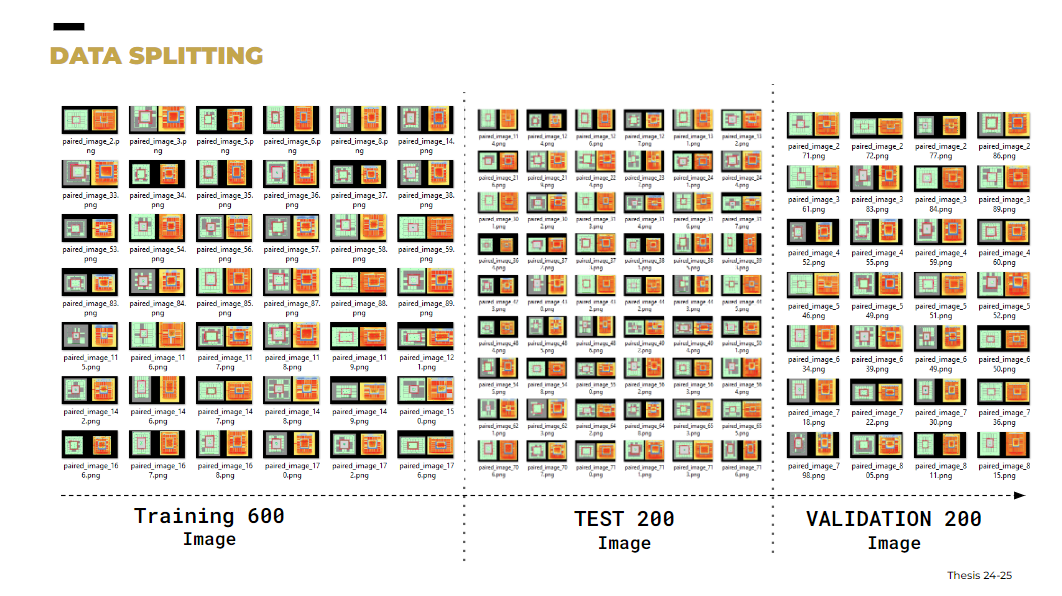
In order to use the blocks generation as inputs we needed to have at least 1000 samples
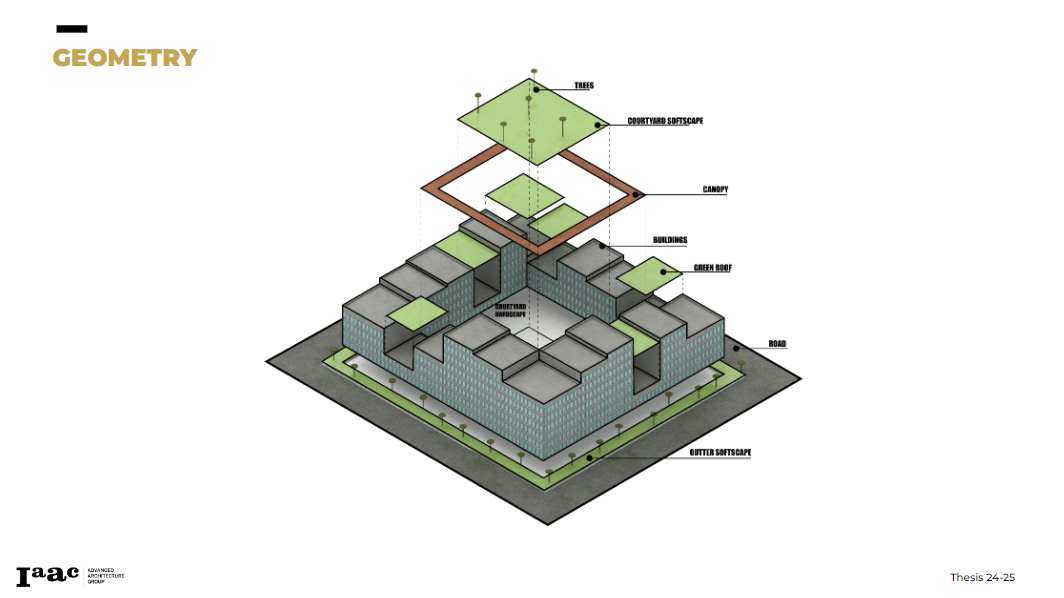
Here’s a visual representation of the parametric inputs.
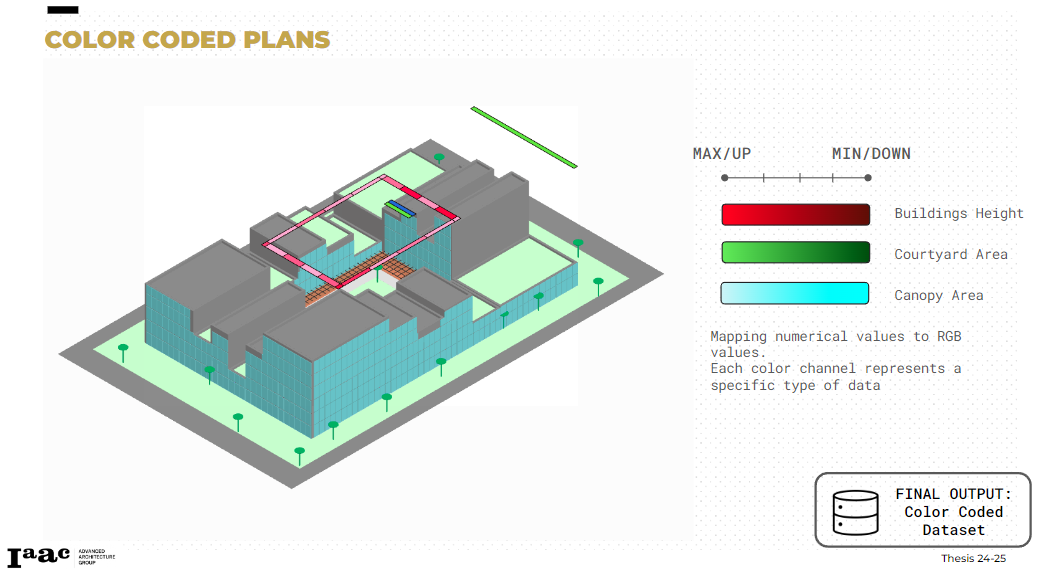
2. COLOR CODING
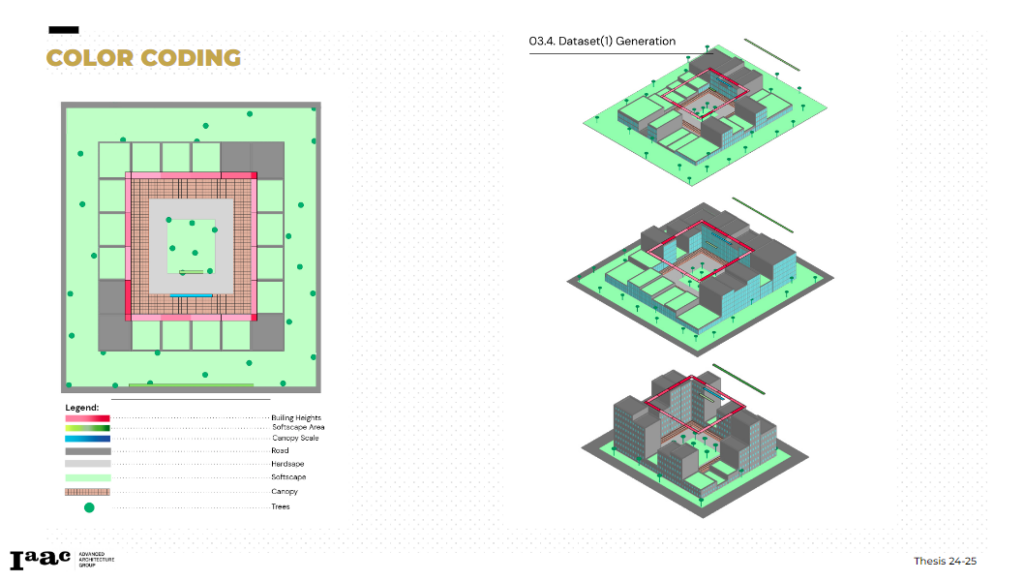
In order for the user to understand the information and parameters from each sample we used RGB channels to encode these elements:
- Red Channel: Represents the Buildings Height
- Green Channel: Represents the Area of the Softscape and Courtyard
- Blue Channel: Represents the Canopy area of cover
3. SIMULATIONS
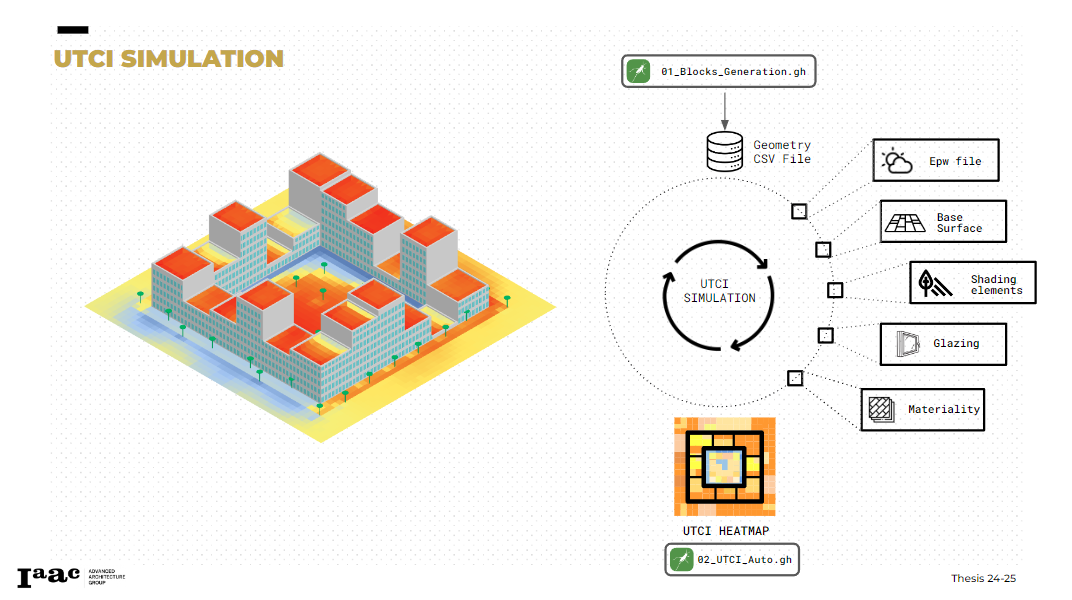

To run our simulations we have exported the previous parameters into CSV and used them as inputs to re-generate the same geometry to be used as a base for UTCI simulations on honeybee , we have used the epw file of the city of Barcelona which may produce inappropriate results in case our trained model was used for cities with different climate types. The simulation conducted were on the 15th of August between 12 and 13 O’clock instead of simulating the whole summer for faster simulations.
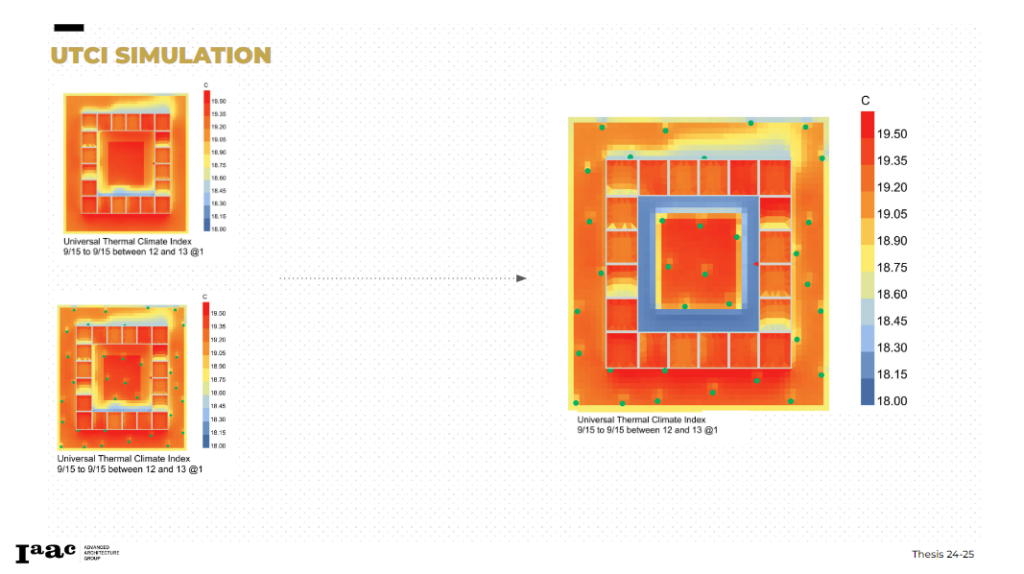
We’ve also studies the weights of the different shading elements, on the top left corner we ran the simulation without any shading elements, on the bottom left we ran the same simulation with trees added and at last we have ran it with trees and canopy on the courtyard periphery.
It is notable to mention that the whole simulation process of the 1000 samples is Automated too using python loops.

1000 UTCI analysis conducted
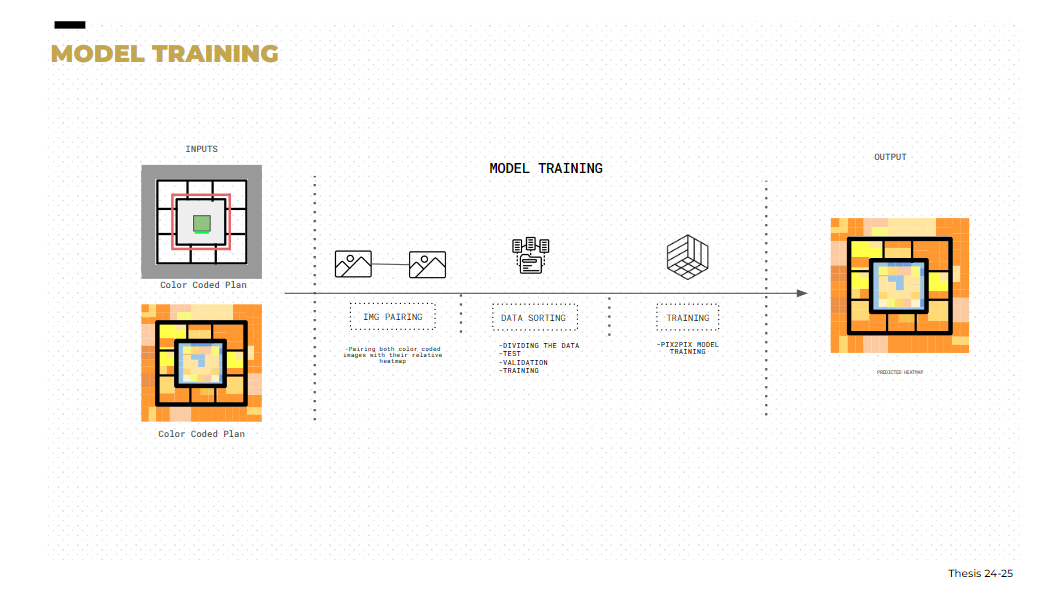
4. MODEL TRAINING
LOCAL TRAINING
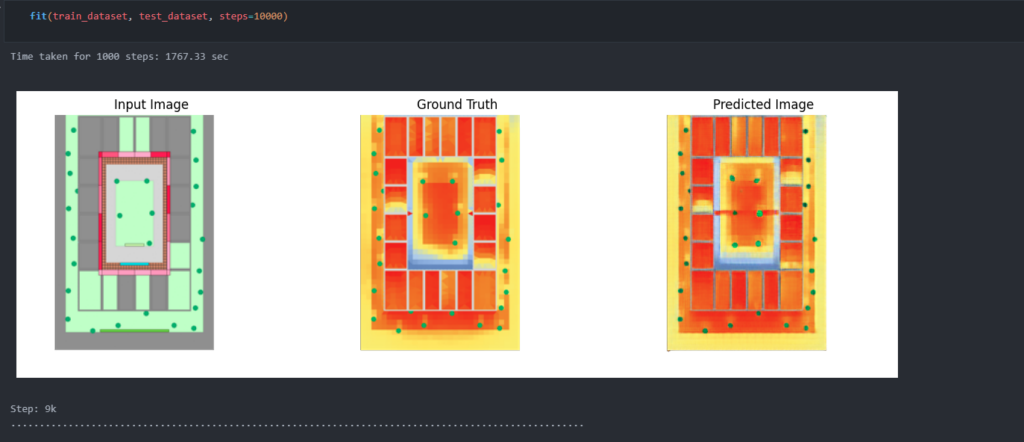
We ran multiple pix2pix training attempts, with multiple hyper parameters settings, the local training was taking too much time approximately 30mins per 1000 steps making it time and computational consuming for us trying to tune the different hyper-parameters. However we got some decent results running it locally with 10K steps.
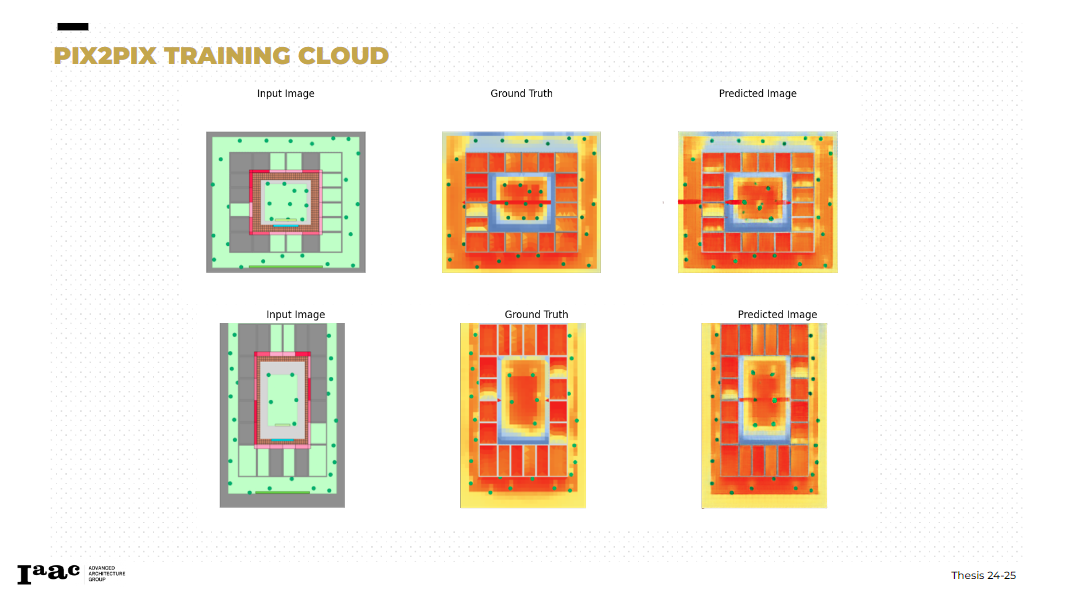
On the other hand the Cloud Training offered faster results but with limited computational power, these two training attempts were done on 7.5K and 20K steps respectively trying to over-tune the model for better results
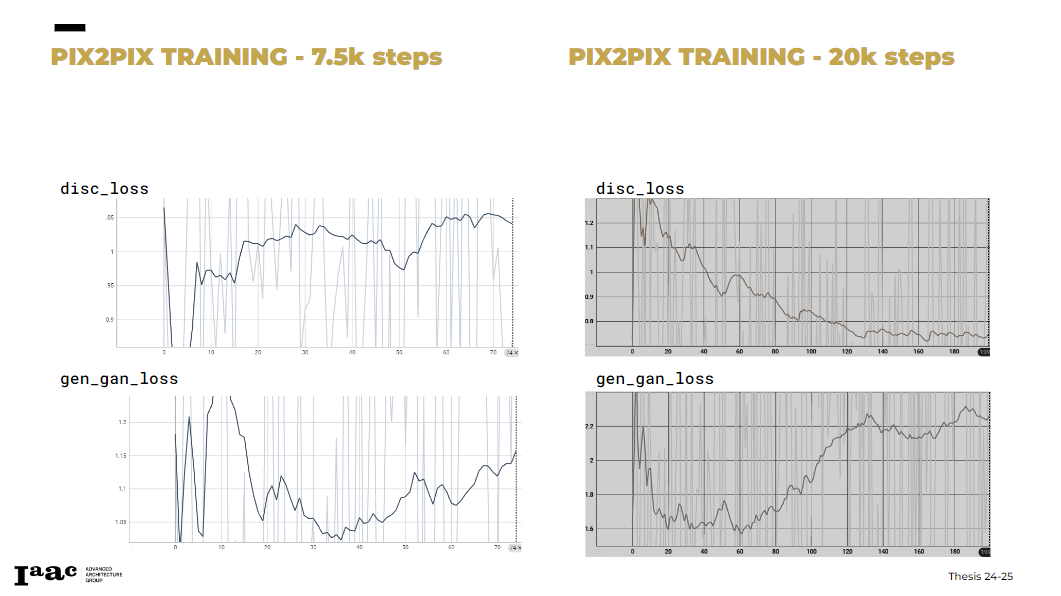
As we can see from the training results the Discriminator was able to overcome the generator in both attempts creating a disbalance between them this may due to a shortage in the number of sample. On the other hand the 7.5k model was more balanced than the 20k steps model.
5. APPLICATION
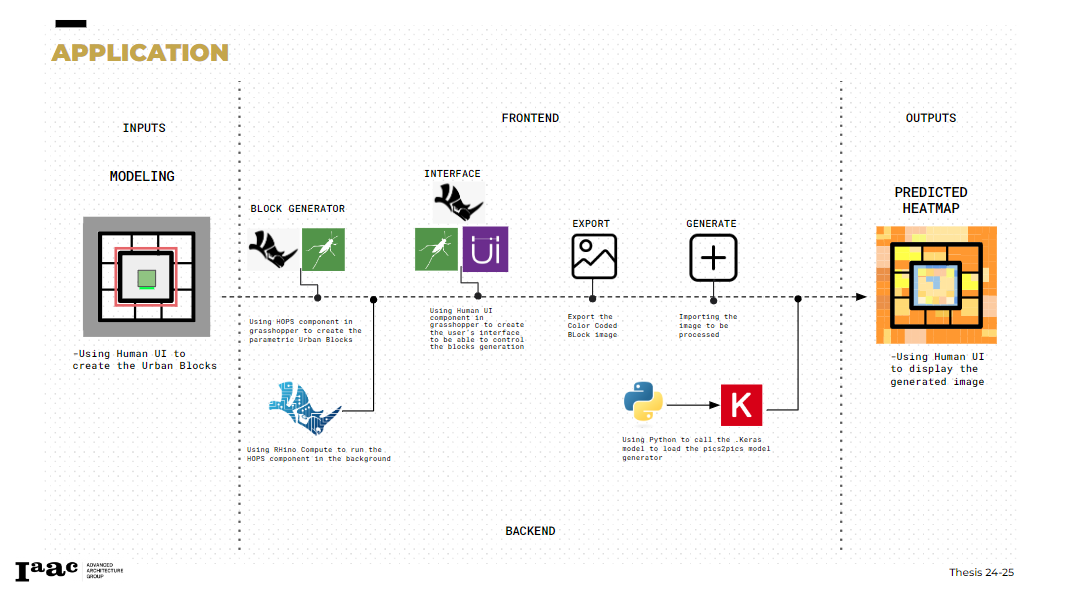
COMFORT app is dedicated for Architects and Urban Planners making it rational to use Grasshopper and Rhino to deploy our application, since most of the user should be already familiar with it . The Application have 2 parts the Frontend and Backend
Frontend
- Human UI plugin in Grasshopper
Backend
- HOPS Component in Grasshopper
- Rhino Compute
- Python
- .Keras Model
The HOPS and Rhino Compute will allow us to deploy our model into different webapps and software in the future. Utilizing cloud computing and Vue.js
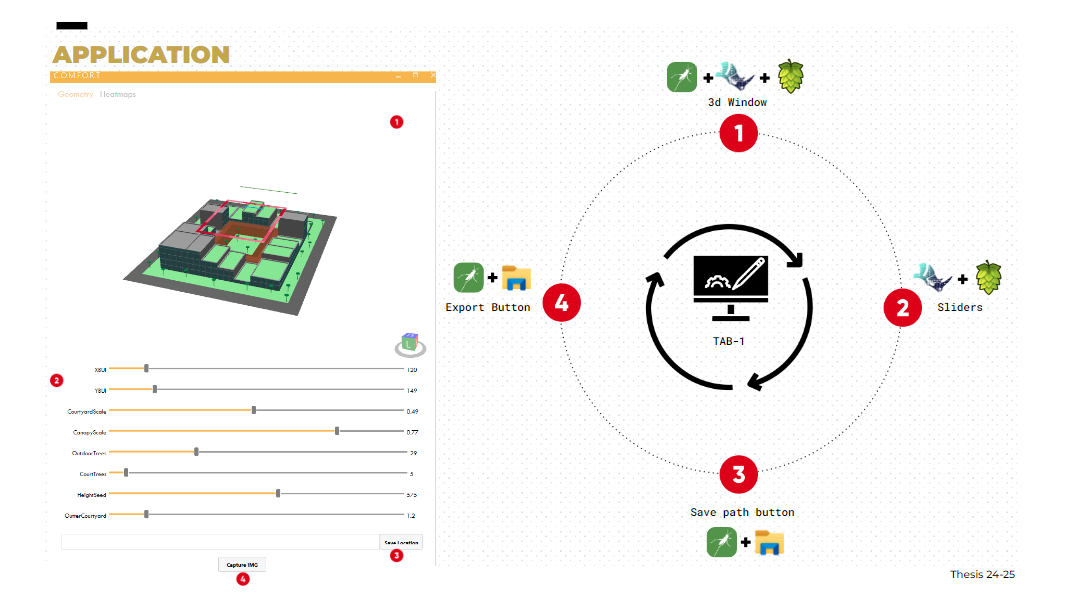
Our App is composed of 2 different tabs the Geometry Tab were the user’s only concern is to generate its desired geometry and export it as a png file. The second Tab entitled Heatmap, The user should import the exported image and press the heatmap button to generate automatically the correspondent heatmap of the input image. This was made possible through the use of two different python scripts.:
- First Py Script: Located on the users computer, responsible for locating the keras model generator and generator weights
- Second PY Script: Located In Grasshopper Responsible for triggering the first background Script which will save the file back in the corresponded folder
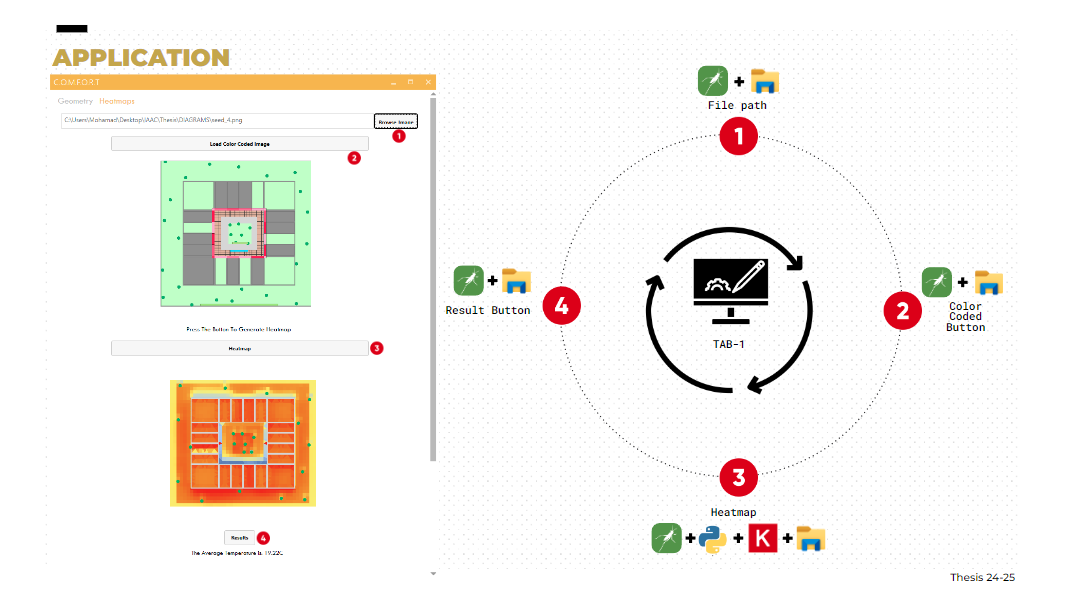
The Result Button Utilizes a specific C sharp Component similar to image sampler where we can plug in the image path as an input automating the process of image sampling. This will allow us to extract the colors from the image and remap them according to legend that we trained our model with and take the average number as average temperature.
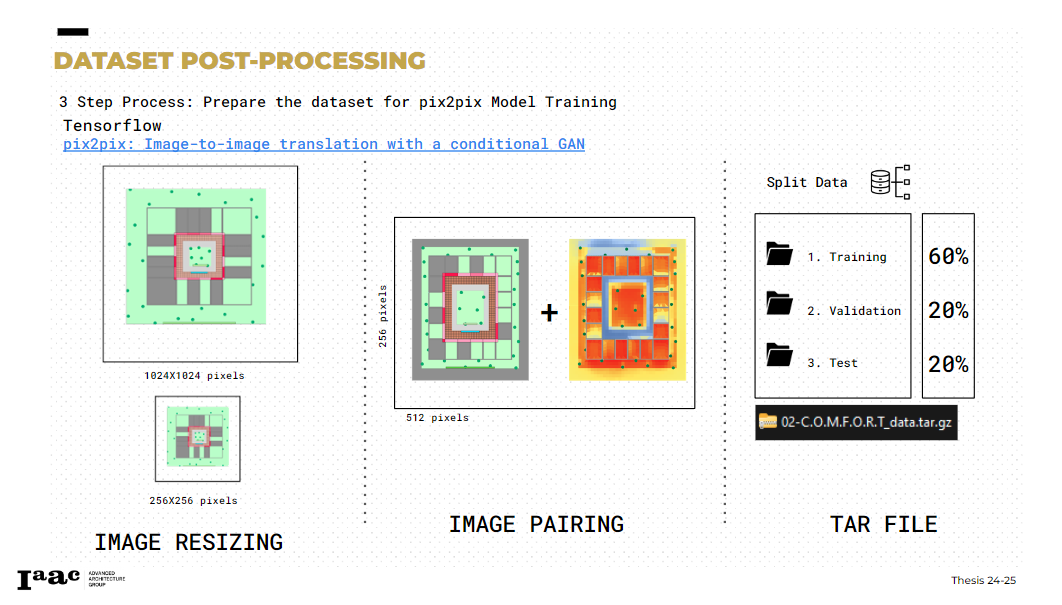
CONCLUSION
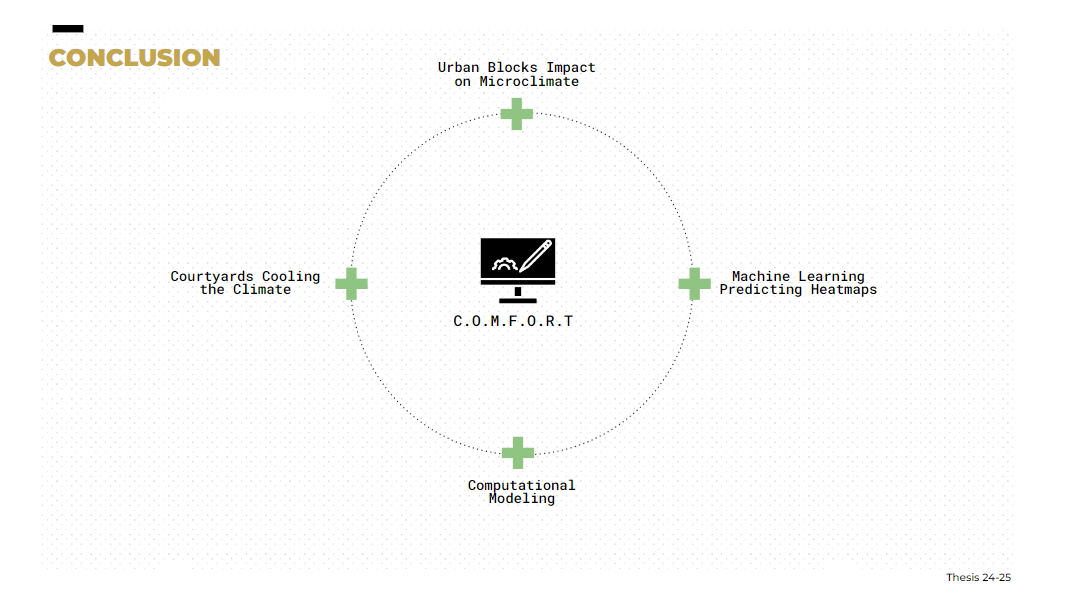
In conclusion we have found ground proof results of the impact of the Urban Blocks on the micro-climate. The Courtyards play a major role too in reducing the built environment and hosting shading elements which can produce cooler environments beneficial to the user physical and mental wellbeing. The machine learning and Computational modeling played a major role in achieving these results.
