

Project Concept
Establishing a Martian food colony around a Mohole, designed based on growth morphology of alfalfa for efficient organization and development using L-systems. These terminologies are further explained below.
Moholes
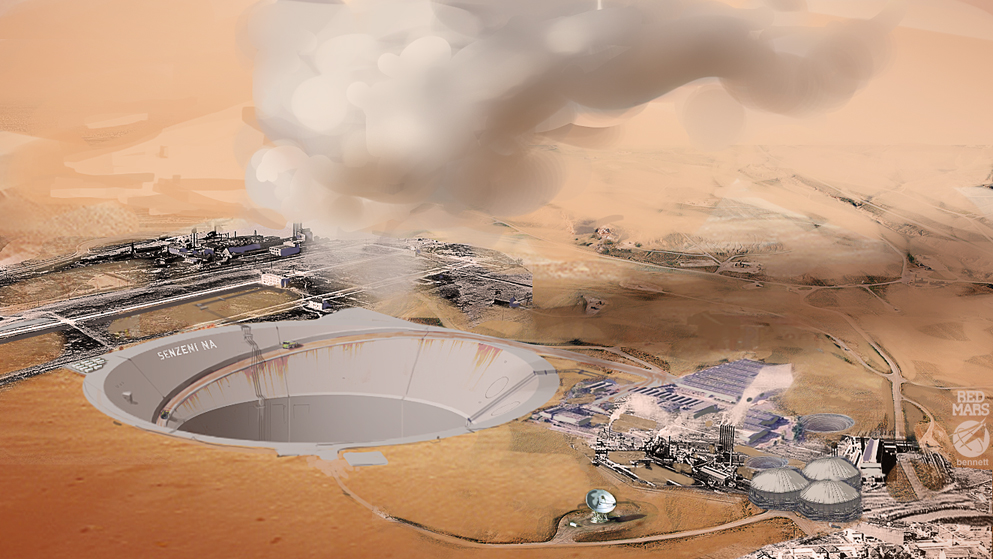
Moholes on Mars are massive cylindrical excavations in the regolith, reaching up to 1 km in diameter and 7 km in depth. With temperatures surpassing 49°C and increased pressure at the bottom, they create a human-friendly environment. The excavation process also extracts valuable ores. Moholes act as natural heating systems and atmospheric ventilators, contributing to terraforming. Their construction near volcanic uprises harnesses updrafts, releasing heat and creating visible thermal plumes. Downwind areas experience clear air, showcasing moholes’ significant role in Martian environmental adaptation.
-Red Mars, Kim Stanley Robinson
We started to look at the concept of the mohole to add a bit more science or fact to them, so we decided to reverse engineer the details from the book to create a formula that was relative to all the factors. The resultant python script through grasshopper is to calculate the heating radius around a Mohole based on several parameters. The script considers the size of the Mohole, the number of homes it needs to heat, and the energy requirement per home to eventually give out a resultant radius.
The calculate_heating_radius function is responsible for computing the heating radius. It takes the following parameters:
- radius: Radius of the Mohole cylinder.
- height: Height of the Mohole cylinder.
- num_homes: Number of homes that need heating.
- energy_per_home: Daily energy requirement per home (in kWh).
- ref_radius: Reference radius of the original Mohole used for comparison.
- ref_height: Reference height of the original Mohole used for comparison.
Constants:
- energy_output: The energy output per square meter from the Mohole’s surface, assumed to be 610 W/m².
- seconds_per_day: The number of seconds in a Martian day (a “sol”), calculated as 24.65 hours × 60 minutes × 60 seconds.
Cylinder Area Calculation:
- The script calculates the surface area (new_area) of the top of the Mohole cylinder using the formula for the area of a circle (? * radius²).
- Scale Factor Based on Area and Height:
- area_ratio: The ratio of the new Mohole’s surface area to the reference Mohole’s surface area.
- height_ratio: The ratio of the new Mohole’s height to the reference Mohole’s height.
- The scale factor is the product of these two ratios, representing how the size of the new Mohole compares to the original one.
Total Energy Requirement:
The total daily energy requirement for all homes is calculated by multiplying the number of homes, the energy requirement per home, and the number of seconds in a Martian day.
Heating Radius Calculation:
The heating radius is calculated using the formula sqrt((area_ratio * height_ratio * energy_output * ? * 10?) / total_energy_required). This formula accounts for the increased heating capacity with larger Mohole size (area and height) but reduced heating capacity with greater energy requirements.
Input Validation:
The script checks if the provided base_pt (base point for the Mohole) is a valid Plane and that other inputs like radius, height, num_homes, and energy_per_home are positive.
Cylinder and Heating Circle Creation:
A cylinder representing the Mohole is created, extending in the negative Z direction from the origin point. Its dimensions are based on the given radius and height.
A circle representing the heating radius is created at the origin point with the calculated radius.
Outputs:
- a: The circle representing the heating radius.
- b: The cylinder representing the Mohole.
Formula Explanation
The key formula in the script calculates the heating radius:
\text{heating_radius} = \sqrt{\frac{\text{area_ratio} \times \text{height_ratio} \times \text{energy_output} \times \pi \times 10^6}{\text{total_energy_required}}}
- Area Ratio (area_ratio): Compares the new Mohole’s surface area to that of a reference Mohole. A larger area ratio implies a larger Mohole, capable of heating a larger area.
- Height Ratio (height_ratio): Similar to the area ratio, but for the Mohole’s height. A taller Mohole can also heat a larger area.
- Energy Output (energy_output): The constant energy output per square meter from the Mohole’s surface.
- Total Energy Required (total_energy_required): The sum of the energy requirements for all homes. Higher energy requirements or more homes reduce the heating radius.
The formula incorporates these factors to calculate the heating radius. A larger Mohole (in terms of area and height) increases the heating radius, while higher energy requirements per home or more homes decrease the heating radius. The result is a balance between the Mohole’s capacity and the demand placed upon it.
L-System
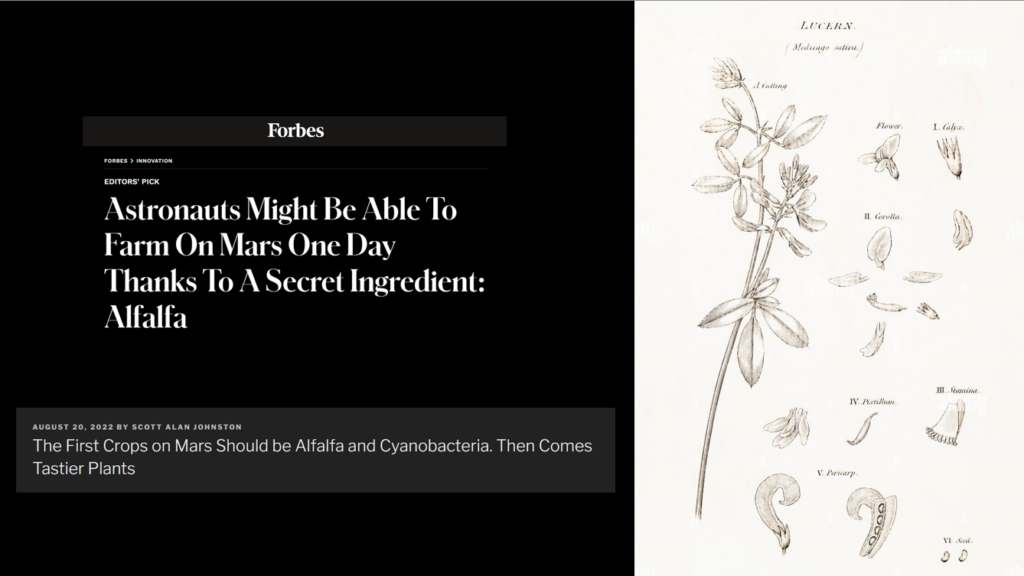
Our main intention of solving how we are approaching martian ground Is based on the abstraction of the growth logic of plants, inspired by diagrams made by Charles Waldheim and Agrarian Urbanism. This looks at an urban plan that is a reflection of the place or in particular, the dominant food culture of the place. Designing on a new planet without a history we started to think about what sort of crop could start to shape the future culture of the colony, which led to the discovery of the Alfafa plant
L-systems, also known as Lindenmayer systems after their creator Aristid Lindenmayer (1925-1989), enable the creation of intricate forms through iterative processes. They employ a formal mathematical syntax where a starting sequence of symbols undergoes repeated transformations based on a set of rules, with the outcomes utilized to produce geometric shapes. This allowed us to recreate the growth morphology of the Alfafa plant for development of our colony urban plan.

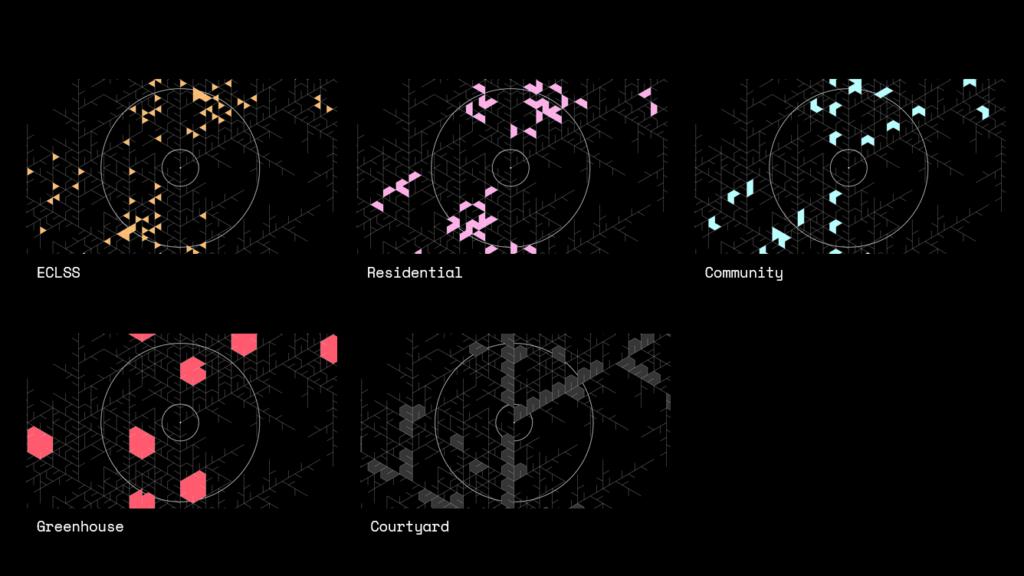
From that we start to derive the bounded regions as our programmable space within the resultant cluster, and from those regions we start to define an area range for the different programs, for example 33m2 to 50m2-Residential Units, and a different area zoned for the courtyards for light penetration. Thereby automating the plan and zoning.
Form Finding
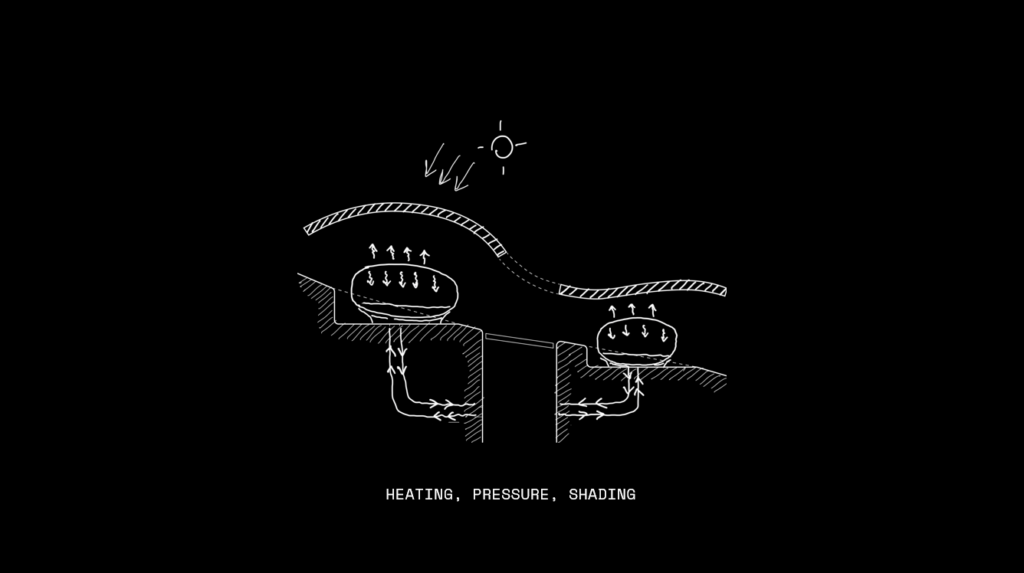
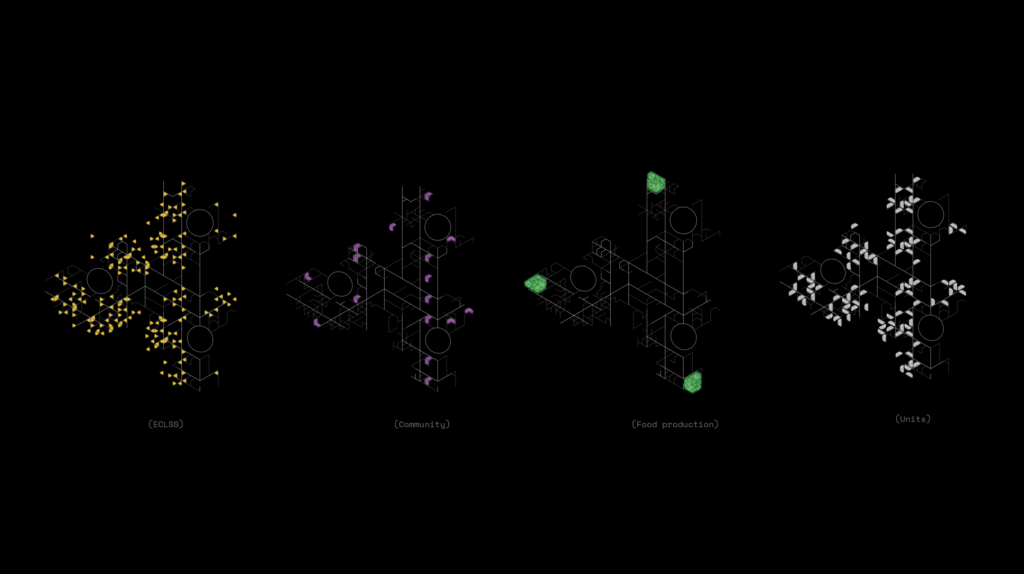
Our Martian adaptation approach caters for 3 different conditions, heating provided by the Mohole excavation through the ground, pressure from the inflatable modules, and shading from the canopy. These 3 conditions start to dictate the 3 layers of our project and the work divisions we use to collaborate.
To get the units, we used the l-system lines, offsetting and filleting it to create the developable area, to create a double layered mesh, then we added seams and finally the pressure, using a floor to force the inflatable to only go up.
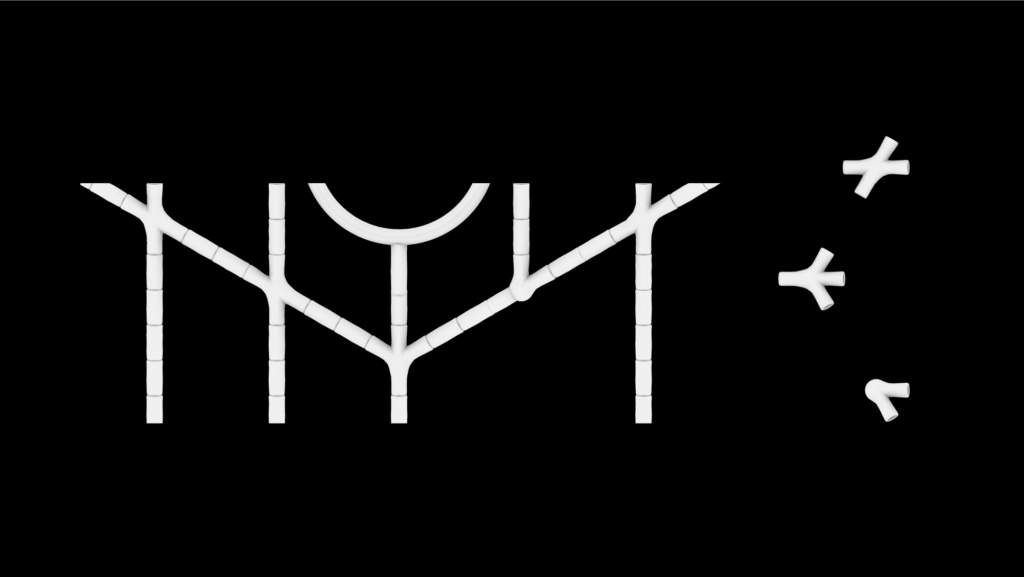
The expansion of the colony and therefore the connection networks follow the path traced by the l systems. For the whole system we require 3 different type of multi direction connections

From the lines of the L-systems, we start to generate the canopy, first by thickening the lines, then extracting the moholes, and the zoned courtyard spaces for the openings, making that a mesh and subdividing into a finer mesh
Collaborative Workflows
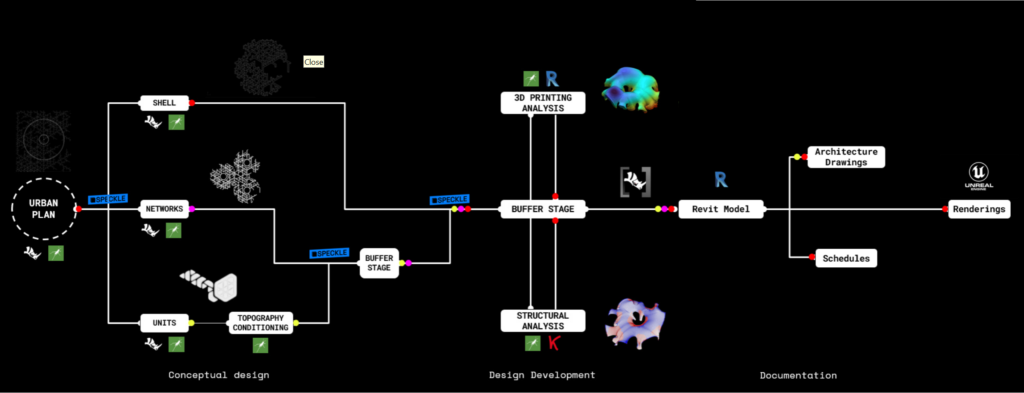
The workflow starts with the urban plan which dictates the entire project so that’s frozen in the first stage, then we divide the urban plan in 3 sections, the shell, the networks and the units, the unit geometry dictates the topography more than the other parts so the same group member works on the topography conditioning. The first buffer stage happens with the units and the netoworrks for clash detection against the topography while the shell development progresses a bit more. The second buffer stage inclorporates the shell, where we check against wider geometry clashes. From this model we develop the design mainly for the shell, with 3d printing analysis using grasshopper and revit, and structural analysis using grasshopper and karamaba. After design development of the parts we send this full model to revit using rhino inside. From this revit model we start the documentation of the project and schedules and proceed to the rendering stage.

In terms of speckle architecture, the stream was divided into 5 main branches, the urban cluster and program branch containing curves, topography and mohole branch containing meshes, the inflatable units containing meshes, the networks containing meshes and the canopy mesh. We federate this into one model to push to the wider program stream.
Revit Documentation

The final roof form of the canopy is generated using the zoned courtyard spaces as the only void within the canopy to avoid harmful radiation on the unit modules, The habitat is divided into 3 shells with a hole in the middle where the moholes are located

The network plan shows the derivative form of the networks from the L-systems and how that sits within the canopy. Using rhino inside we were able to bring this form into the Revit model for documentation with metadata attached to it.
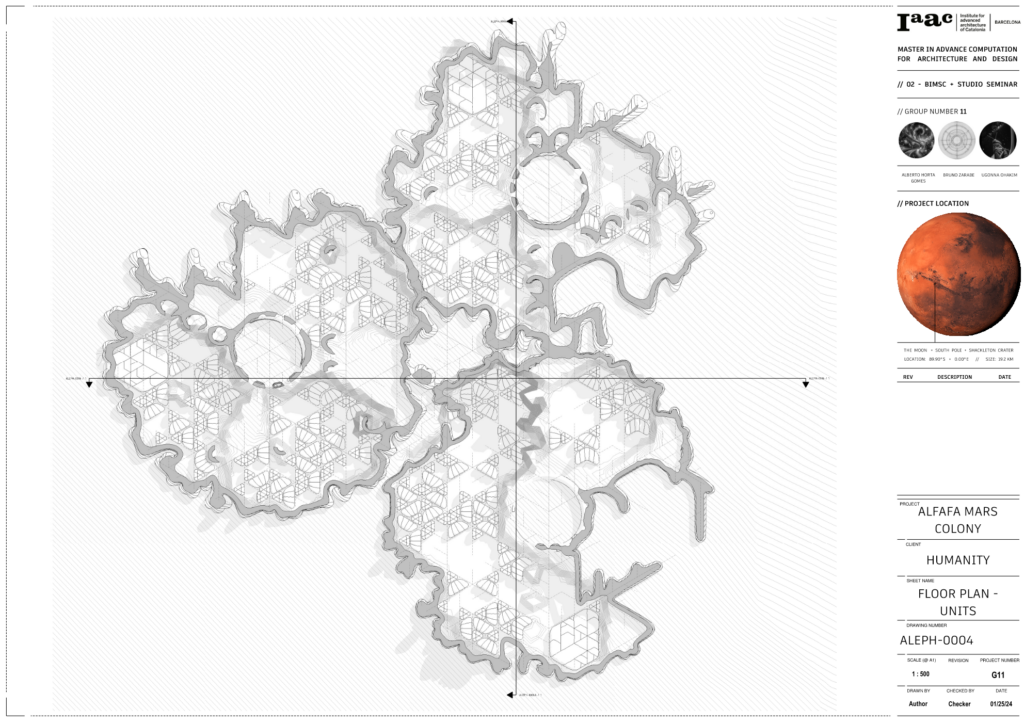
The unit plan shows how the unit sits within the canopy.

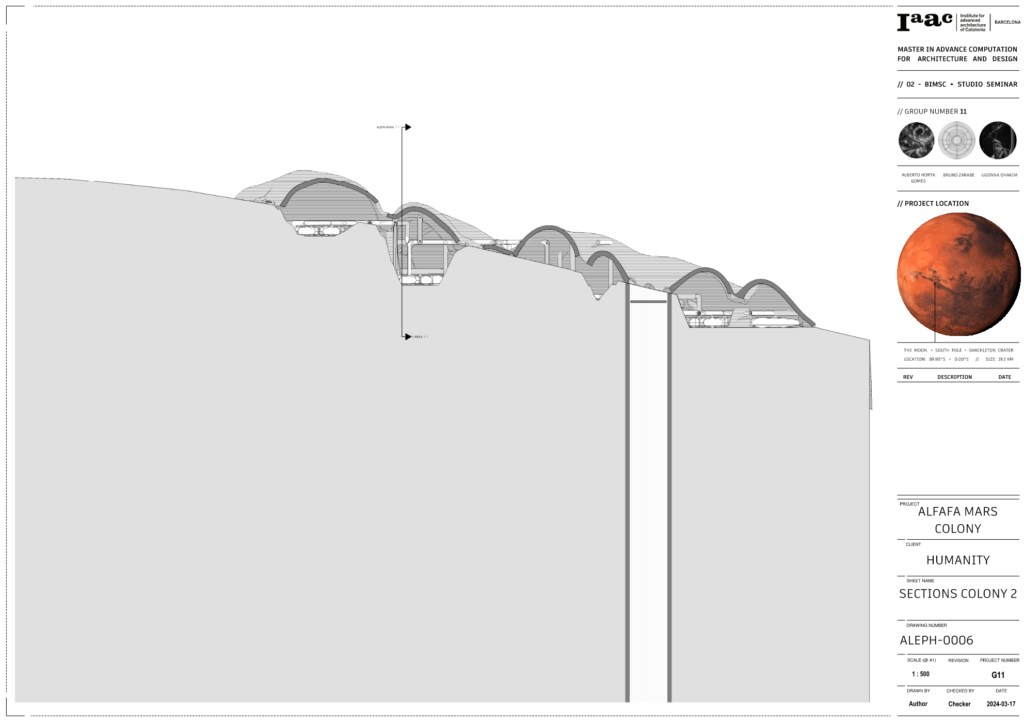
This section shows the correlation of Colony 2 with the mohole.
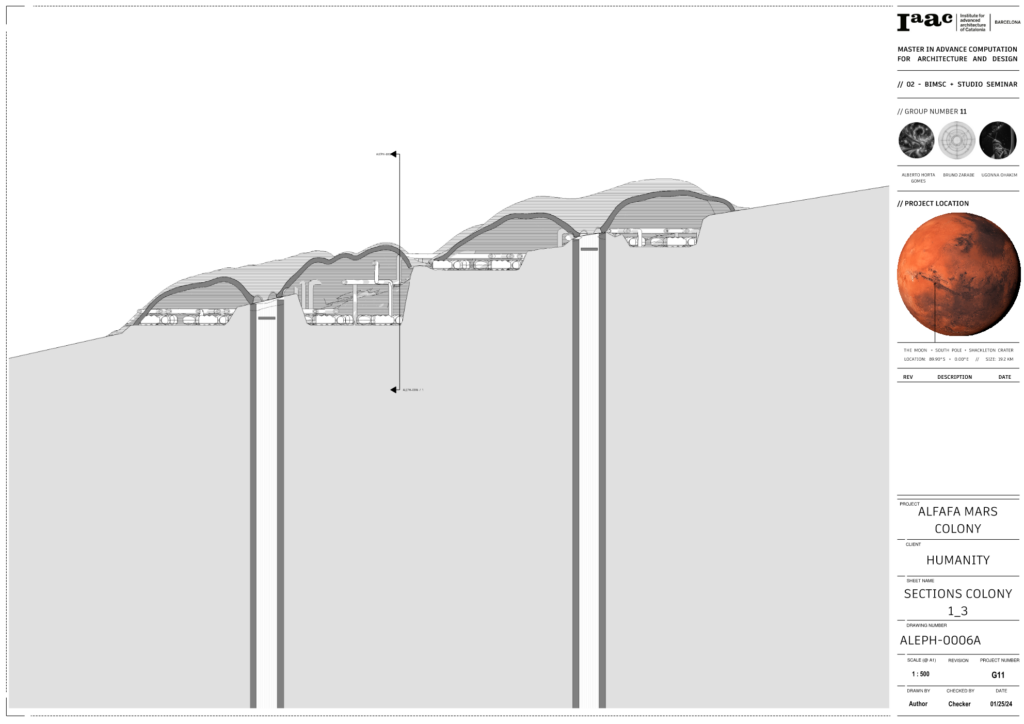
This section shows the correlation of Colony 1 and 3 with its respective mohole.

Using rhino inside we were able to bring in the units with the unit type metadata attached which made it possible to color code the units based on type. We also calculate the final unit areas per type in the schedule.
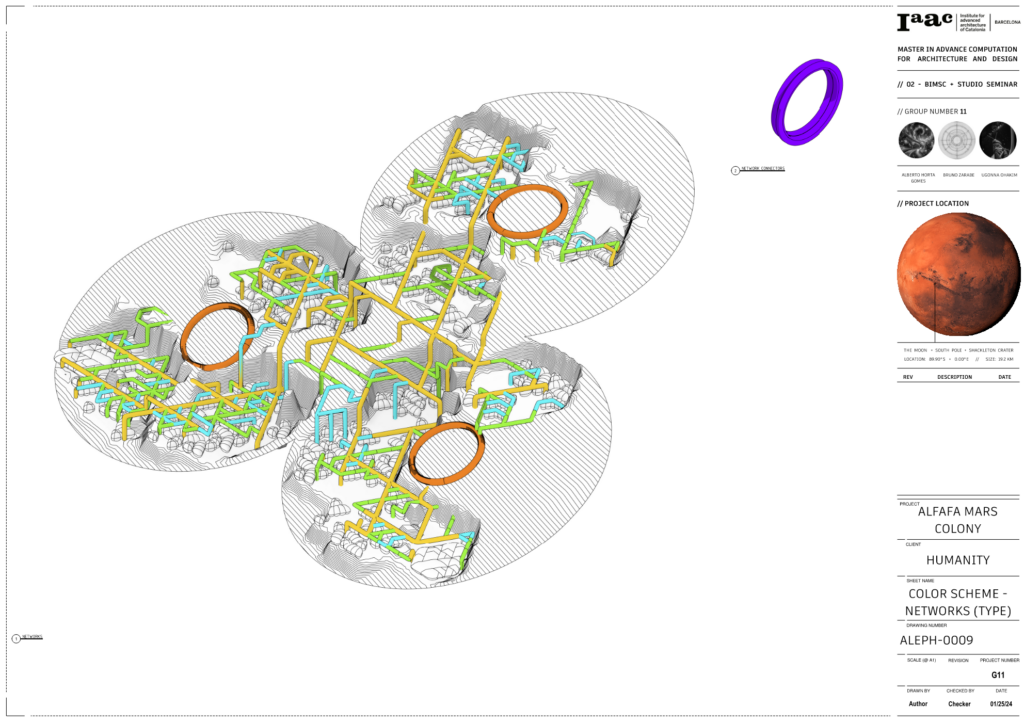
We were also able to color code the networks based on Primary, Secondary, Tertiary and Personal routes based on the metadata attached to them using rhino inside.

We explored the formal language of the canopy, in this version we did a study of the form of canopy generated from discrete 3d printed plates that join together. We can start to get the schedules of the count of each unique part and areas per part
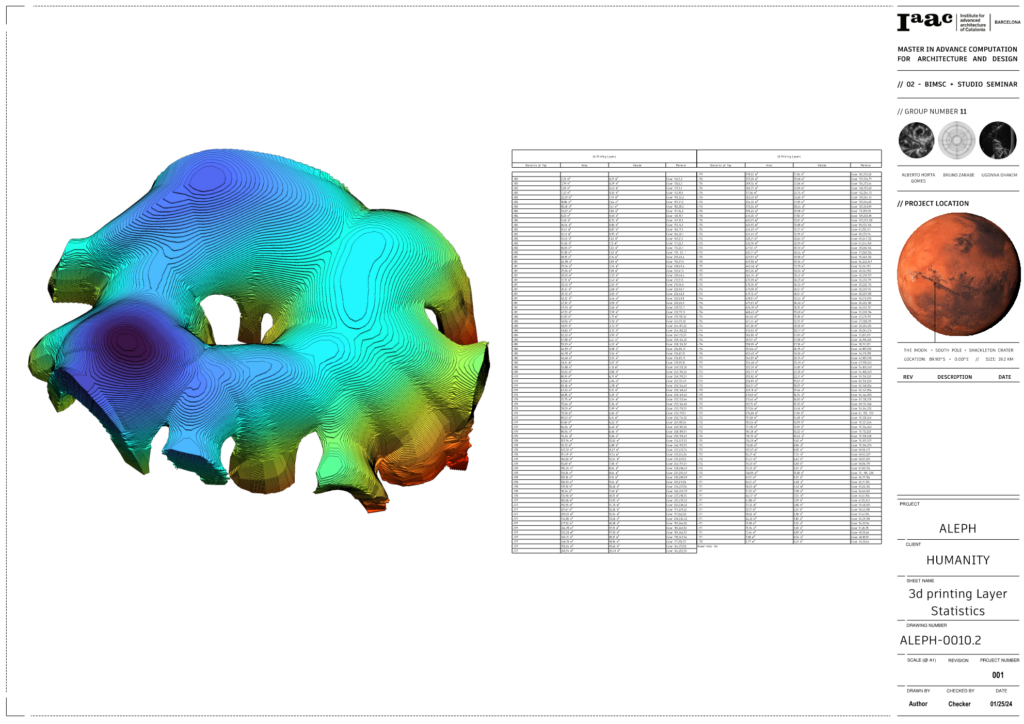
The chosen approach was a more monolithic 3d printed shell due to more protection from radiation, in this analysis we looked at segmenting the 3d printed layers based on a 20mm layer height, from there, we can get the area of each layer and volume, that can start to point to how long it may take to get printed if other factors are considered.

