Translating Point Clouds into BIM Geometry
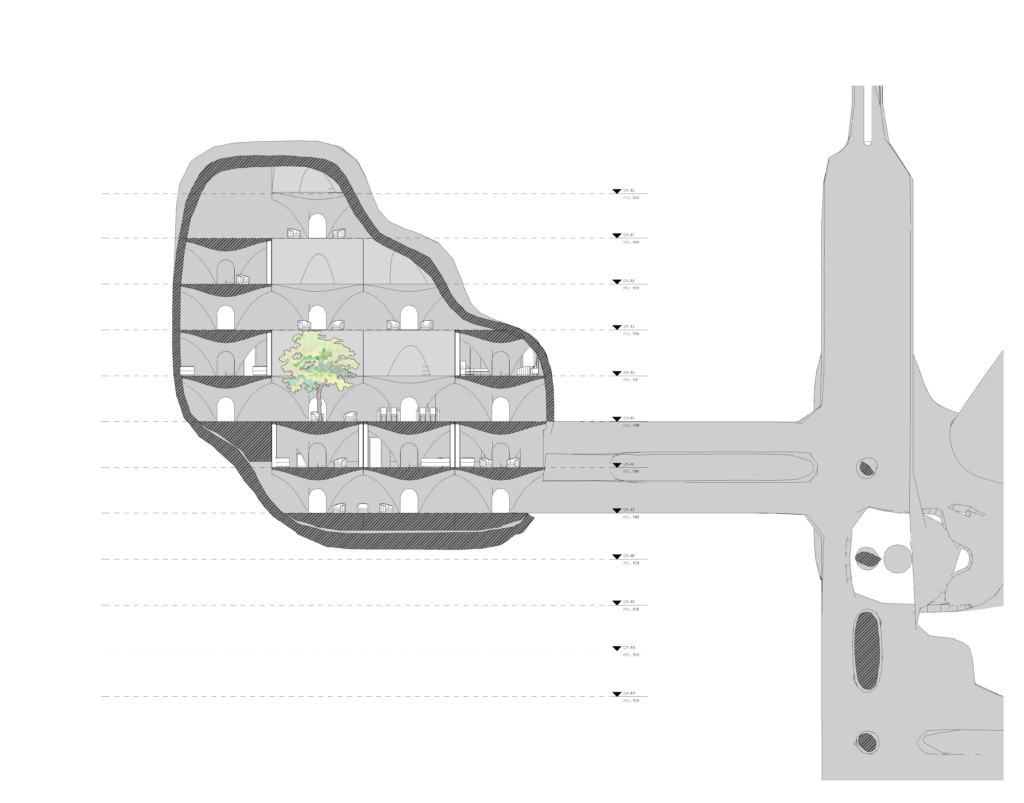
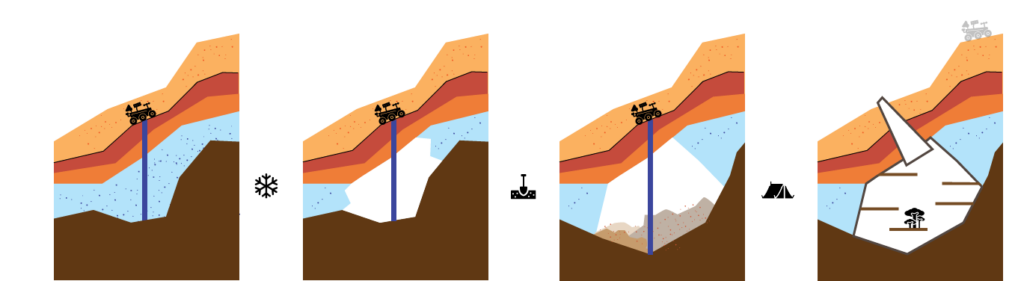
For the first settlers on Mars, we have envisioned a colony of Aqua-Miners with the primary task of harvesting water as a resource from the ice beneath Mars’ surface, storing it and recycling it for sustainable use. Our approach to this problem has been exceptionally data-driven. Our idea is to explore the best locations for ice mining, extract the ice and use the leftover cavity as the habitat for the colony’s first settlers. This underground habitat of caves would ensure minimum intervention of the settlers by occupying already existing mine cavities. This underground habitat would also ensure better protection from surface radiation.
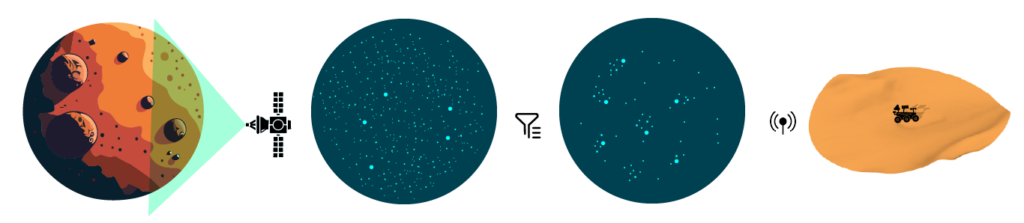
To establish the best locations for digging on our chosen site, we used NASA’s Mars Water Maps as our data point. We extracted the scanned images and used them to sample a point cloud on our site for its resource values. These values were then filtered through a series of operations to give us bundles of points of certain minimum “ice values” within a certain distance of each other. These bundles would form a location for digging and would eventually form our caves – a unit of social habitat. Each cave could potentially host 30-50 people.
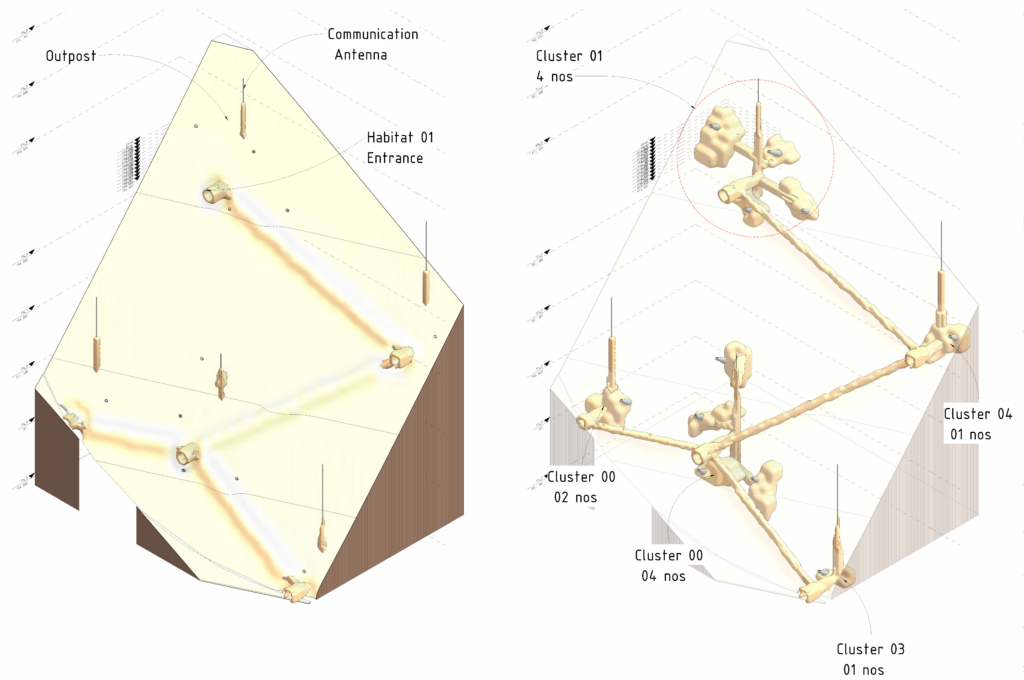
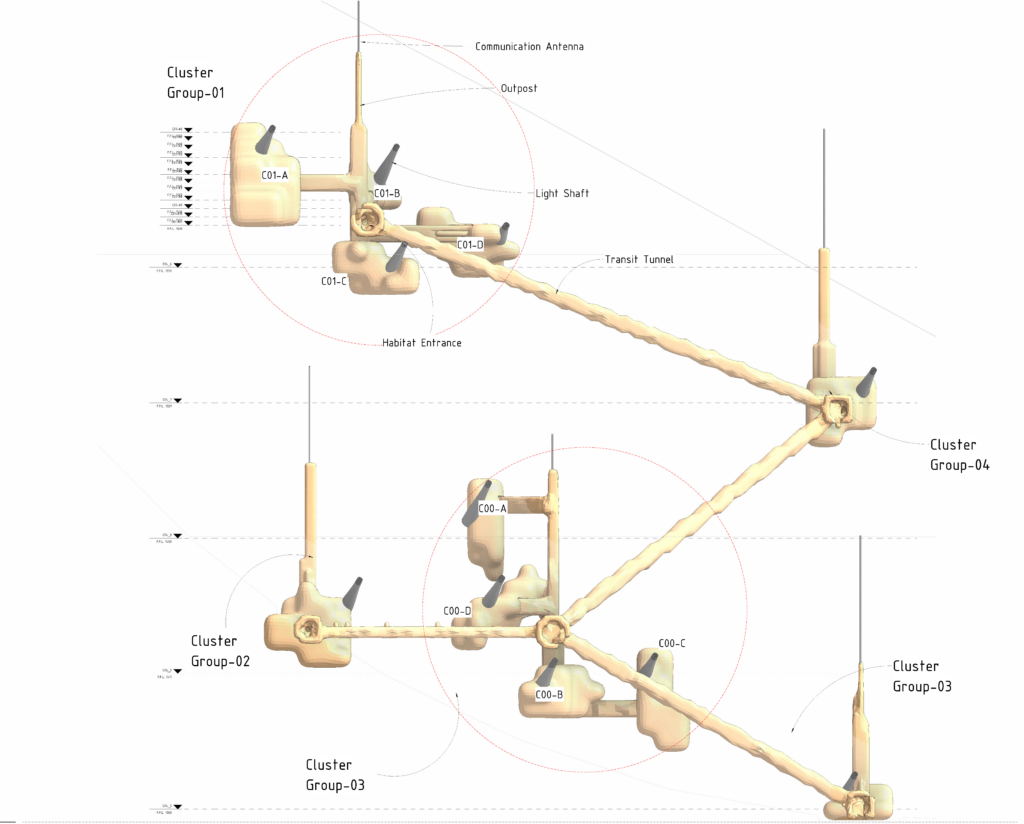
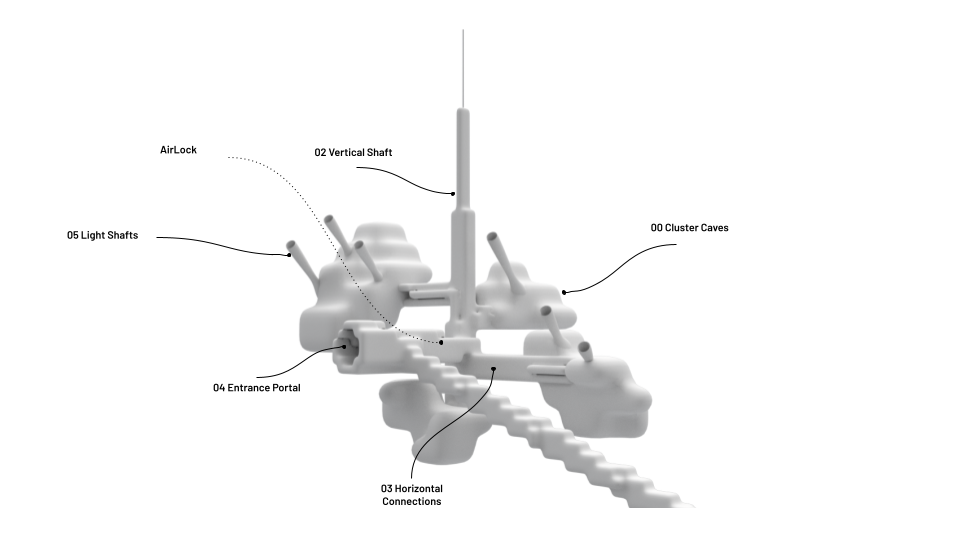
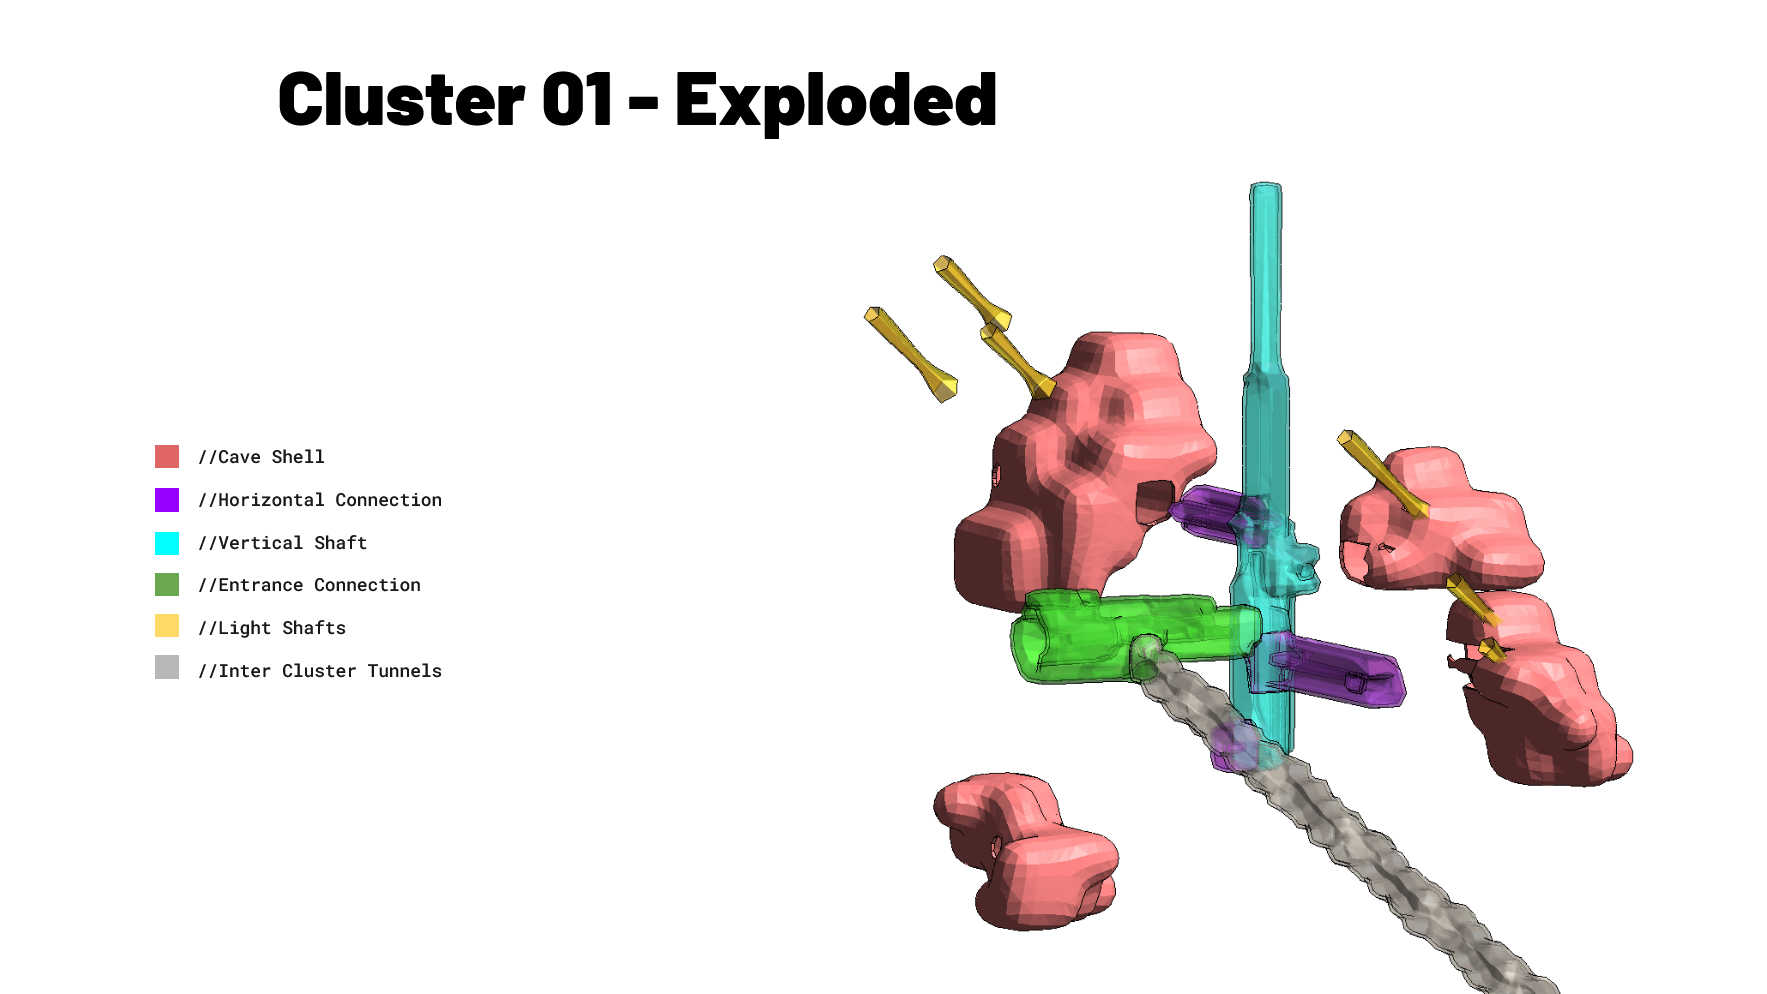
Once the caves are formed, we then run another series of operations to group a number of caves within a certain distance from one another for a “cluster of caves” and have common connections and be identified as one. For instance, 3-4 caves within 300m of each other would have a common Vertical shaft and a common Entrance portal to the Martian surface. This what a typical cluster of caves looks like:
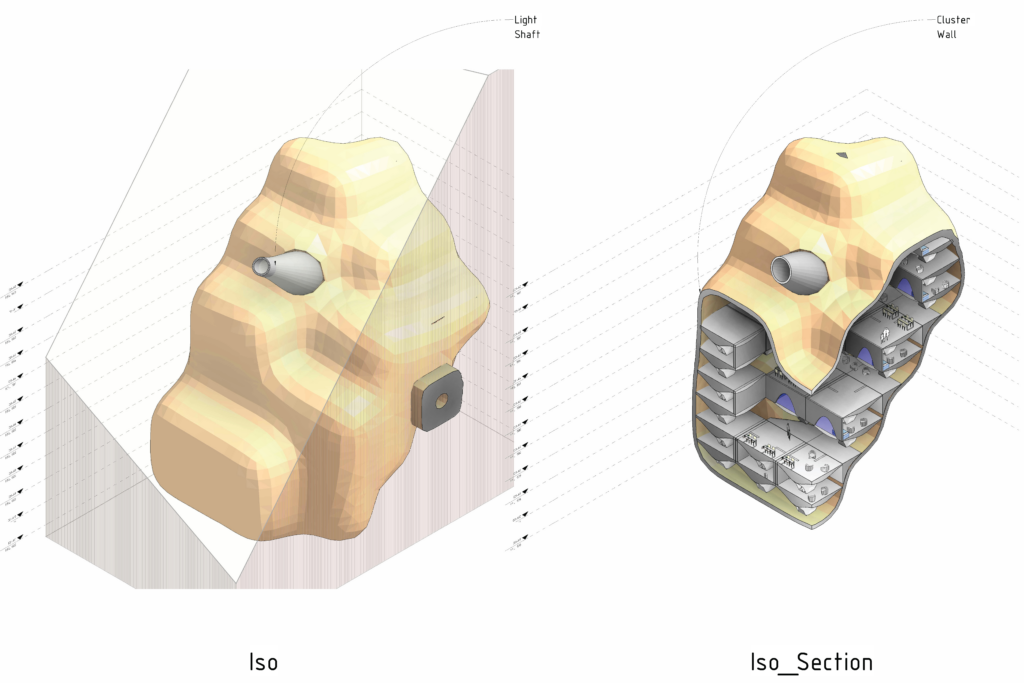
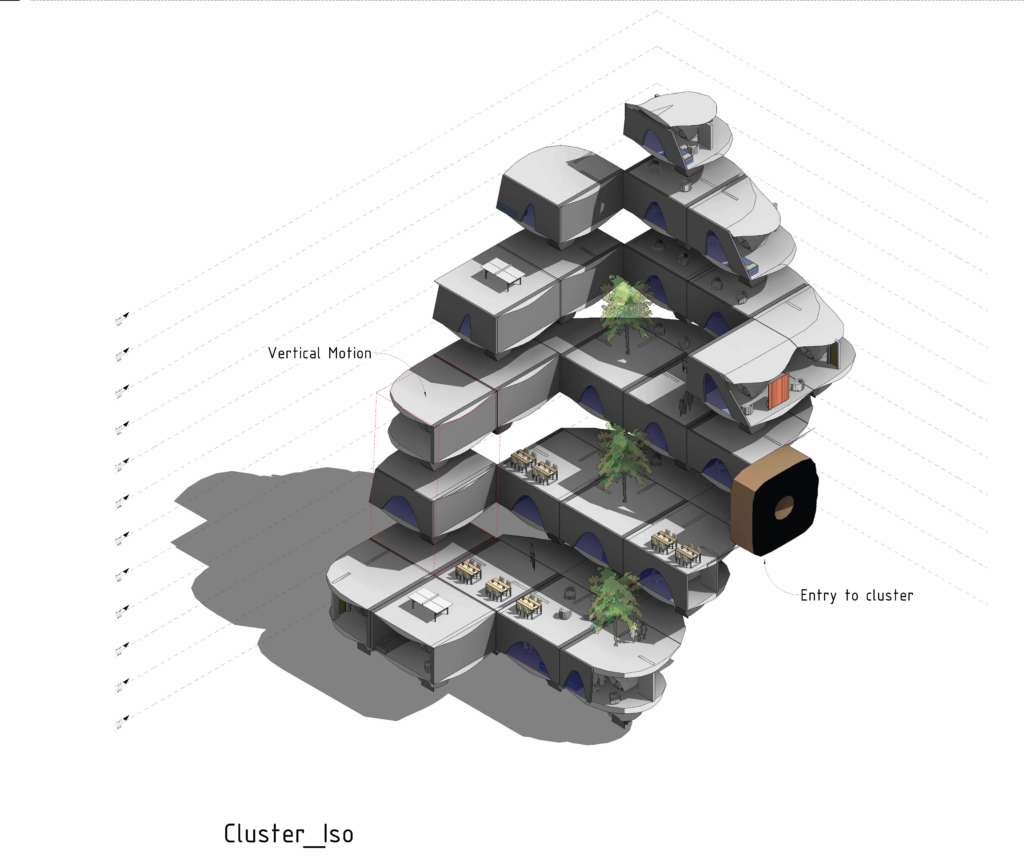
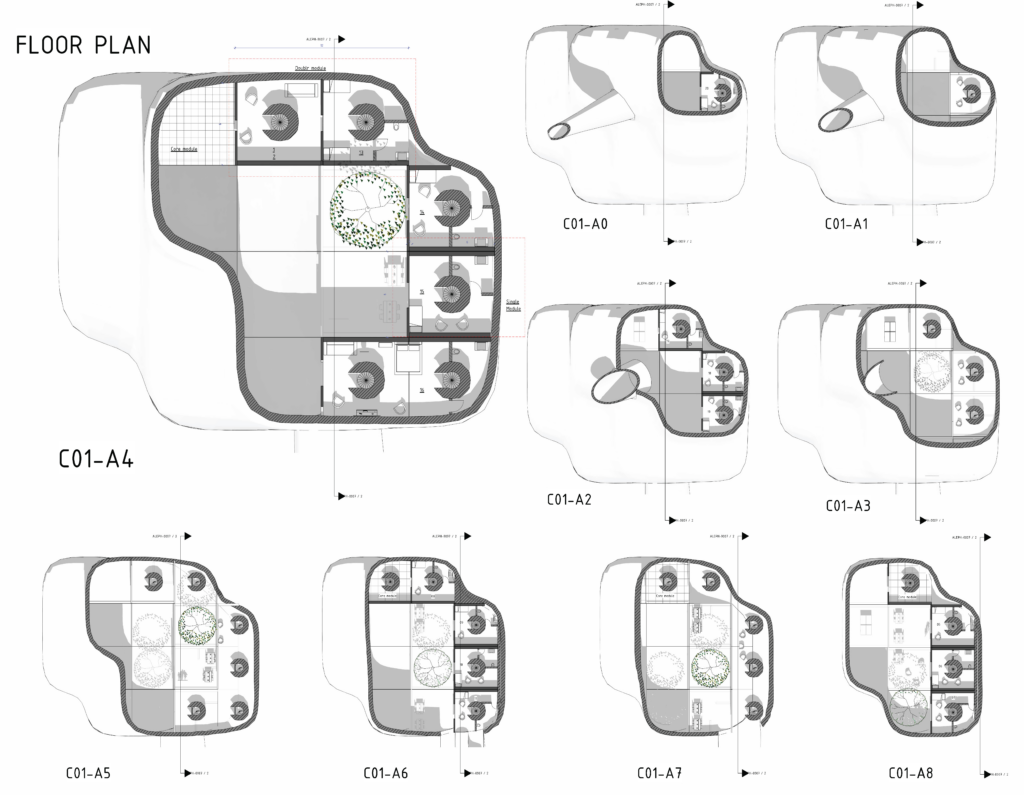
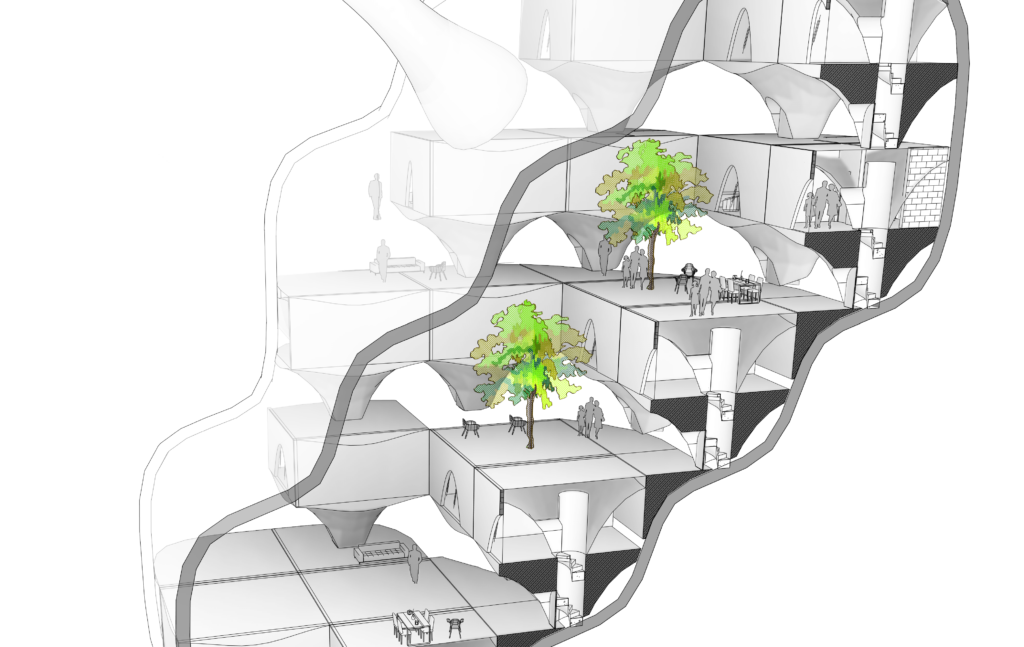
The regolith extracted while extracted the ice is then used to 3D-print the habitable units within the caves. These units adapt to the individual cave, its form and location in the network of the caves, as each cave also hosts a light shaft to the outside.
These 3d printed modules were translated into BIM geometry as Walls and Floors, elements like stairs for vertical circulation were also added in the Revit and then streamed onto our speckle stream for collaboration.
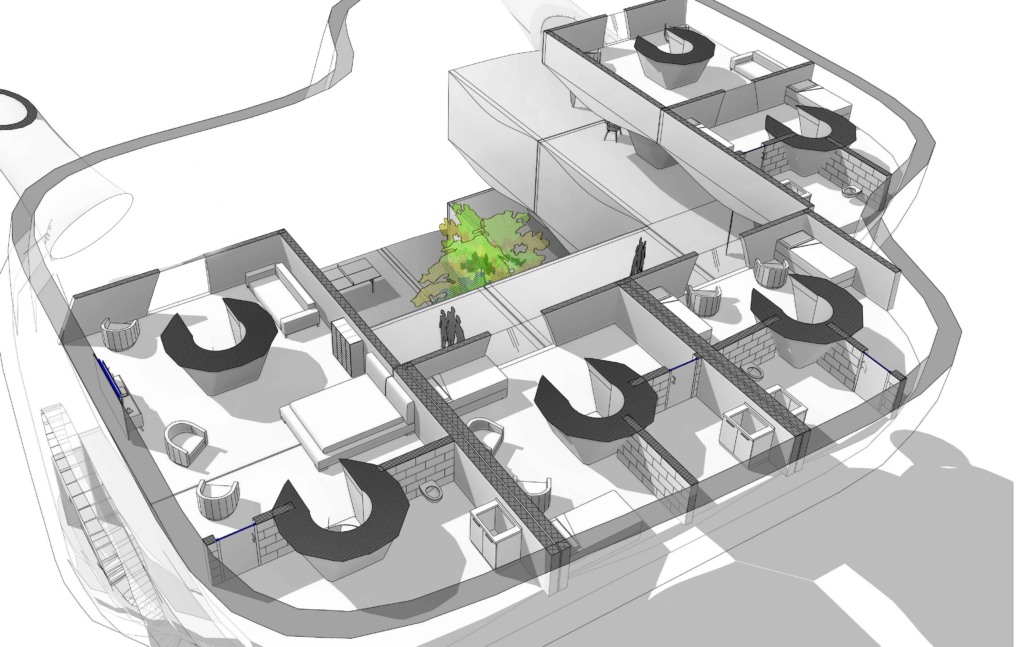
Internal layouts were also designed in Revit using families and location information from the Grasshopper script. All this information was BIM encoded and later relayed to our Speckle stream.
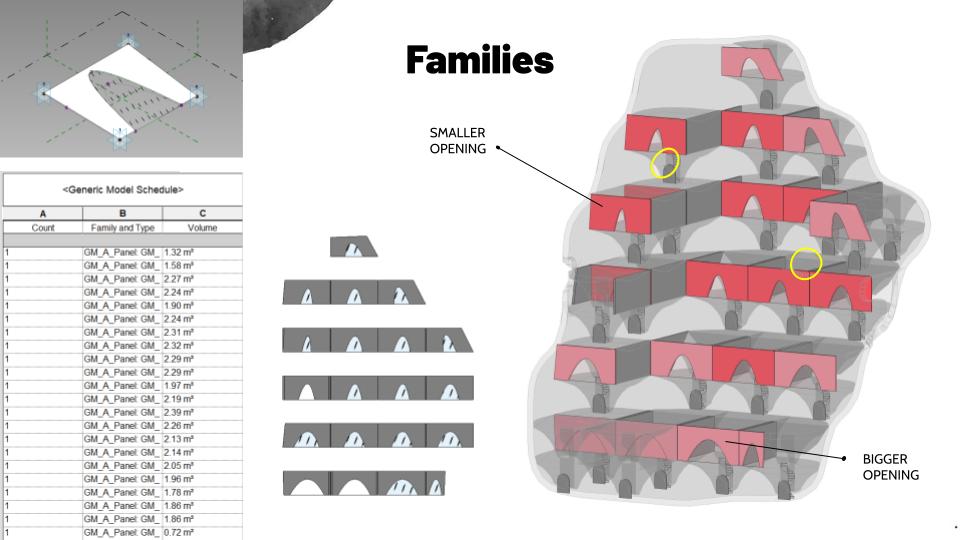
Each Module is unique as it hosts an adaptive window panel which reacts to its context and adjusts its size based on its distance from the available light shaft in the cave. The further away a window is from the light source, the bigger the window panel will be. Here’s a schedule of the windows of one typical cave:
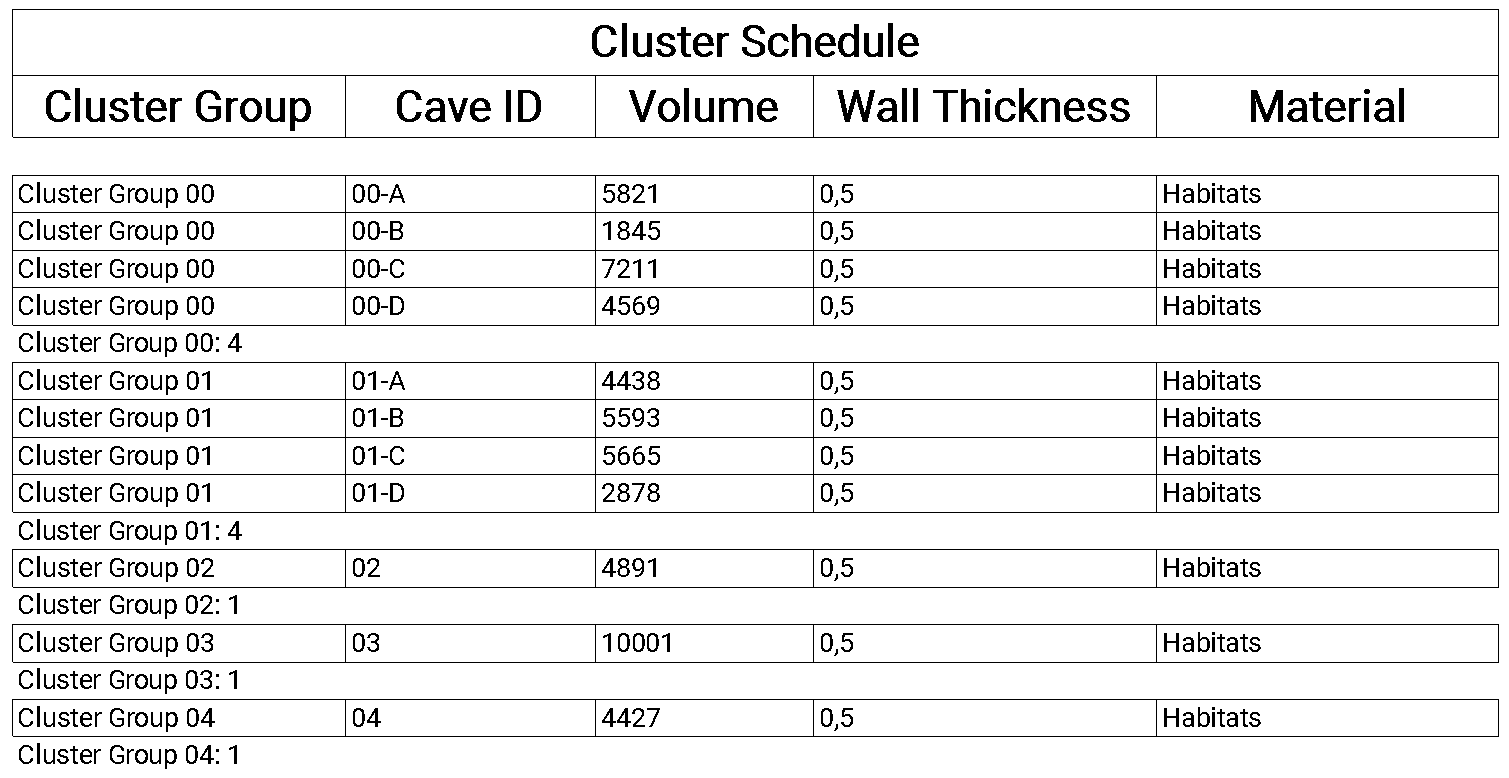
Using Rhino.Inside we were able to relay the identity of each cave relevant to its cluster across to our BIM model. Here’s a schedule of the caves, their volume and the cluster grouping.
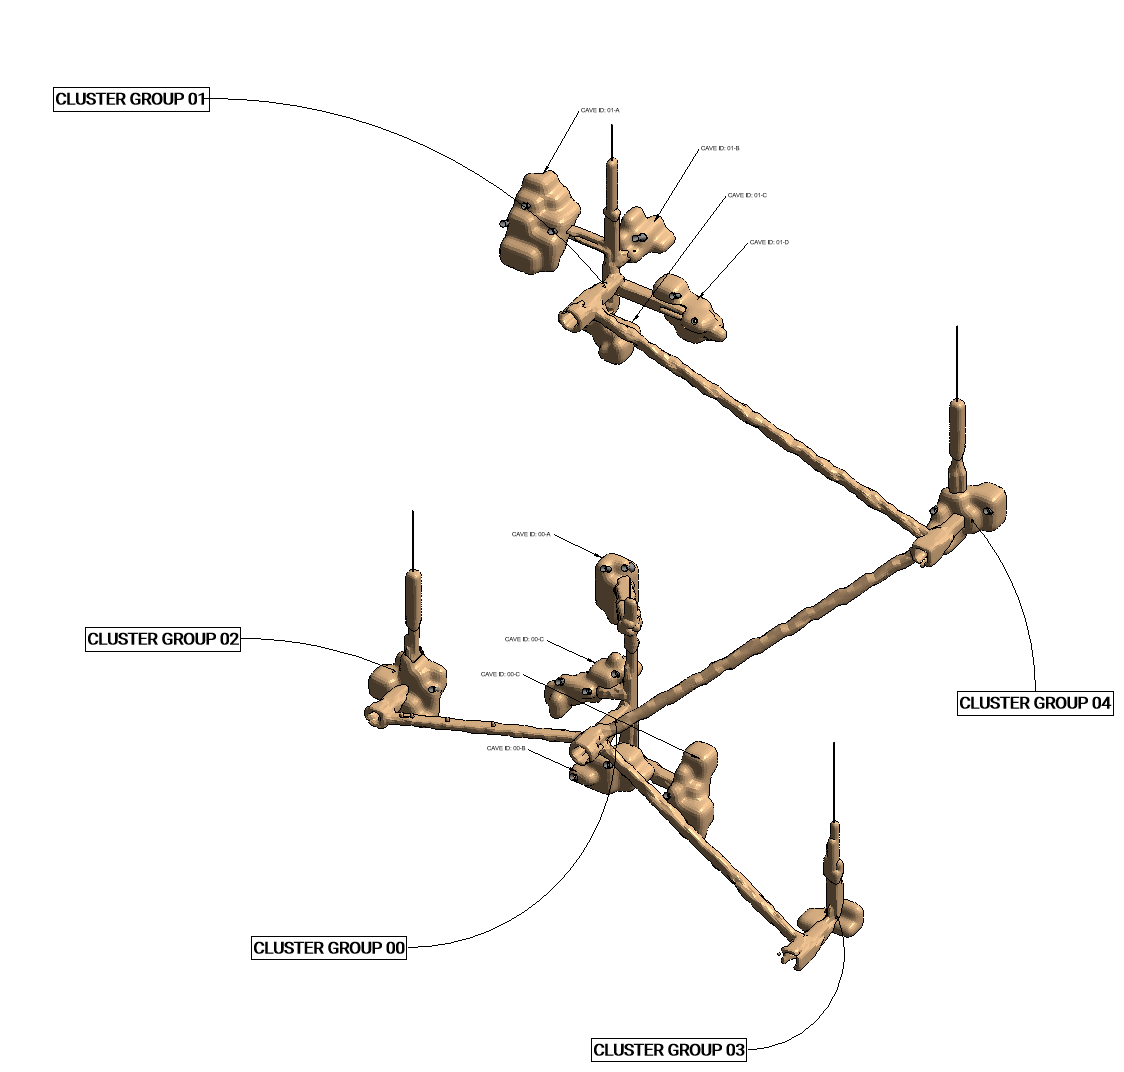
Within a group cluster of caves, each element as described earlier has been exported as individual BIM geometry, tagged with its metadata to help distinguish the elements and if needed group them per cluster.
Following is some documentation we have generated for our design development: