
Introduction – The Idea
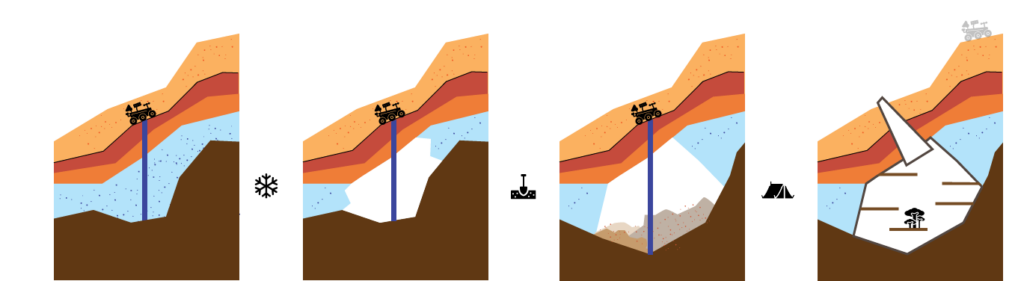
For the first settlers on Mars, we have envisioned a colony of Aqua-Miners with the primary task of harvesting water as a resource from the ice beneath Mars’ surface, storing it and recycling it for sustainable use. Our approach to this problem has been exceptionally data-driven. Our idea is to explore the best locations for ice mining, extract the ice and use the leftover cavity as the habitat for the colony’s first settlers. This underground habitat of caves would ensure minimum intervention of the settlers by occupying already existing mine cavities. This underground habitat would also ensure better protection from surface radiation.
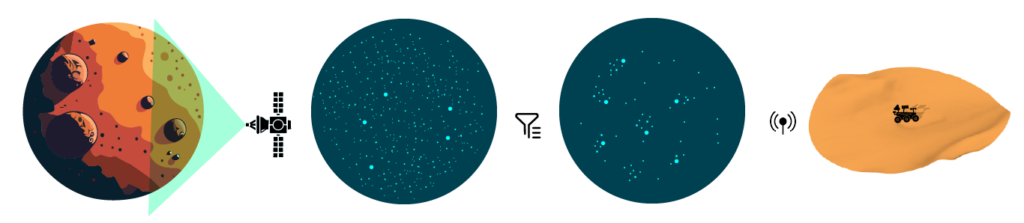
To establish the best locations for digging on our chosen site, we used NASA’s Mars Water Maps as our data point. We extracted the scanned images and used them to sample a point cloud on our site for its resource values. These values were then filtered through a series of operations to give us bundles of points of certain minimum “ice values” within a certain distance of each other. These bundles would form a location for digging and would eventually form our caves – a unit of social habitat. Each cave could potentially host 30-50 people.
Once the caves are formed, we then run another series of operations to group a number of caves within a certain distance from one another for a “cluster of caves” and have common connections and be identified as one. For instance, 3-4 caves within 300m of each other would have a common Vertical shaft and a common Entrance portal to the Martian surface. This is what a typical cluster of caves looks like:
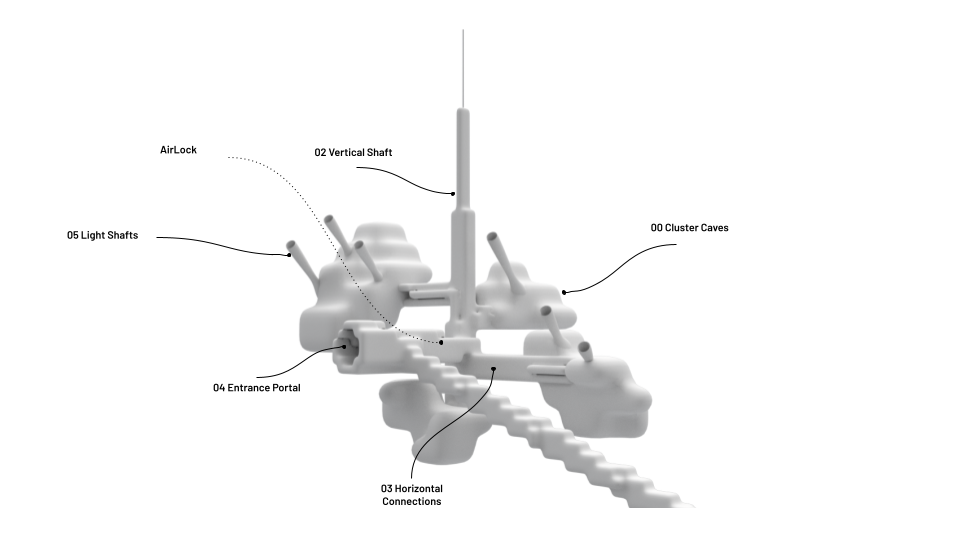
The regolith extracted while extracted the ice is then used to 3D-print the habitable units within the caves. These units adapt to the individual cave, its form and its location in the network of the caves, as each cave also hosts a light shaft to the outside.
Workflow – The Process
In the Initial Stage, we had the Idea of a non-dependent workflow. Eventually, due to our computational approach, we made a dependent workflow and branches based on the Project element. Till Stage 02 we have our mesh exploration as different commits and the latest commit is reviewed and moved to a further stage.
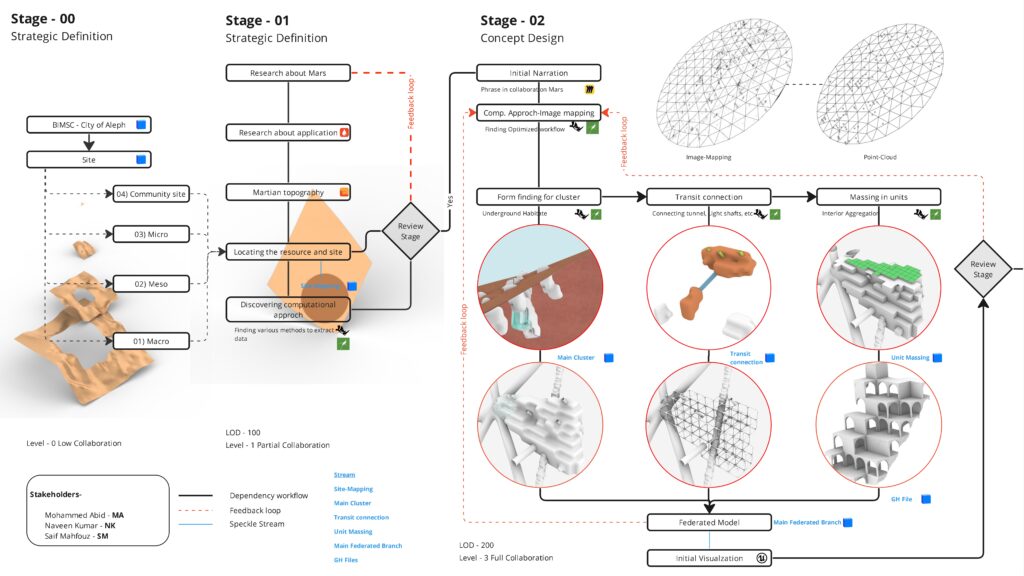
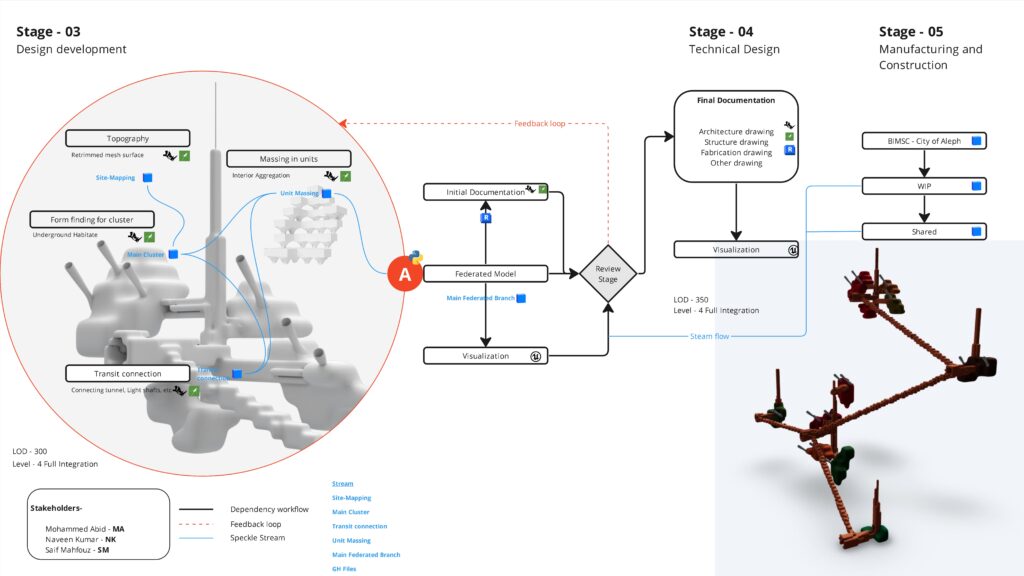
Stage 03 has the final mesh output which is made into a federated model, here we used a Python script to merge the latest commits to the federated branch. And this branch is pushed to the final Mainstream. Also, the federated branch is used for Revit documentation from Rhino inside and final visualization from unreal.
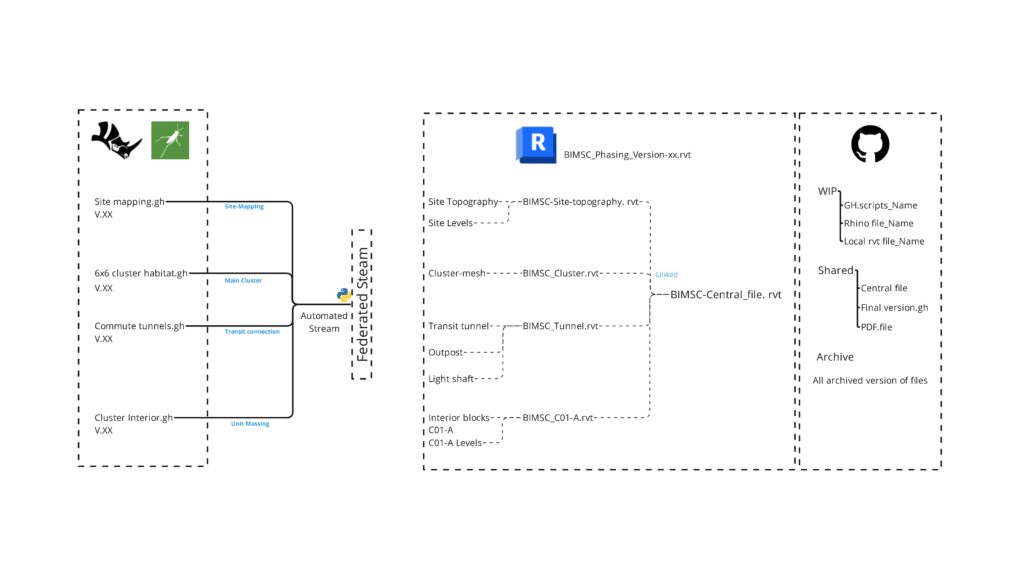
This is our versioning and CDE. we used Git internally to have a common repository. All the files are saved corresponding to the phase. The Revit files are also saved with their respective Geometry type and linked via a central file for documentation.
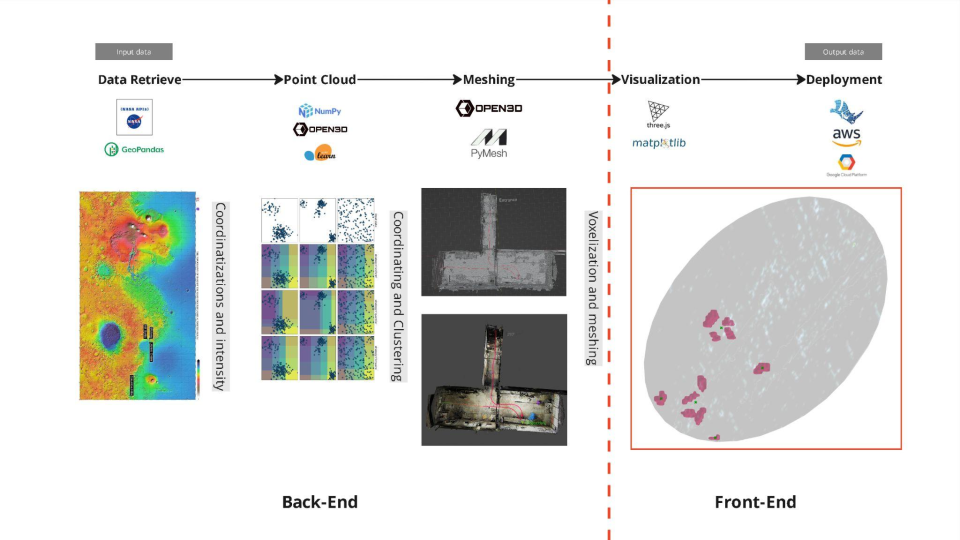
Automation – The Research
We envisioned how would a fully automated process for the form generation be structured, by simply importing the geographical location as coordinates from NASA´s API and getting the the final Cluster/Cave formations under the ground as an output.
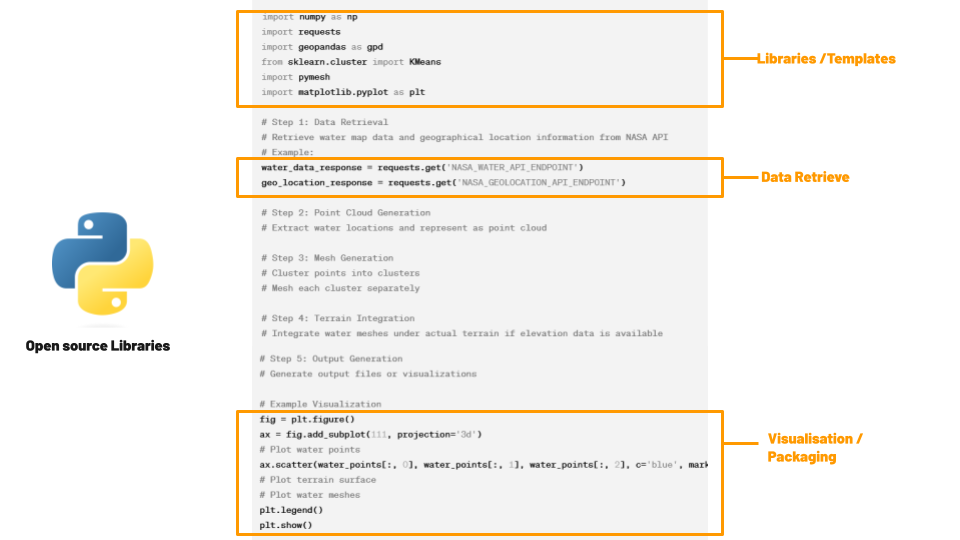
we suggested a Code Structure based on Open-source Python Libraries that would start by retrieving geographical and water location Data From NASA´s API and then create a point cloud based on the water location and intensity which will then be Meshed and voxelized into the Final geometry. The geometry with then be Packaged in downloadable File formats and rendered for the App´s Front End.
Aquamines – the Web App
Since our process was effectively data-driven, we set out to automate the entire process or as much as could be done. In principle, we wanted to use the data from NASA’s MMars Water Map to be able to trigger operations to generate the Aquamines or the habitable caves with average set parameters. The purpose of this app would be to enable Space Agencies to estimate the volume of aqua yield, and available cavities over time and consequently estimate settled capacity with just the input from NASA’s satellite records.
We identified the biggest obstacle as the ending and decoding of the image data that will be received by the web app for image sampling as we had set for the offline Gh code. Here we use ShapeDiver’s component to extract the bitmap from a URL and then use its image sampling to extract pixel data in terms of its RGB values.
We primarily use the web app to collect information and pass it on to Rhino.Compute for sampling the image, based on the site mesh, relay the geometry back to the web app, parcelled with important metadata about the nuk=mber and volume of caves to help identify the settler capacity on the given conditions.
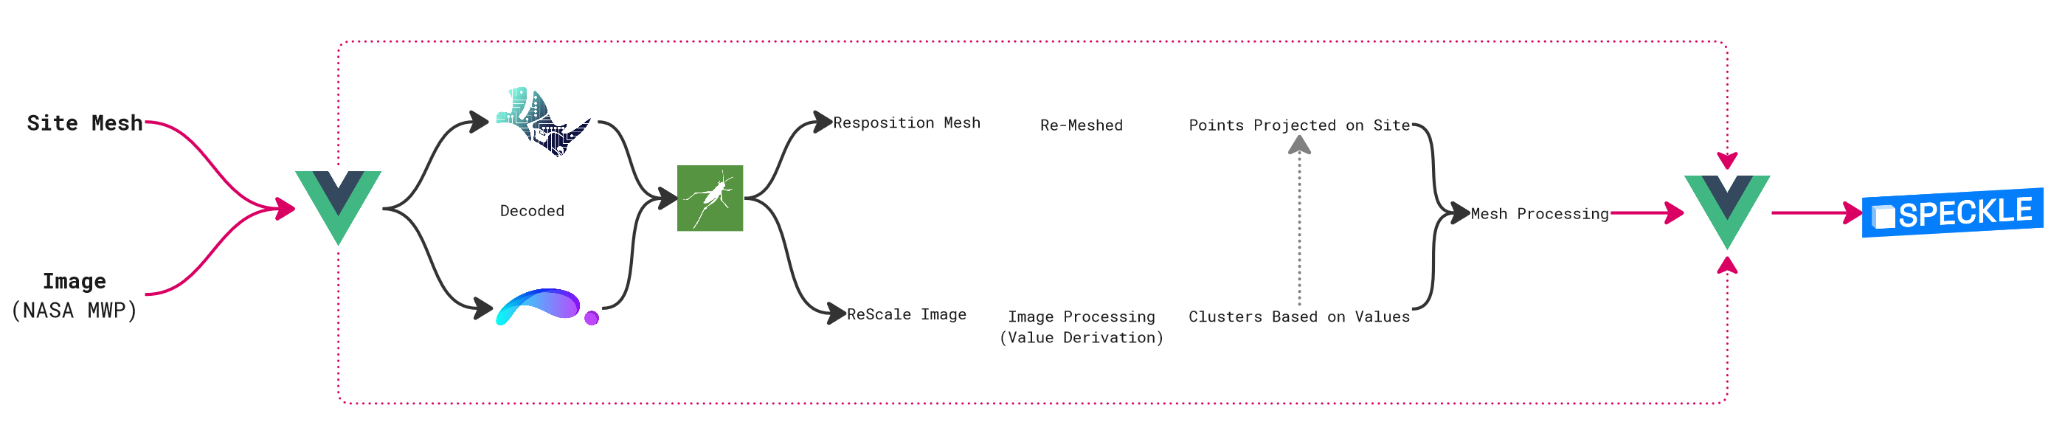
The following diagram shows the workflow of the app. Vue.js interacts with the user to collect the Site Mesh as an open mesh 3dm file and an image generated from NASA’s Mars Water Map MMGIS, re-adjusts the image and the mesh and computes the caves as a geometry post-image sampling. This Geometry is then sent back to the Vue/js interface while simultaneously trickling a new commit on the speckle stream which records all the different processing attempts as a new commit.
It can be seen in the flow diagram below that the images are encoded using the Shape Diver plugin while the 3dm file for the site is encoded using Rhino.Compute functions. The computation is carried out using the grasshopper script being run through the Rhino.Compute.
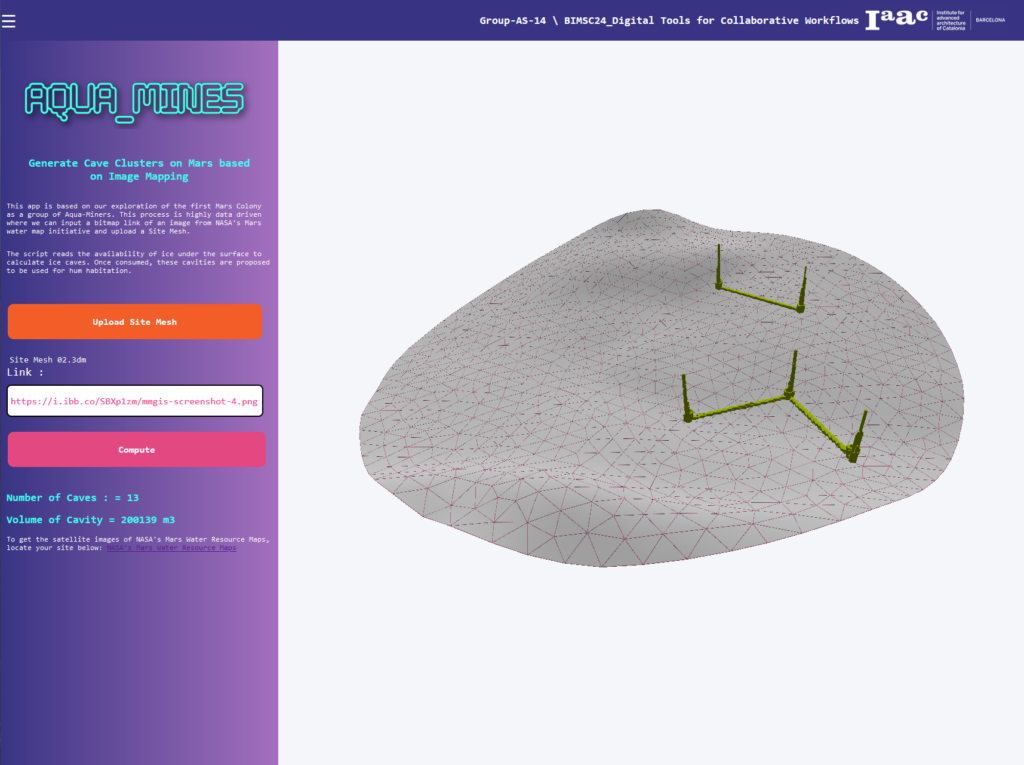
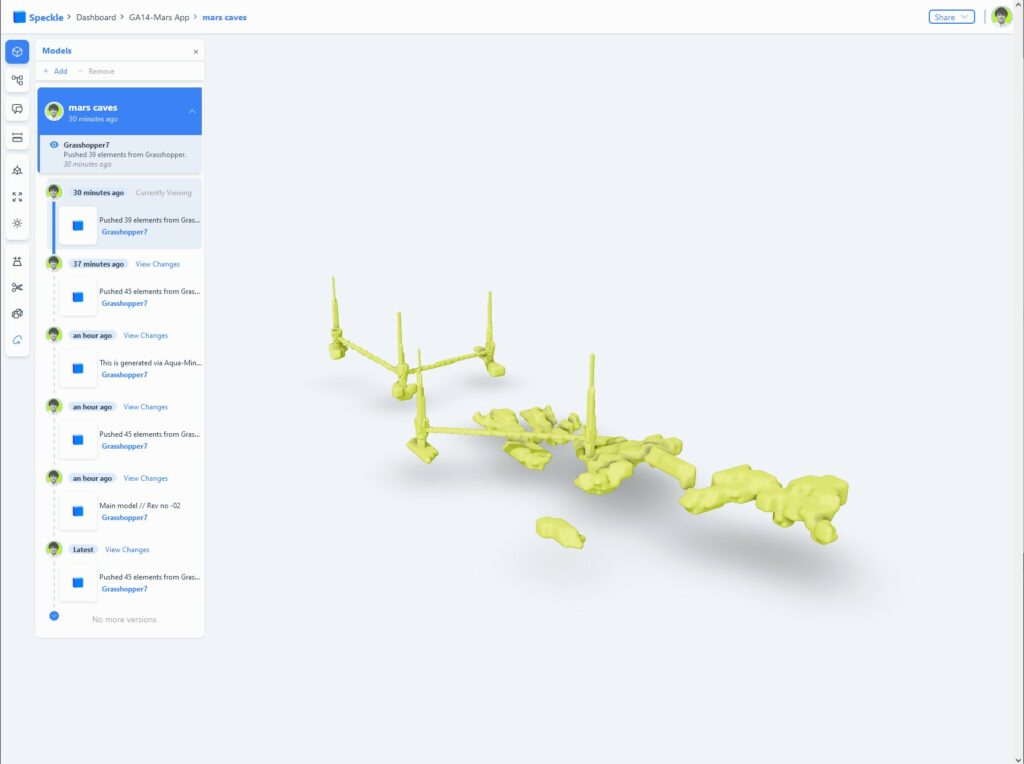
Screenshots of the Aquamines Web App Interface and the resultant Speckle Geometry.
This is a short demonstration video of how the Aquamines Web App works; taking input, processing it, sending information back to the web interface and triggering a speckle stream.
