

A Brief Introduction
The site for Hyperbuilding-B is immediately adjacent to that of Hyperbuilding-A, which is nestled in the Minato Ward of the Tokyo Metropolitan Area. Minato is one of Tokyo’s 23 special wards and is known for being a major business, diplomatic and residential hub. It is heavily urbanised, with approximately 14,000 people per square kilometer, but in regards to Tokyo standards this is a relatively moderate density.
The skyline is dominated by high-rise buildings with some scattering of low-rise residential zones, so towers in this area are subject to the scrutiny of solar shading laws outlined in Tokyo building legislation.
Thankfully, our site sits within the relatively underdeveloped area of the Shinagawa train station, which we use as a key design driver for our project.
Arcology: The fusion of Architecture and Ecology
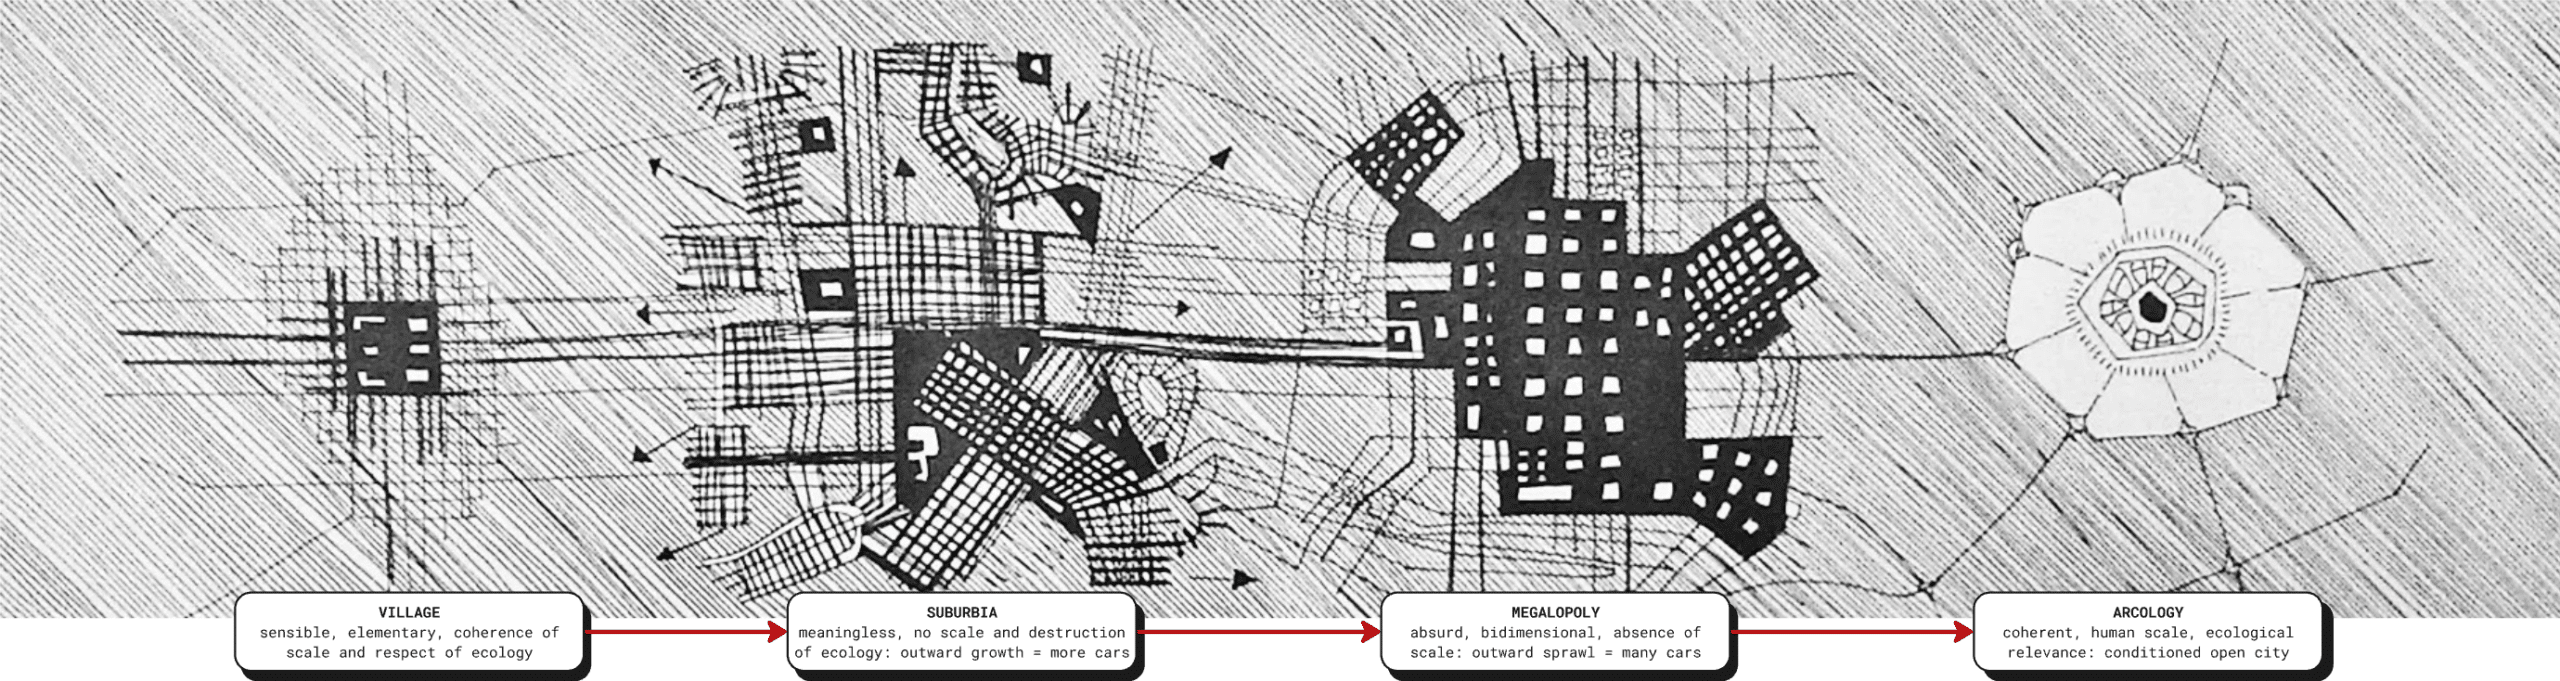
In analyzing the site and the urban conditions of its immediate surroundings, we began to conceptualize our building through the lens of closed-loop ecologies. Central to this was the theory of Arcology, developed by Paolo Soleri in the late 1960s—an approach that seeks to harmonize architecture with ecology, creating dense, efficient urban environments that minimize environmental impact.
Tokyo exemplifies the challenges posed by unchecked urban sprawl. It exists as a seemingly endless expansion outward that, while accommodating population growth, increases dependence on sprawling transportation networks. This kind of development is predominantly two-dimensional; cities grow across the surface but rarely upward, limiting the potential of vertical urbanity.
Contextual Factors as Design Drivers
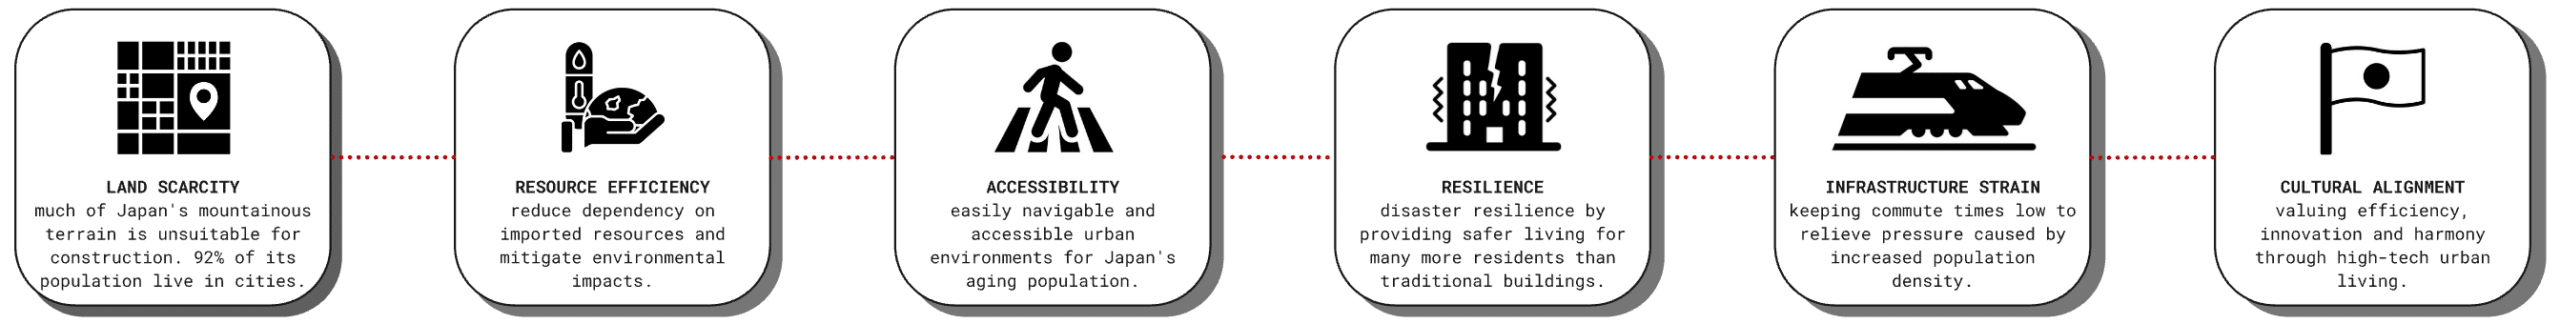
This is not a localized issue. The United Nations estimates that by 2050, 66% of the world’s population will live in urban areas. In Japan, this future is already reality, where 92% of the population lives in cities, and the average daily commute exceeds one hour. Land scarcity and difficult terrain make horizontal expansion unsustainable.
In response, our project adopts the principles of arcology to propose a self-sustaining, vertical community. By integrating residential, commercial, amenity, and green spaces into a single structure, we aim to reduce reliance on external infrastructure and transportation. This closed-loop system seeks to produce as much food and energy on-site as possible, supporting a resilient, independent ecosystem.
For Japan’s aging population, such integration enhances accessibility and quality of life. It also provides greater resilience in the face of natural disasters, particularly earthquakes, by concentrating more people in structures designed with safety and mitigation in mind.
Ultimately, our vision reflects and celebrates the cultural values of Japanese society: efficiency, innovation, and the embrace of high-tech urban living. In this “city within a city,” we hope to model a more sustainable and resilient future for urban life.
Our roles as Data Team
As the only non-design team, the data team was primarily responsible for the overall data management and integration for the project, ensuring that inputs and outputs are reasonably coordinated through information exchange.
Definition and Progress Monitoring of Key Performance Metrics (KPIs)
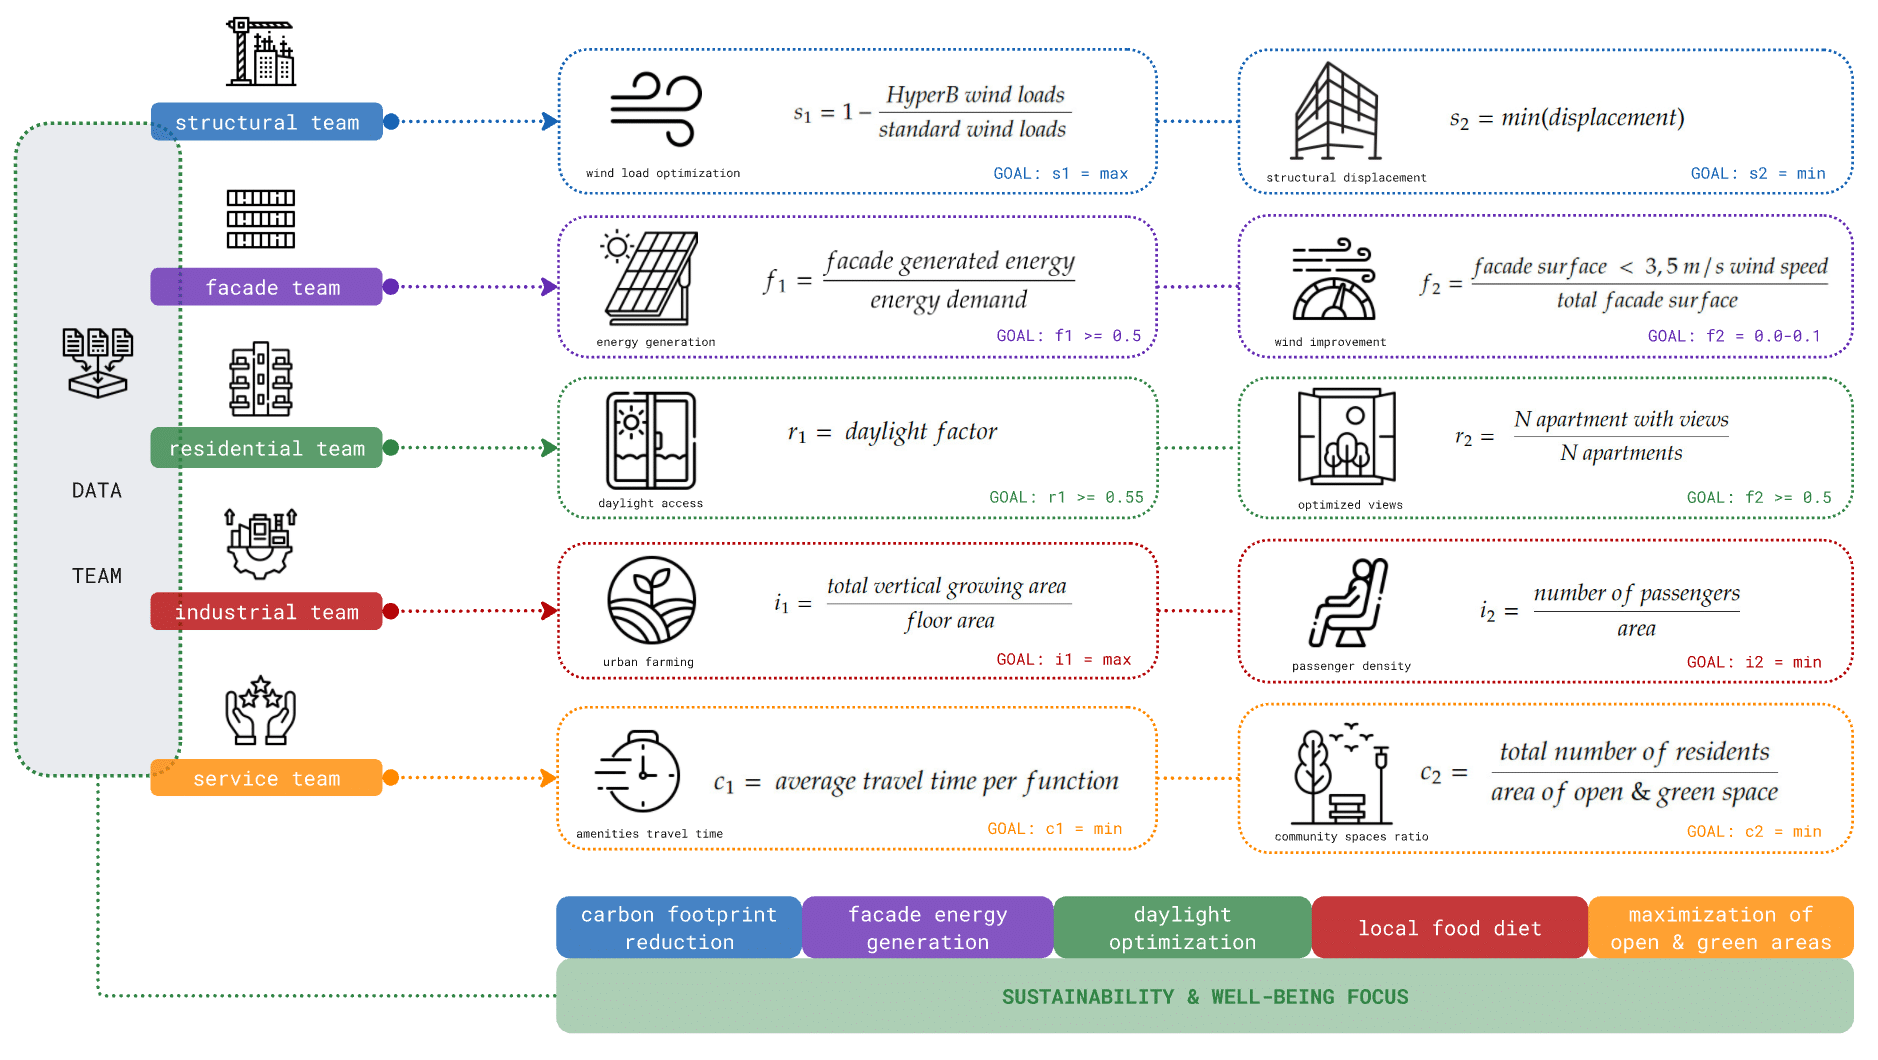
At the start of the project, each design team proposed key performance indicators in areas that are of particular interest to them. Design development was then focused with these objectives in mind.
Internal Collaboration
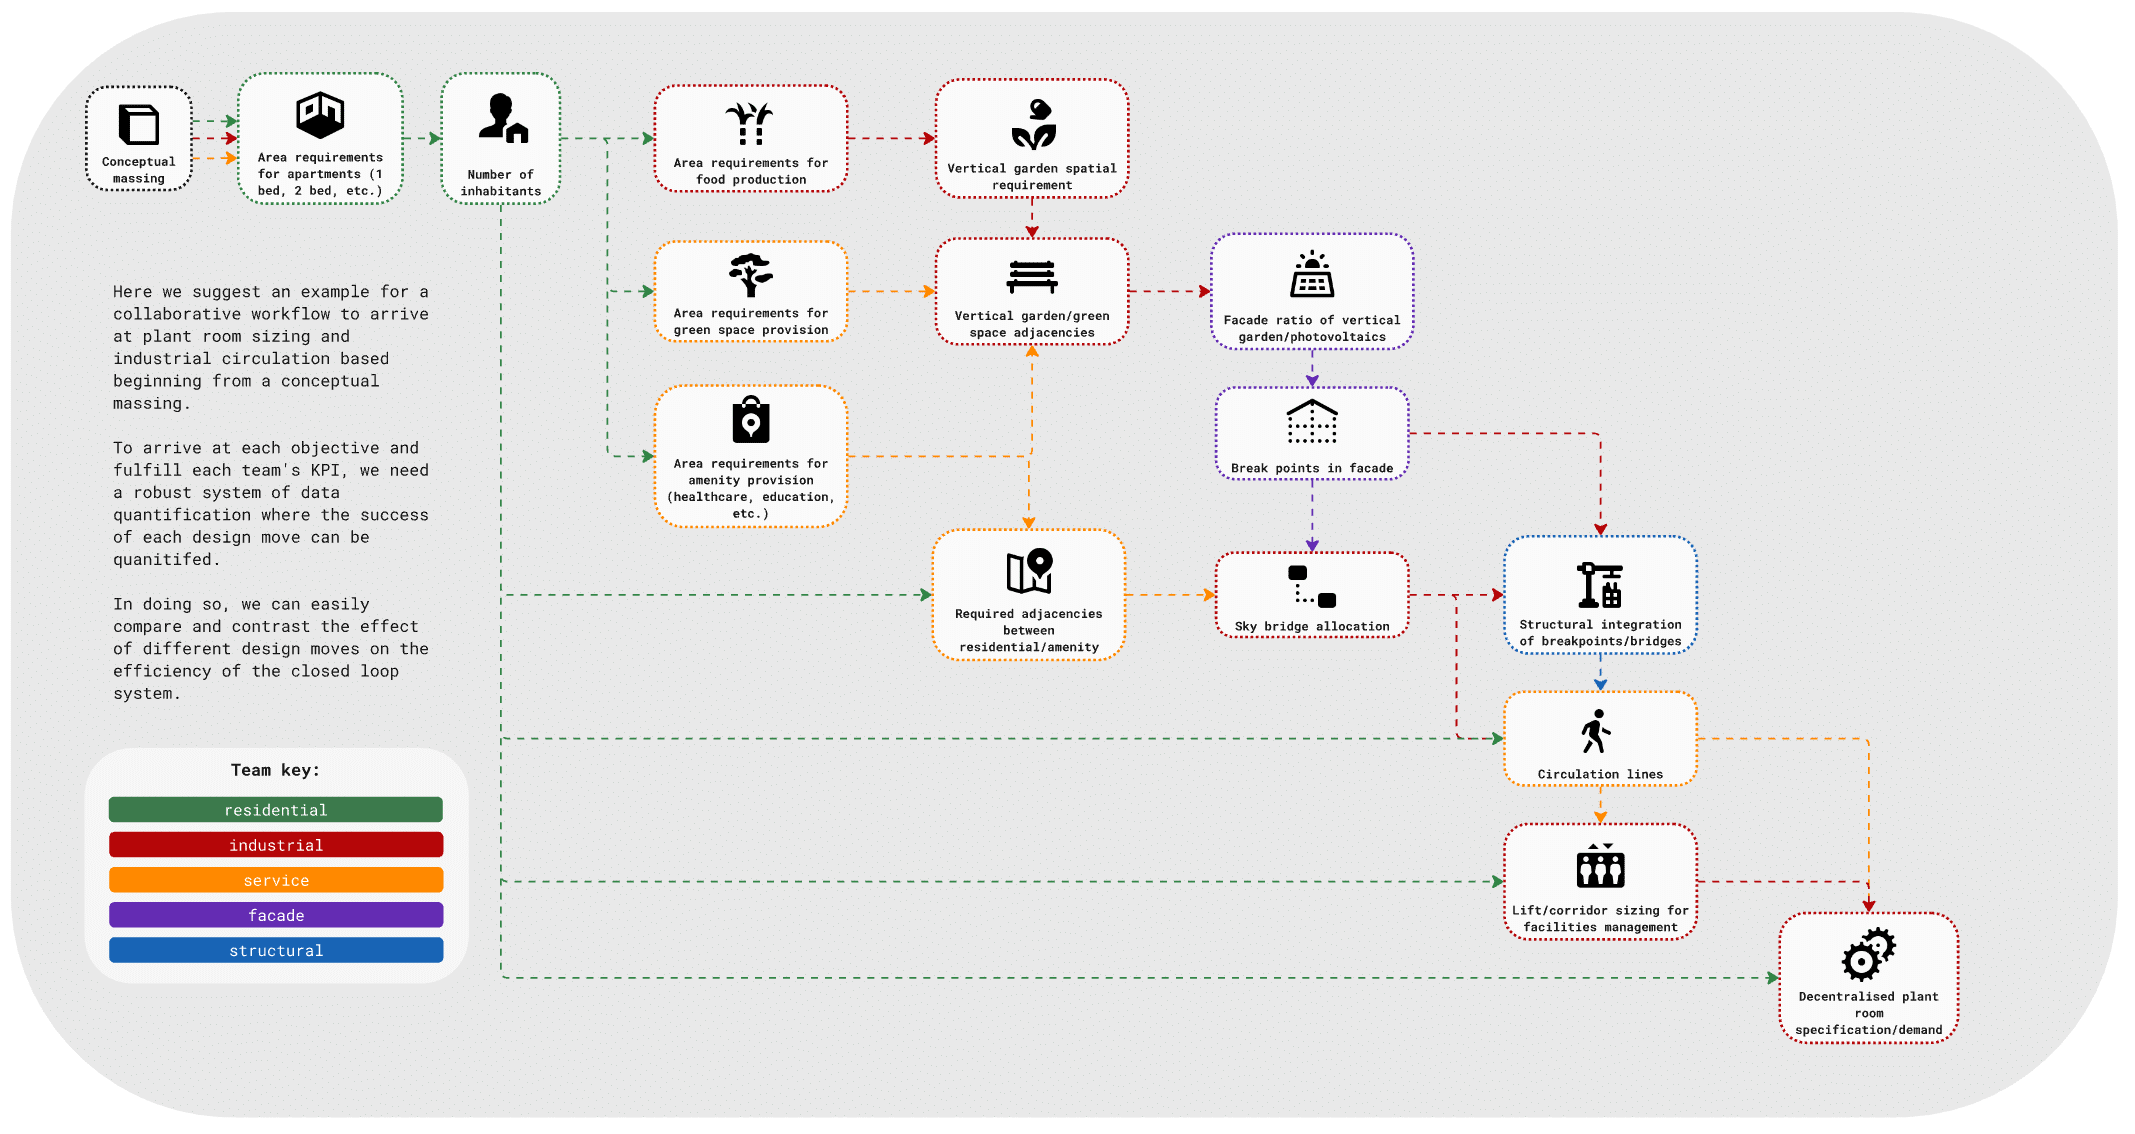
In a project of this scale, we quickly realized that the success of the closed-loop system hinged on efficient data flow between teams. For instance, changes in industrial modules influenced energy requirements, which in turn affected the facade strategy. These interdependencies were tracked in real-time using a shared Speckle environment.
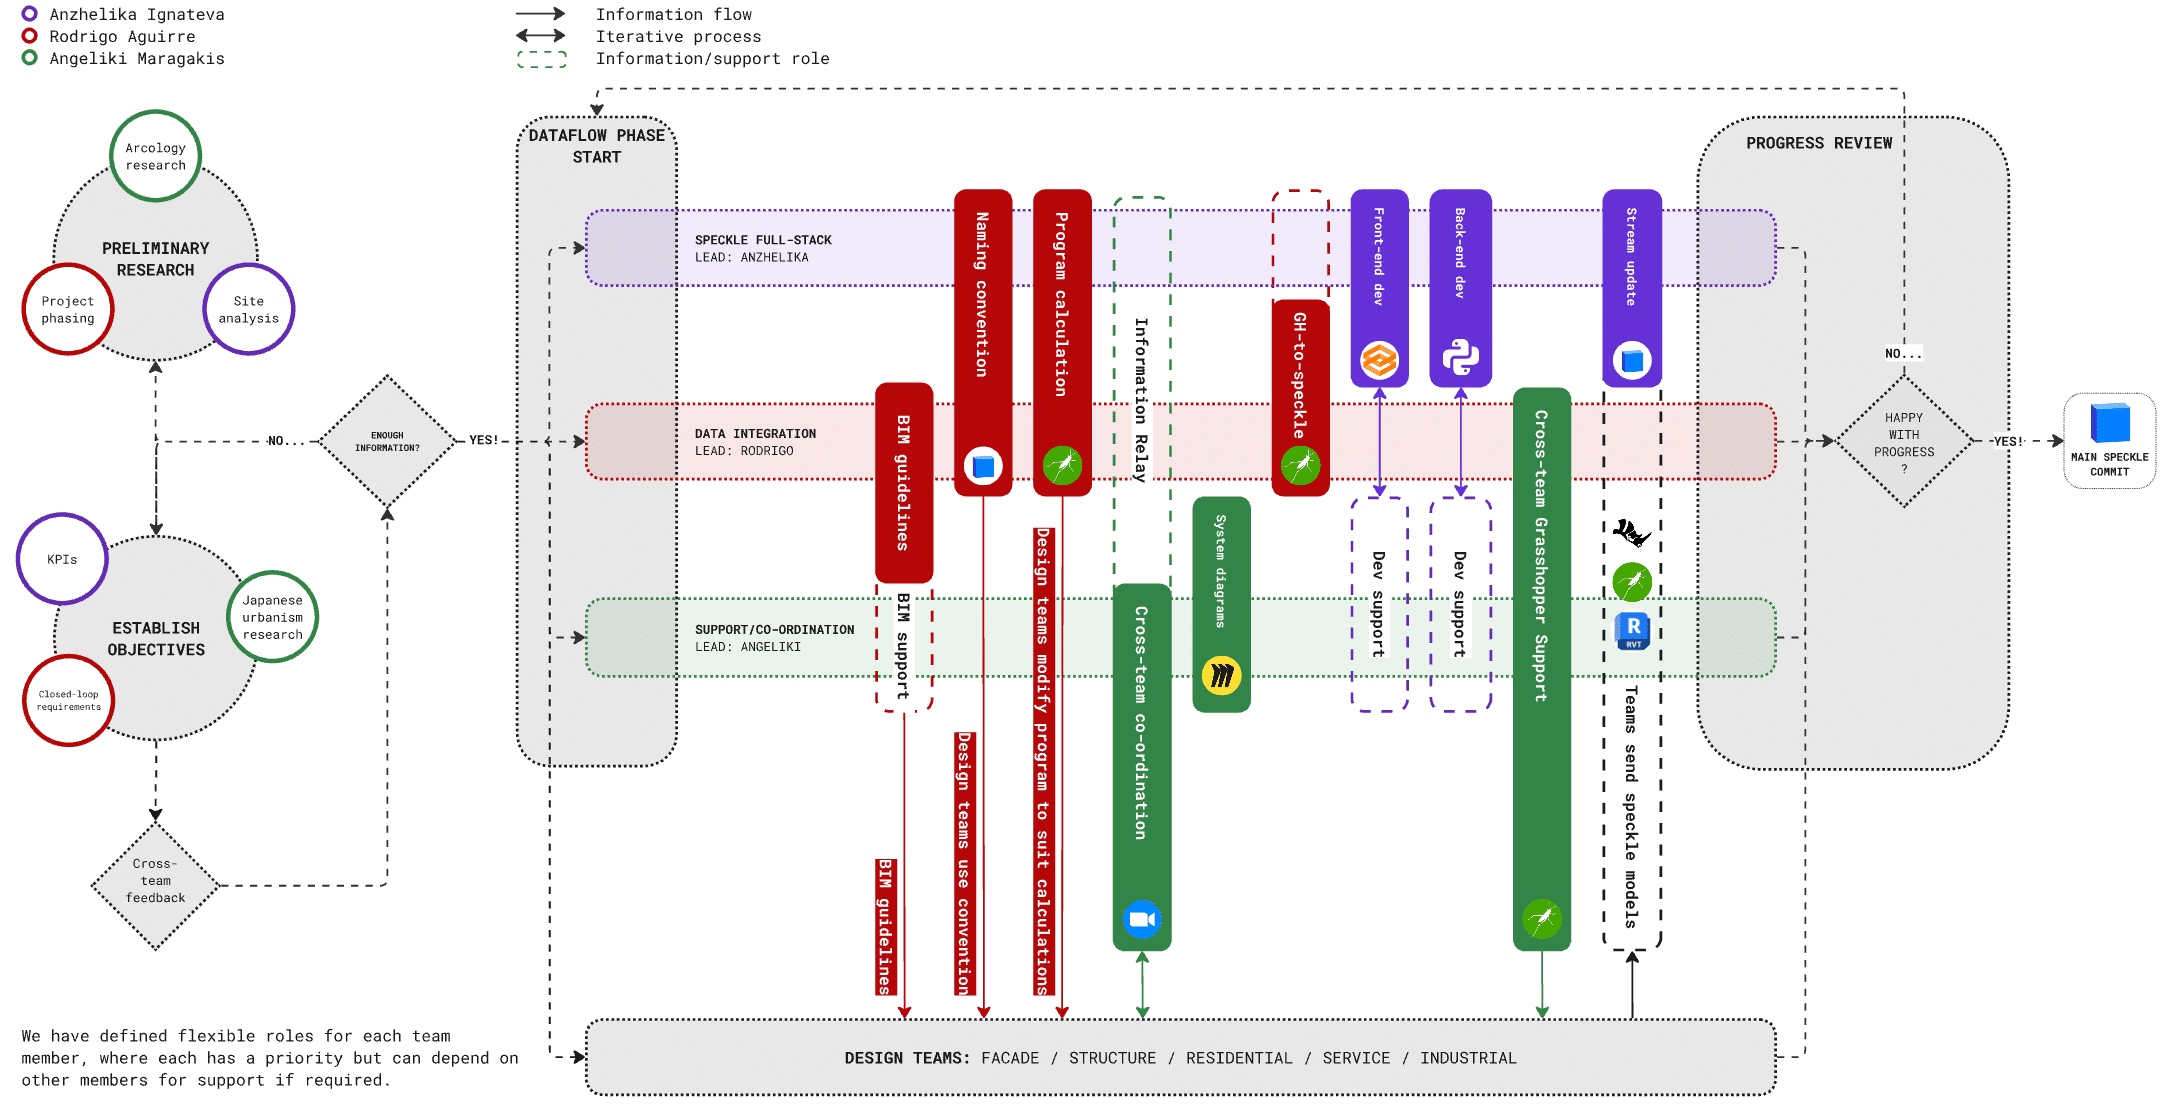
This meant we often took on hybrid roles. While Angeliki focused on coordination, diagramming, and providing team support, Rodrigo provided both technical assistance and created guidelines for the design teams. He also acted as the bridge between Angeliki and Anzhelika, who led the full-stack development of our dashboard.
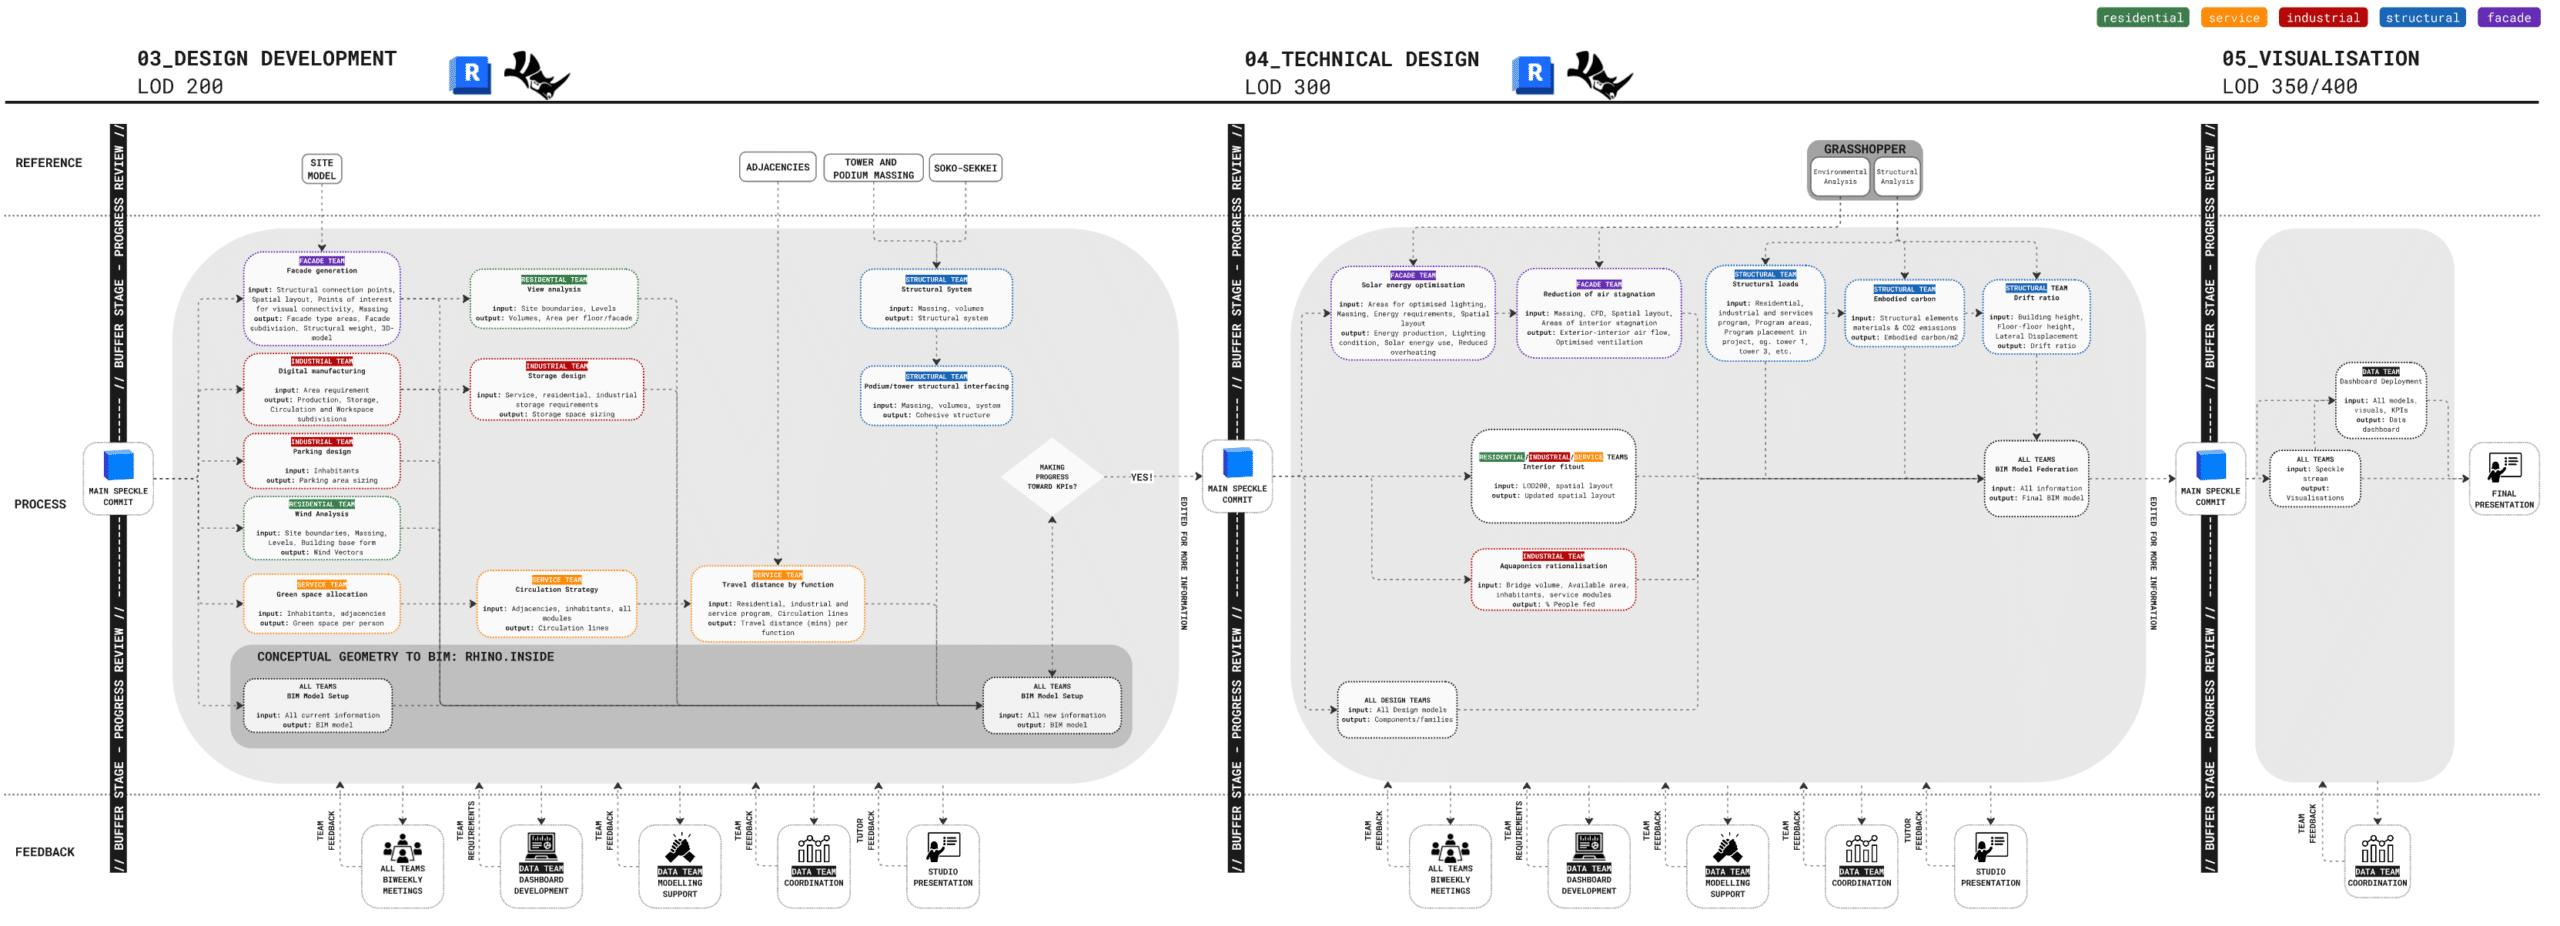
Cross-Team Plan of Work
We created a simple external collaboration diagram to map how information should flow between teams, aligning design checkpoints with the level of detail (LOD) model development.
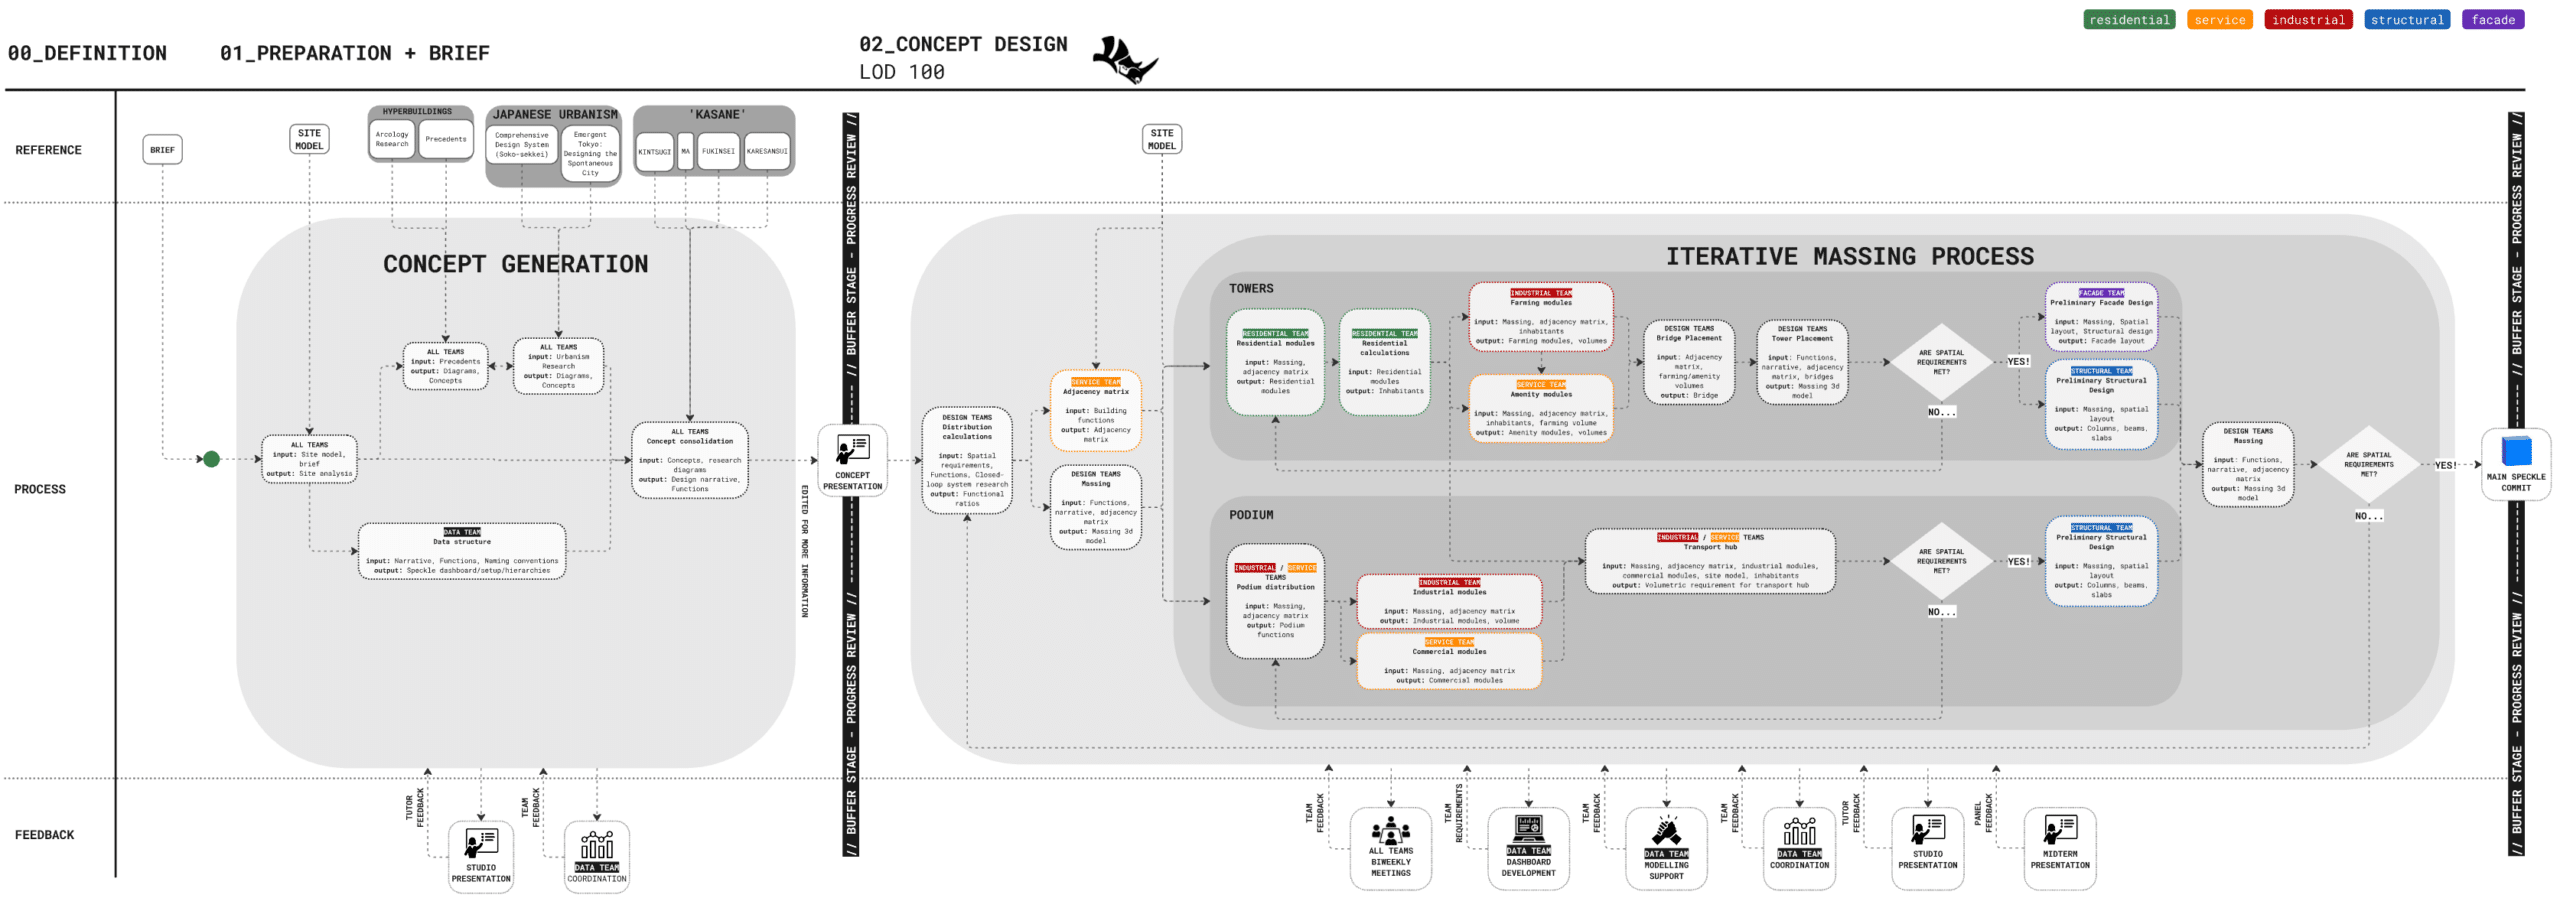
However, we found that in practice, this system was more complex than we had anticipated. The pace and depth of design progress varied significantly across teams, making it difficult to sync development milestones.
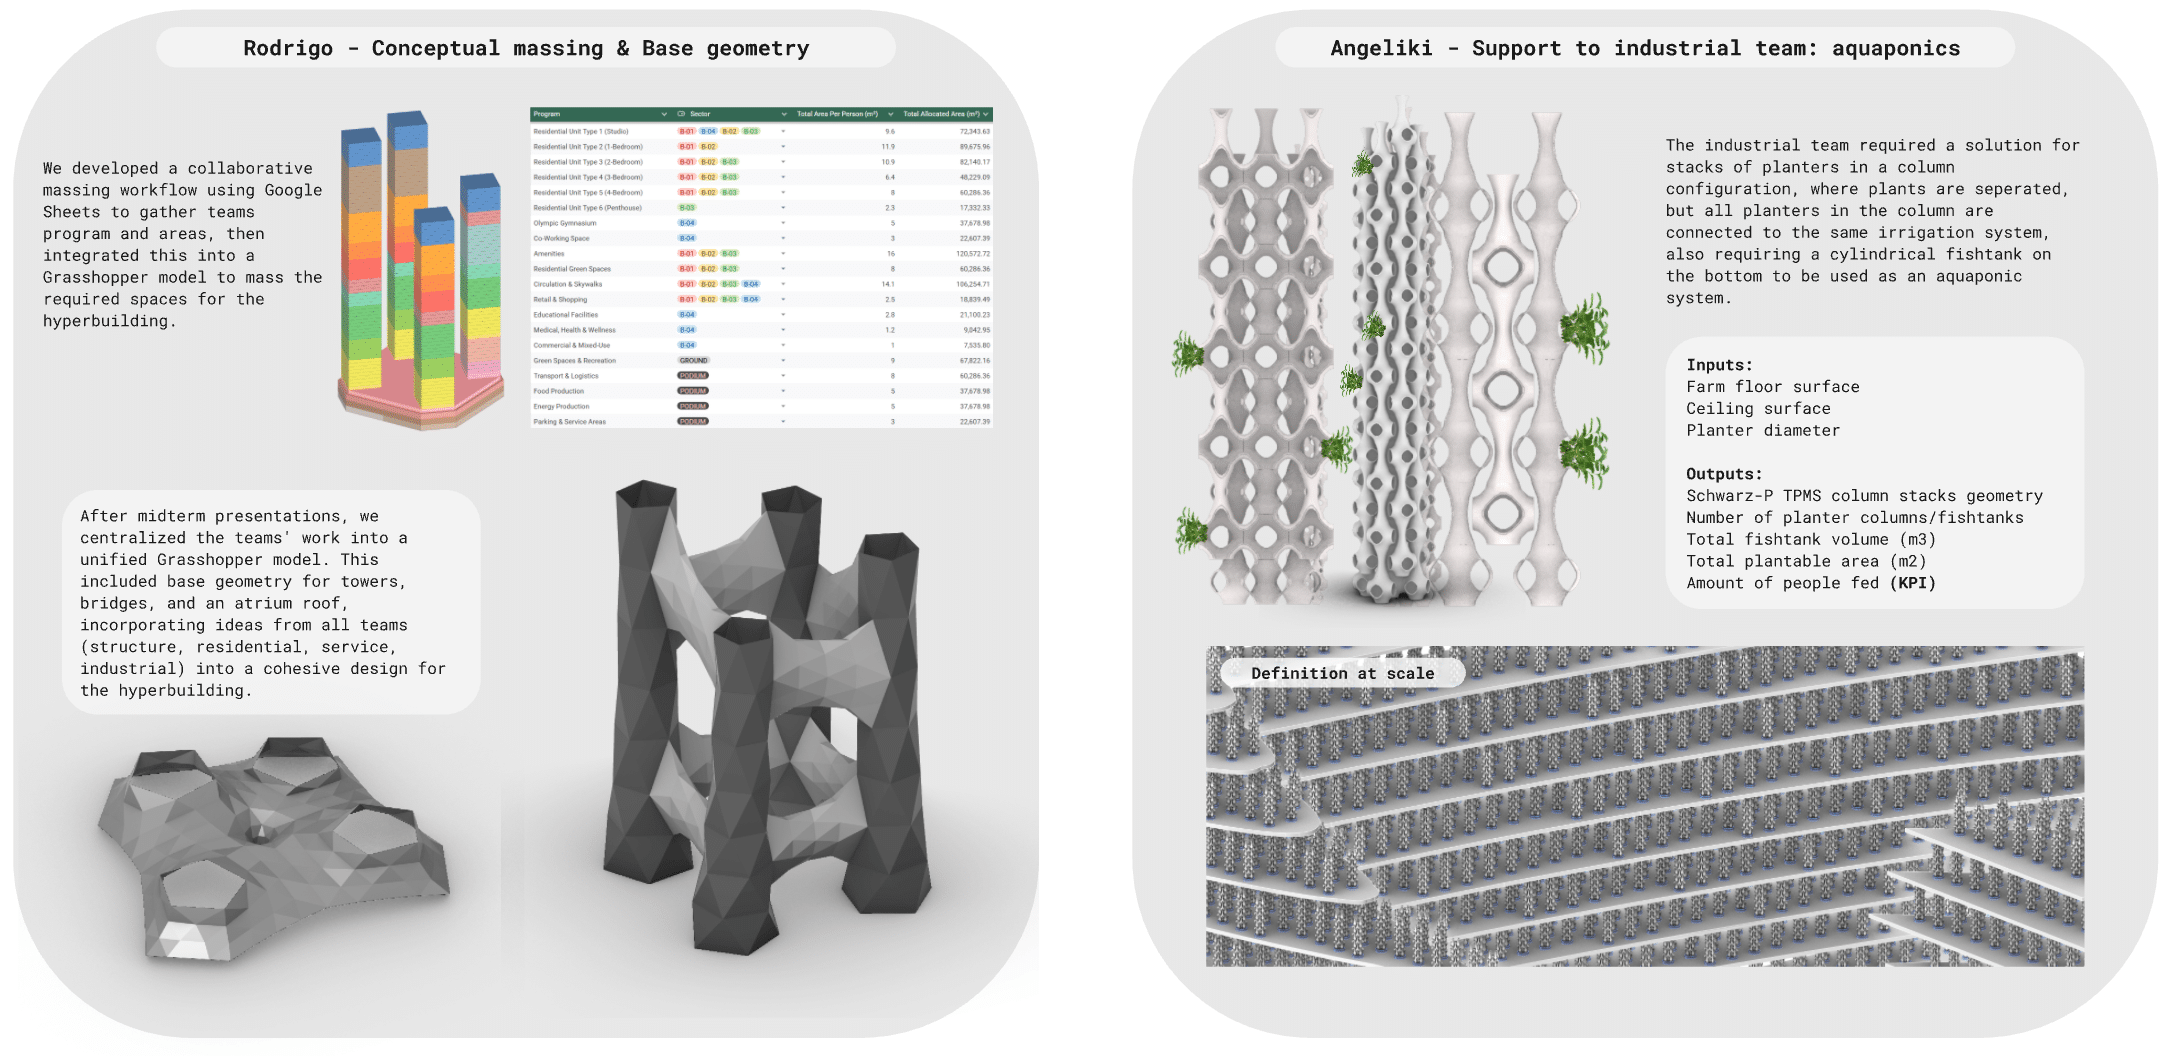
To reduce some of these bottlenecks, Rodrigo and Angeliki provided Grasshopper support to teams working on massing and urban farming geometries.
Other Data Structuring and Housekeeping
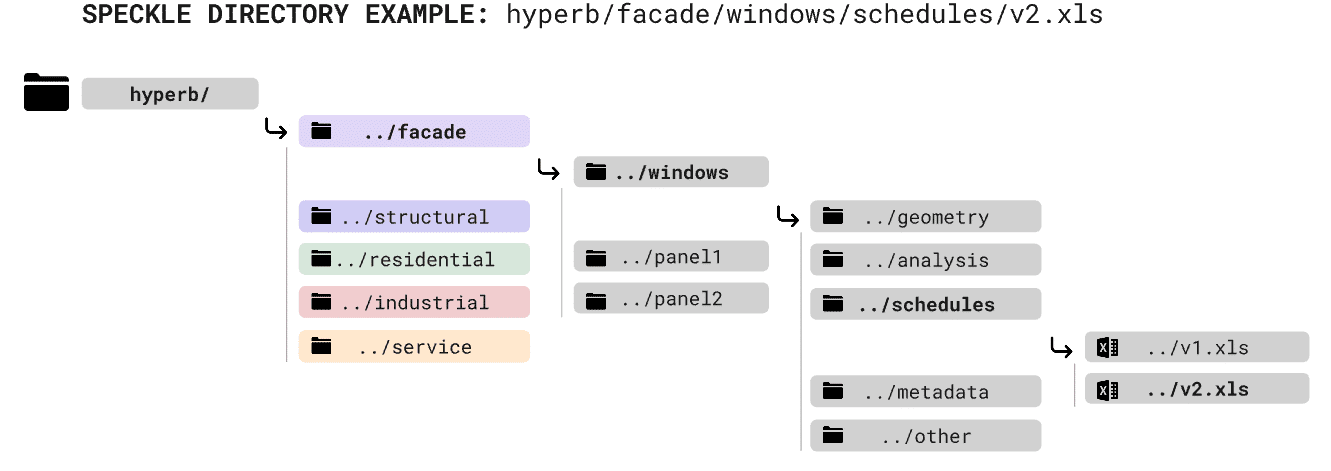
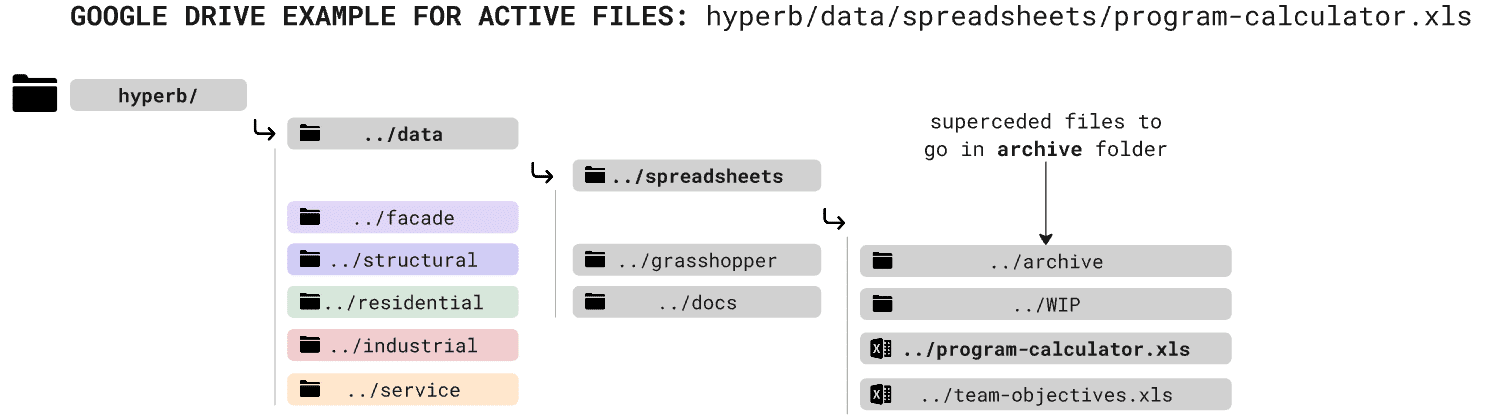
To streamline collaboration, we developed a directory structure for organizing incoming and outgoing data. This ensured that files were logically stored and accessible to all teams when needed. Bim guidelines were also created for those teams working in Revit.
Collaboration Reflection
The good
The use of live-service collaboration tools like Speckle significantly streamlined the exchange of crucial data across teams. Our hyperbuilding team comprises architects and designers with diverse skill sets – as the data team, we did not impose and specific software requirements, allowing each team member to work within their strengths. For this, the ability to seamlessly transfer data between different software platforms proved invaluable.
The bad
- As the only non-design team, we took on management and coordination roles for 19 team members, spanning multiple times zones and work schedules.
- Breakdowns at key bottlenecks required us to assume extra responsibilities in both design and technical support.
- As a result, our primary focus on data collation and visualisation often had to be deprioritised to ensure design teams could meet their deadlines.
The disorganised
- While we can establish workflows to achieve specific design objectives and provide BIM and data structure guidelines, we cannot enforce their use.
- As a result, the planned workflow we designed to meet our goals was often not followed, and our project proved much more chaotic than intended.
How could we as a data team do better?
- Definition of clear roles and responsibilities: though we did appoint team coordinators, we should have asked for them to act as the support role for each team. We also should have defined what the data team will not handle to ensure that technical support doesn’t overshadow our core responsibilities.
- Automation of routine tasks: as a data team we would have liked to provide more efficient means of data collection, but found ourselves without the time to do so.
- Make guidelines actionable and visible: we could have further emphasised the importance of the guidelines and good housekeeping, enforcing soft compliance when data is not structured correctly.
- More structured sync and feedback loops: as a data team we should have set up more structured check-ins – or emphasised the need for check-ins as outlined in the external plan of work diagram – to align expectations and iterate on the current workflows of each design team, ensuring each team receives their inputs needed for downstream tasks in good time.
Design Outcome Data Visualisation: Dashboard
The dashboard is available to view here: https://huggingface.co/spaces/angelica-ignateva/hyperB
Our dashboard was developed full-stack using the Gradio library for Python. We extracted data from models in our shared team Speckle directory and from Google Sheets data for visualisation, with the purpose of tracking progress and monitoring team outcomes. Speckle iFrames were embedded with relevant models where possible for visual querying.
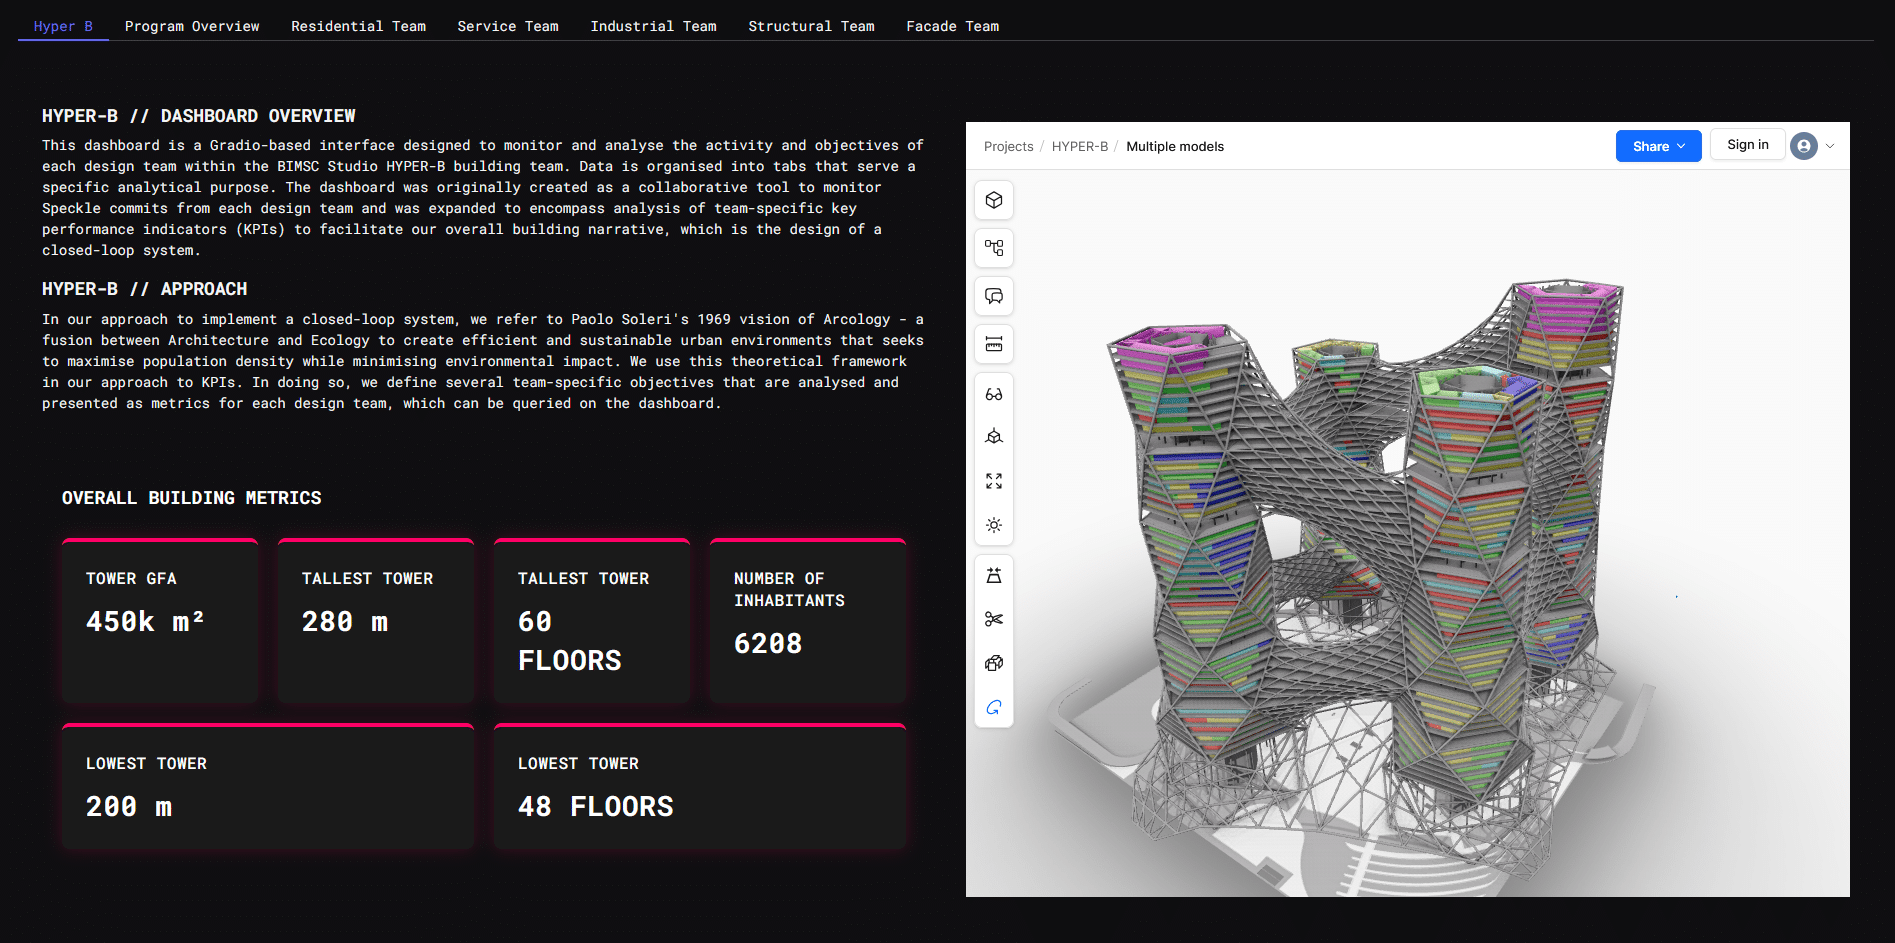
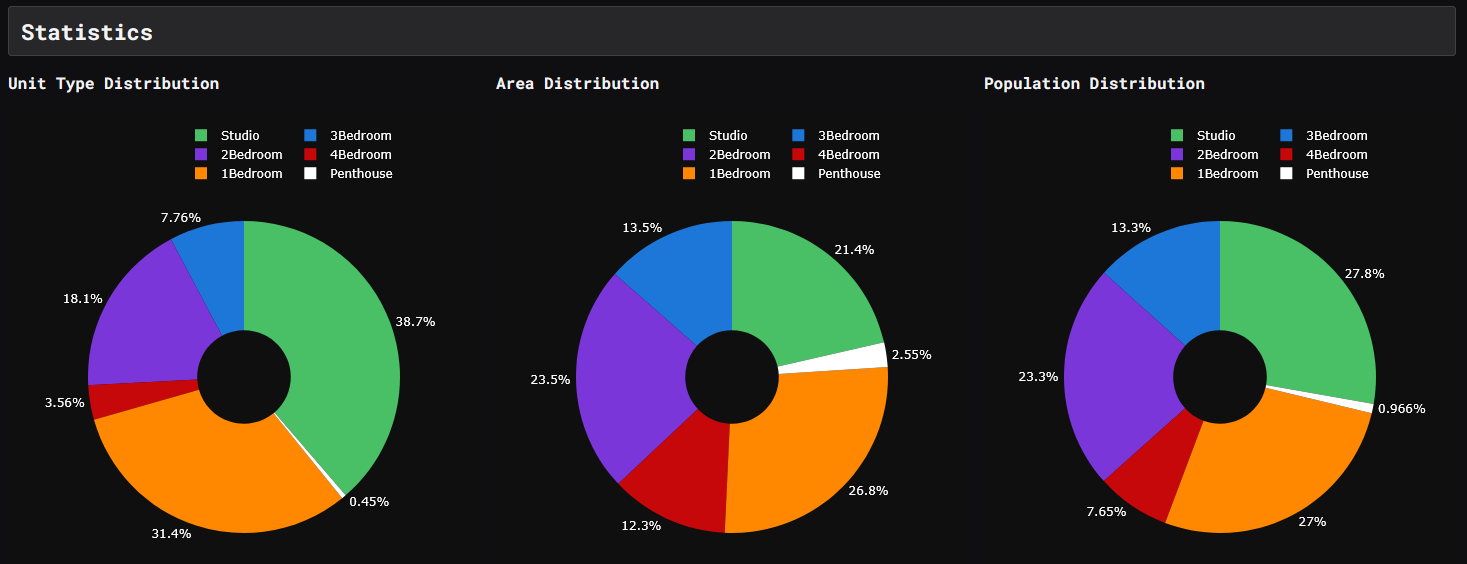
The landing page serves as a statistical overview of our metrics and breaks down our approach in terms of design and dashboard development.
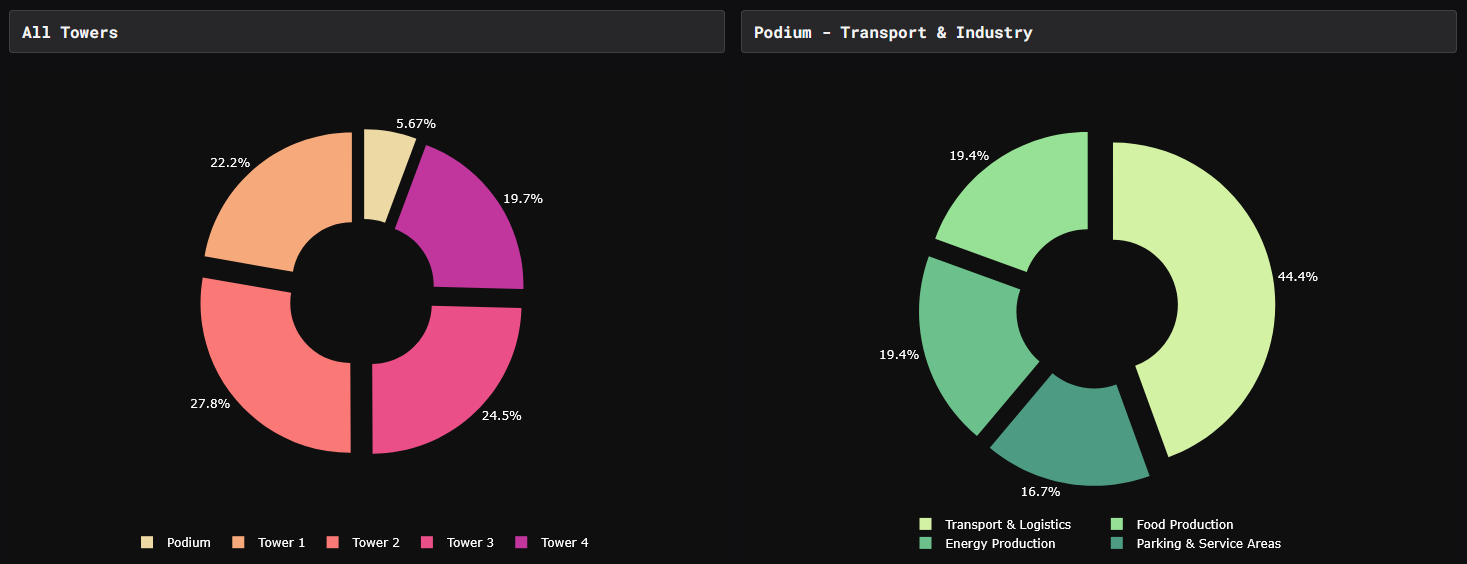
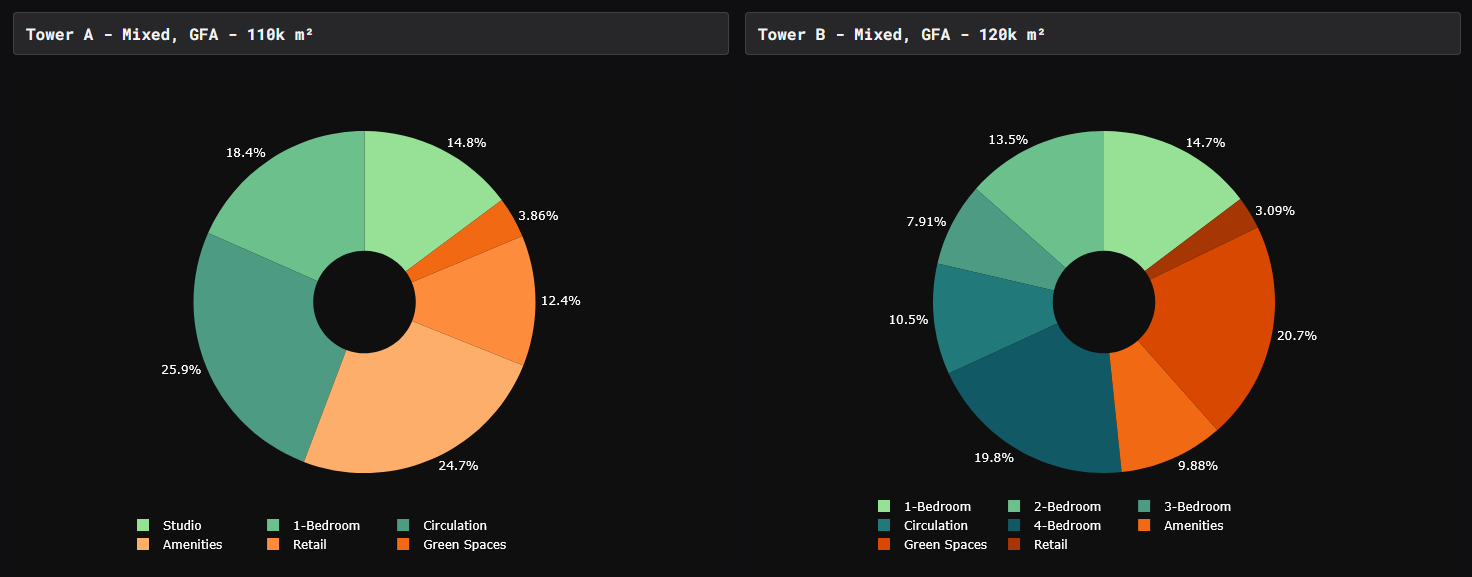
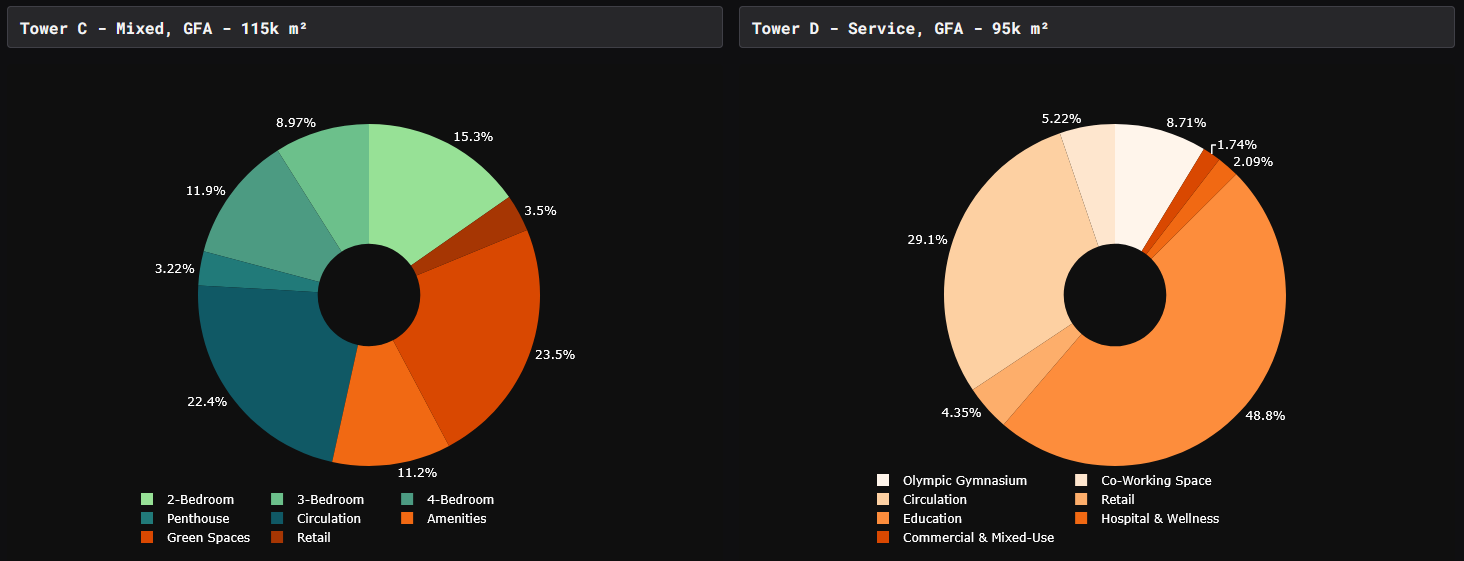
Overview Metrics: Percentage Distribution of Functional Zoning
KPIs per team
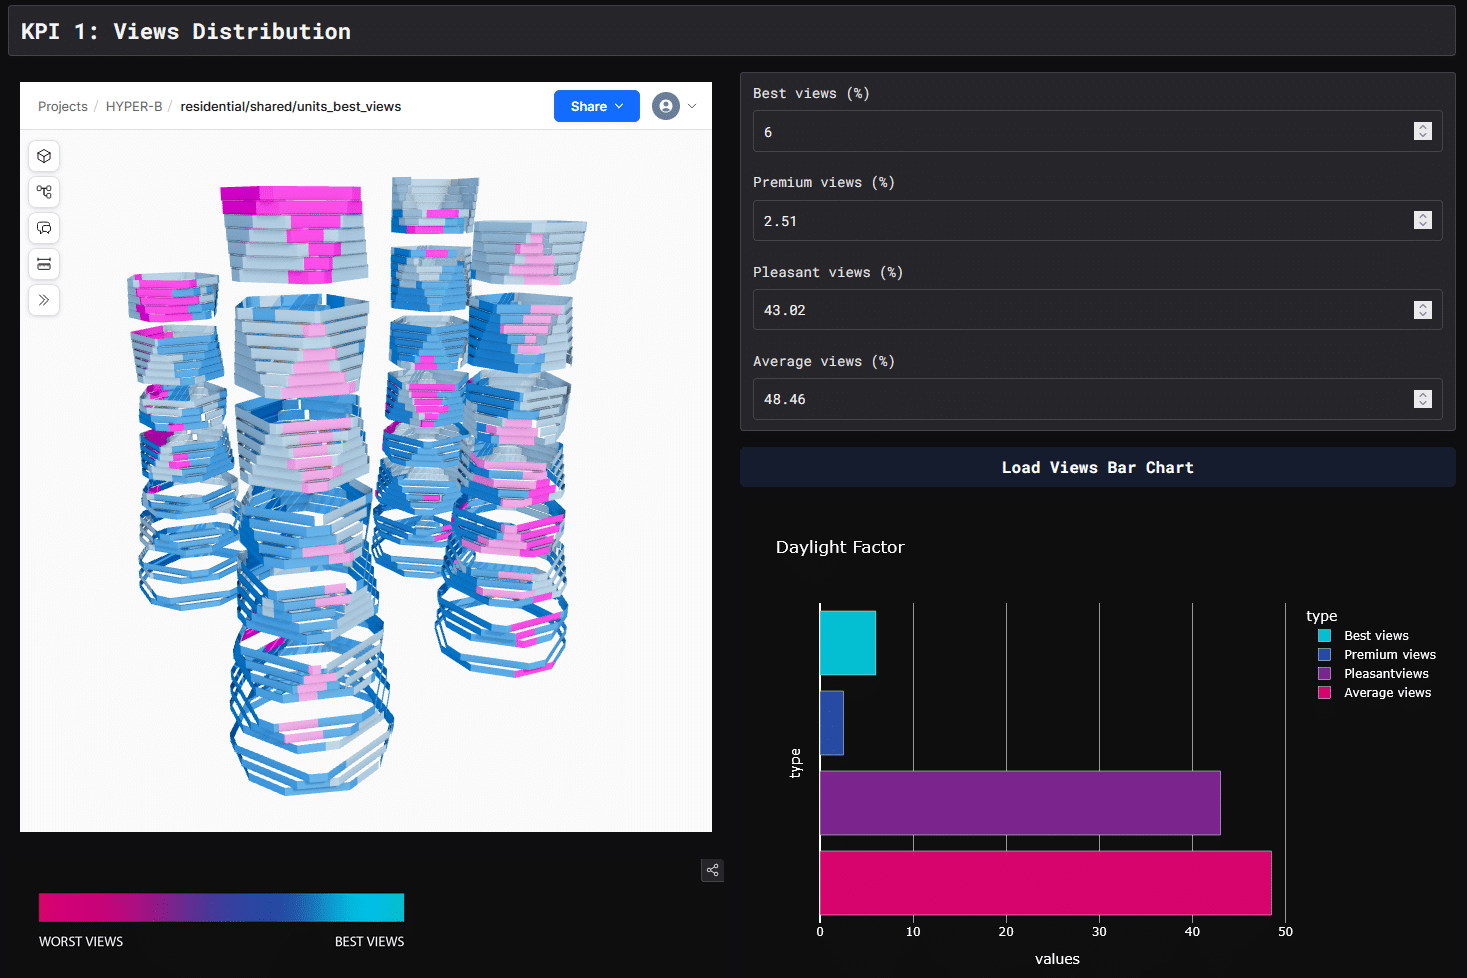
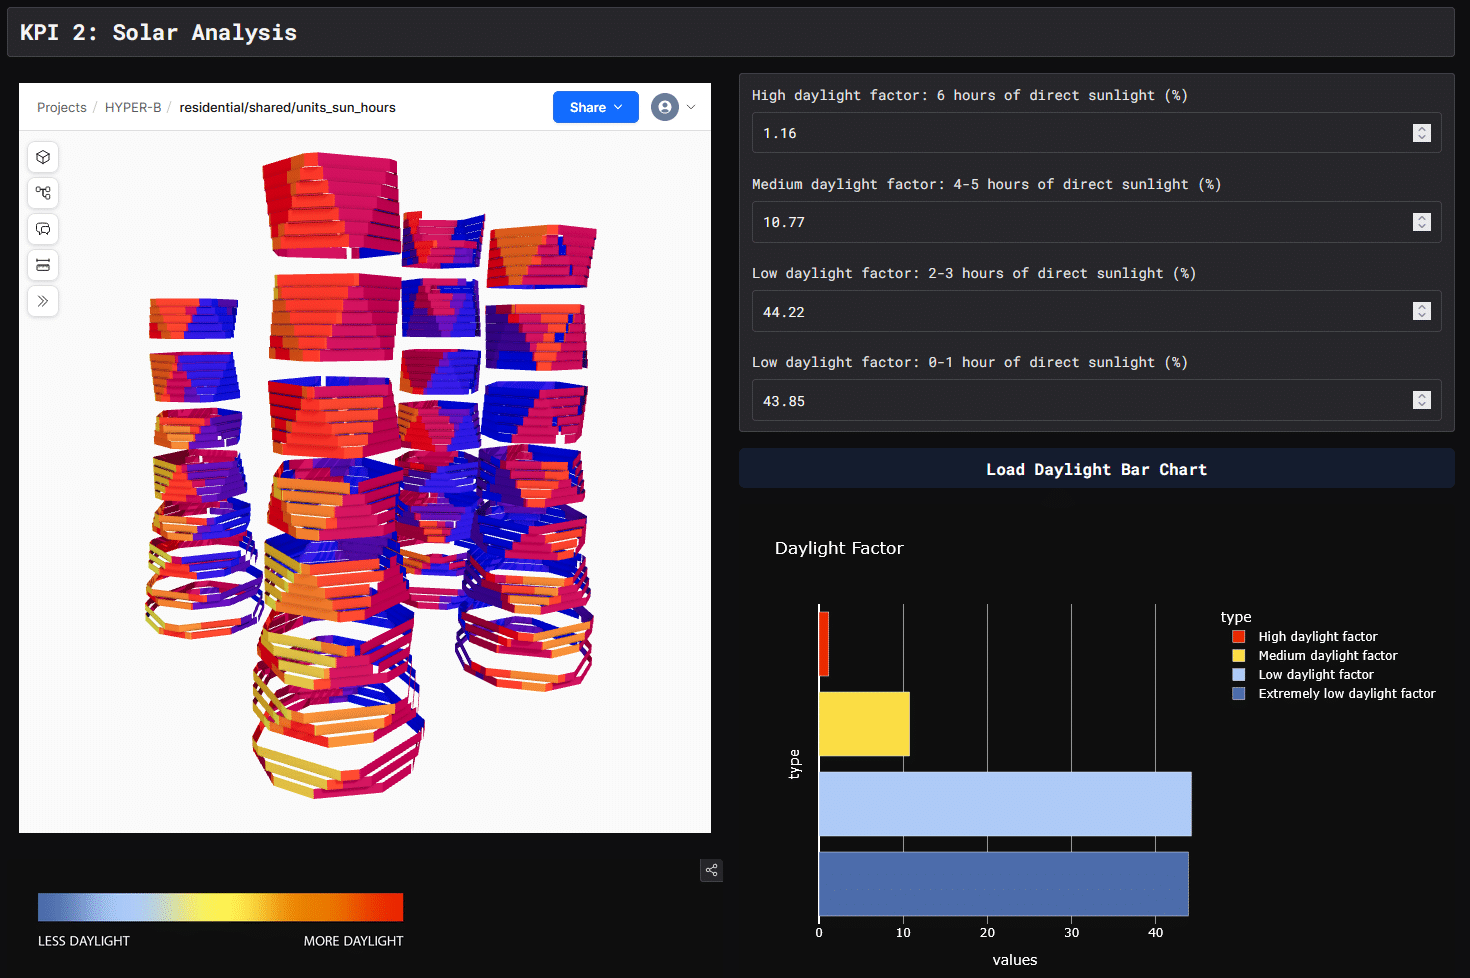
Residential Team
The residential team prioritized maximizing spatial daylight autonomy and optimizing views for each unit. Their work investigates the dispersion, placement, and orientation of residential modules to achieve these goals.
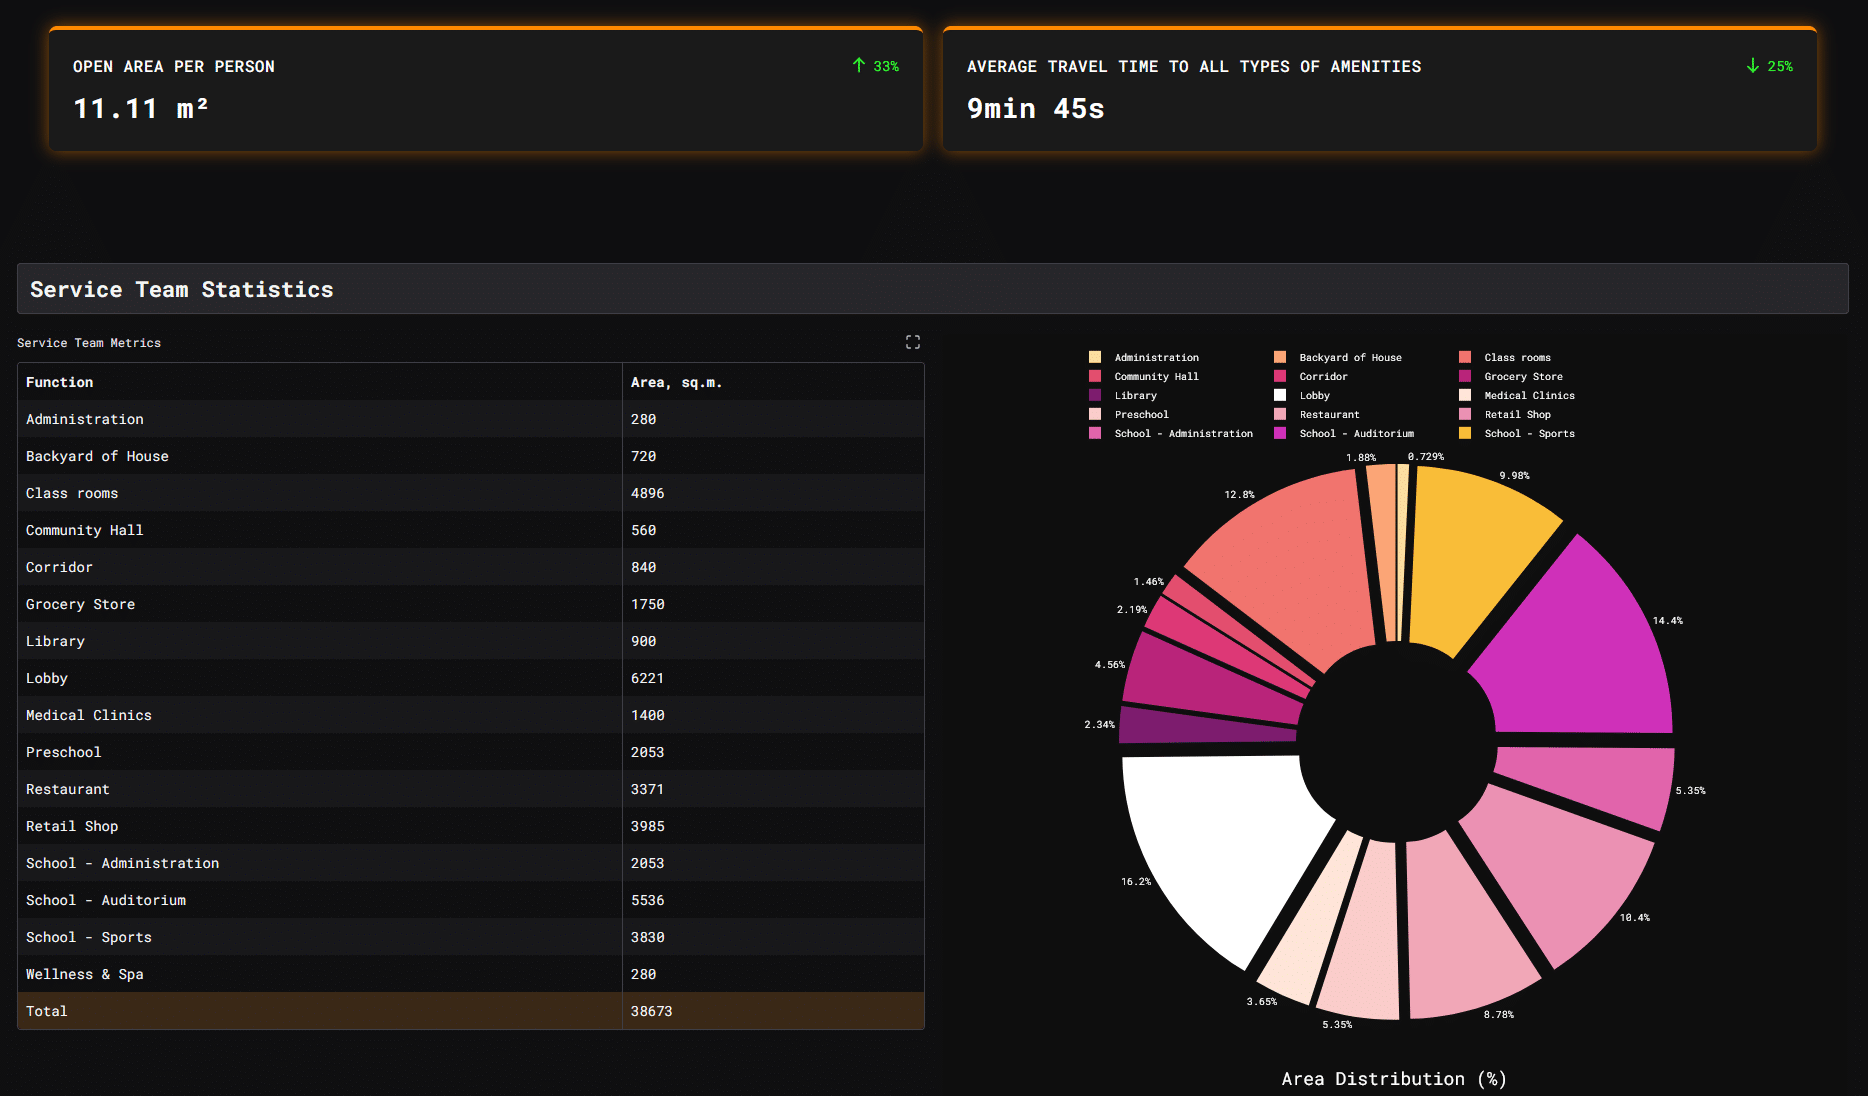
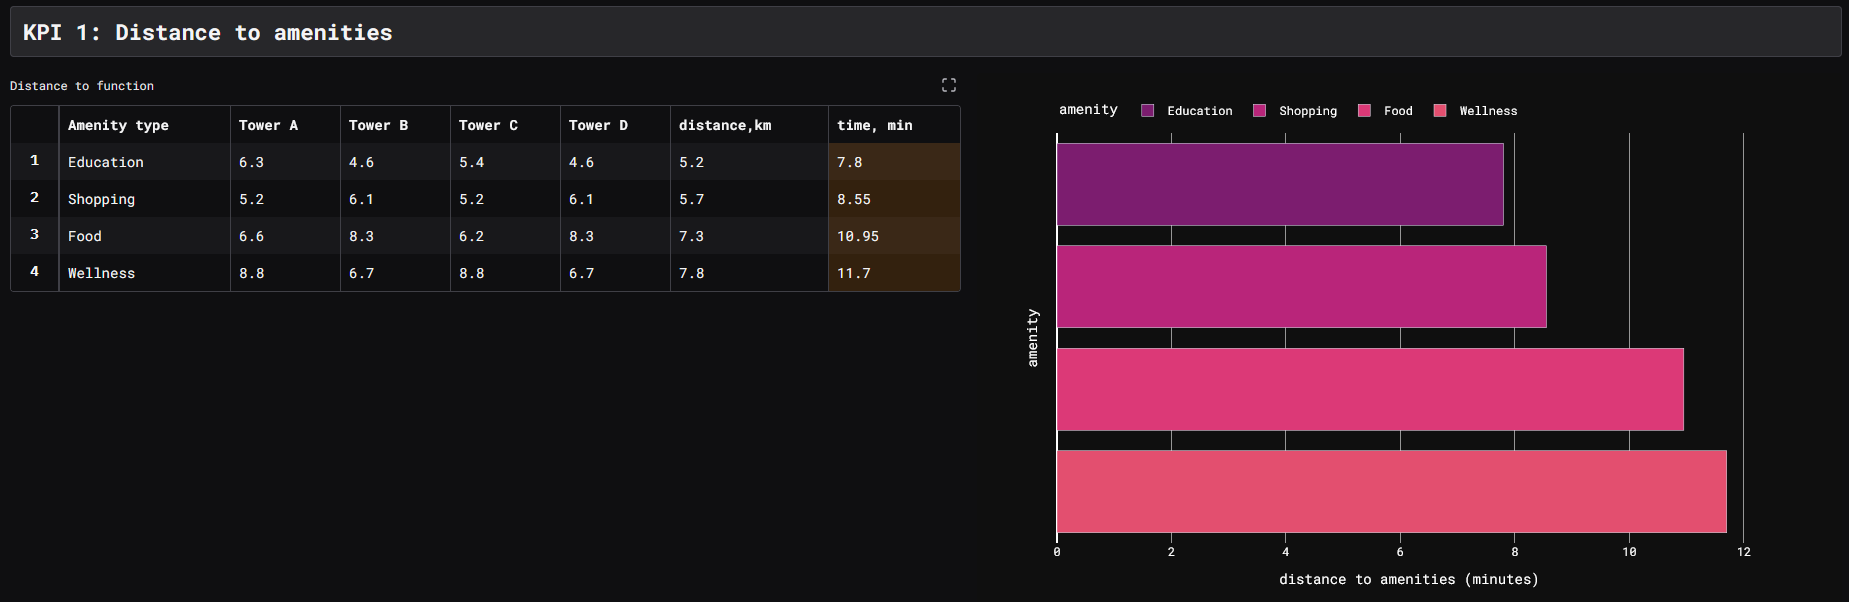
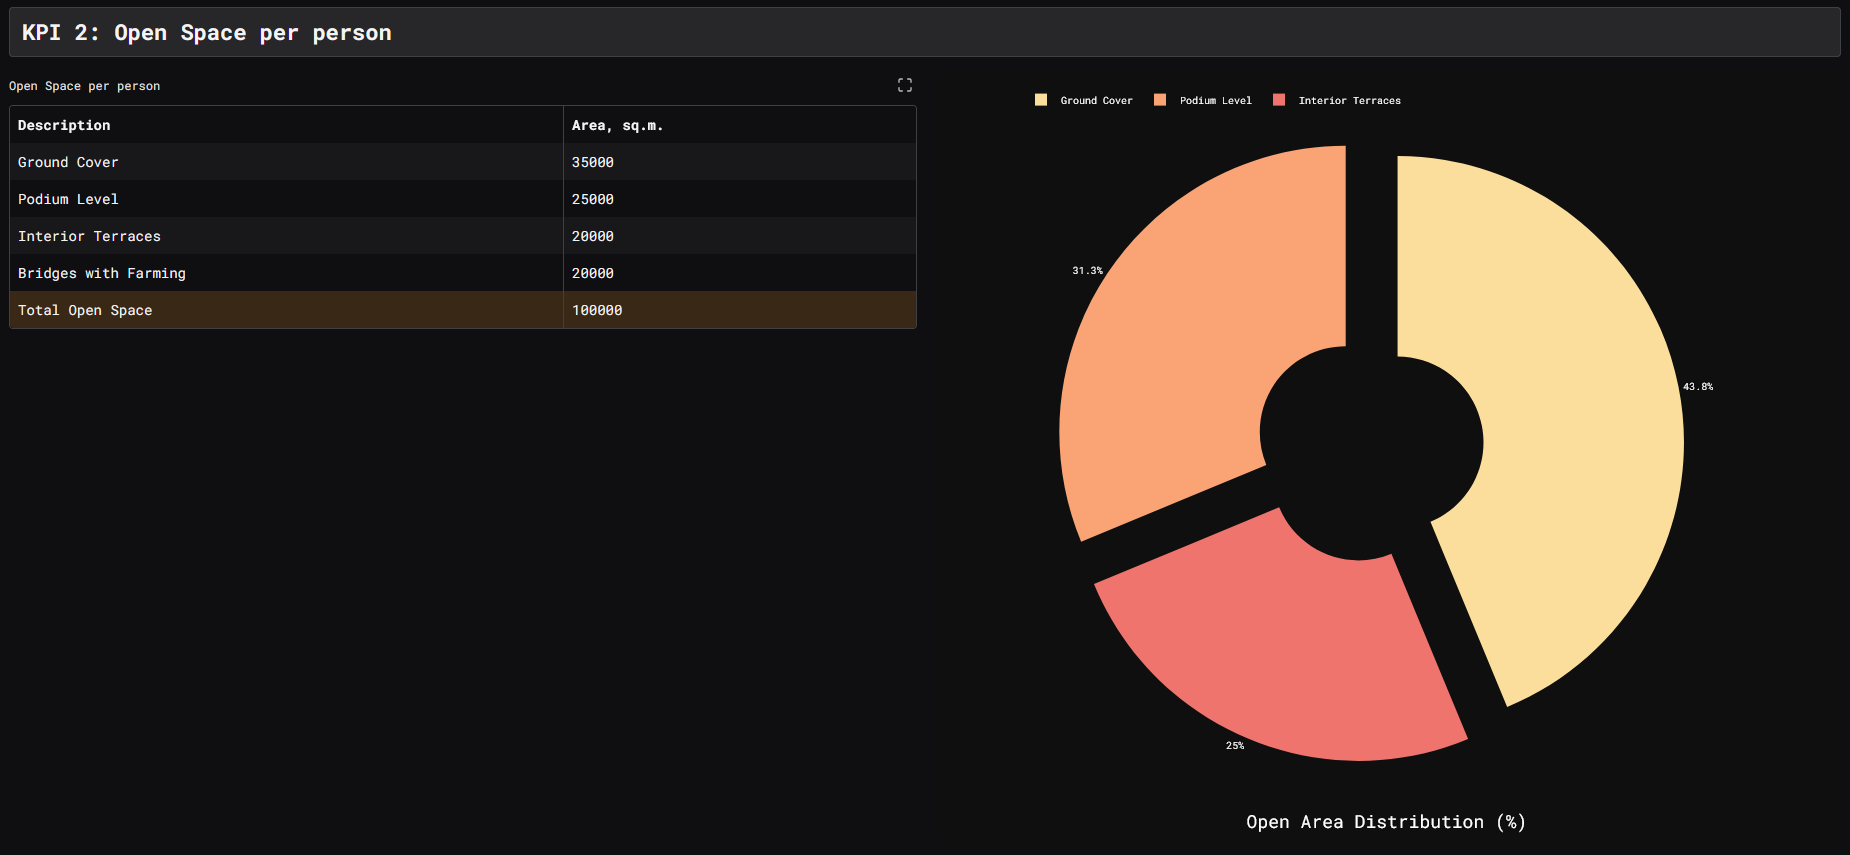
Service Team
The service team focused on accessibility and the strategic adjacency of amenities. Their approach involved analyzing existing amenity networks and proposing an efficient internal navigation system to enhance user experience throughout the project.
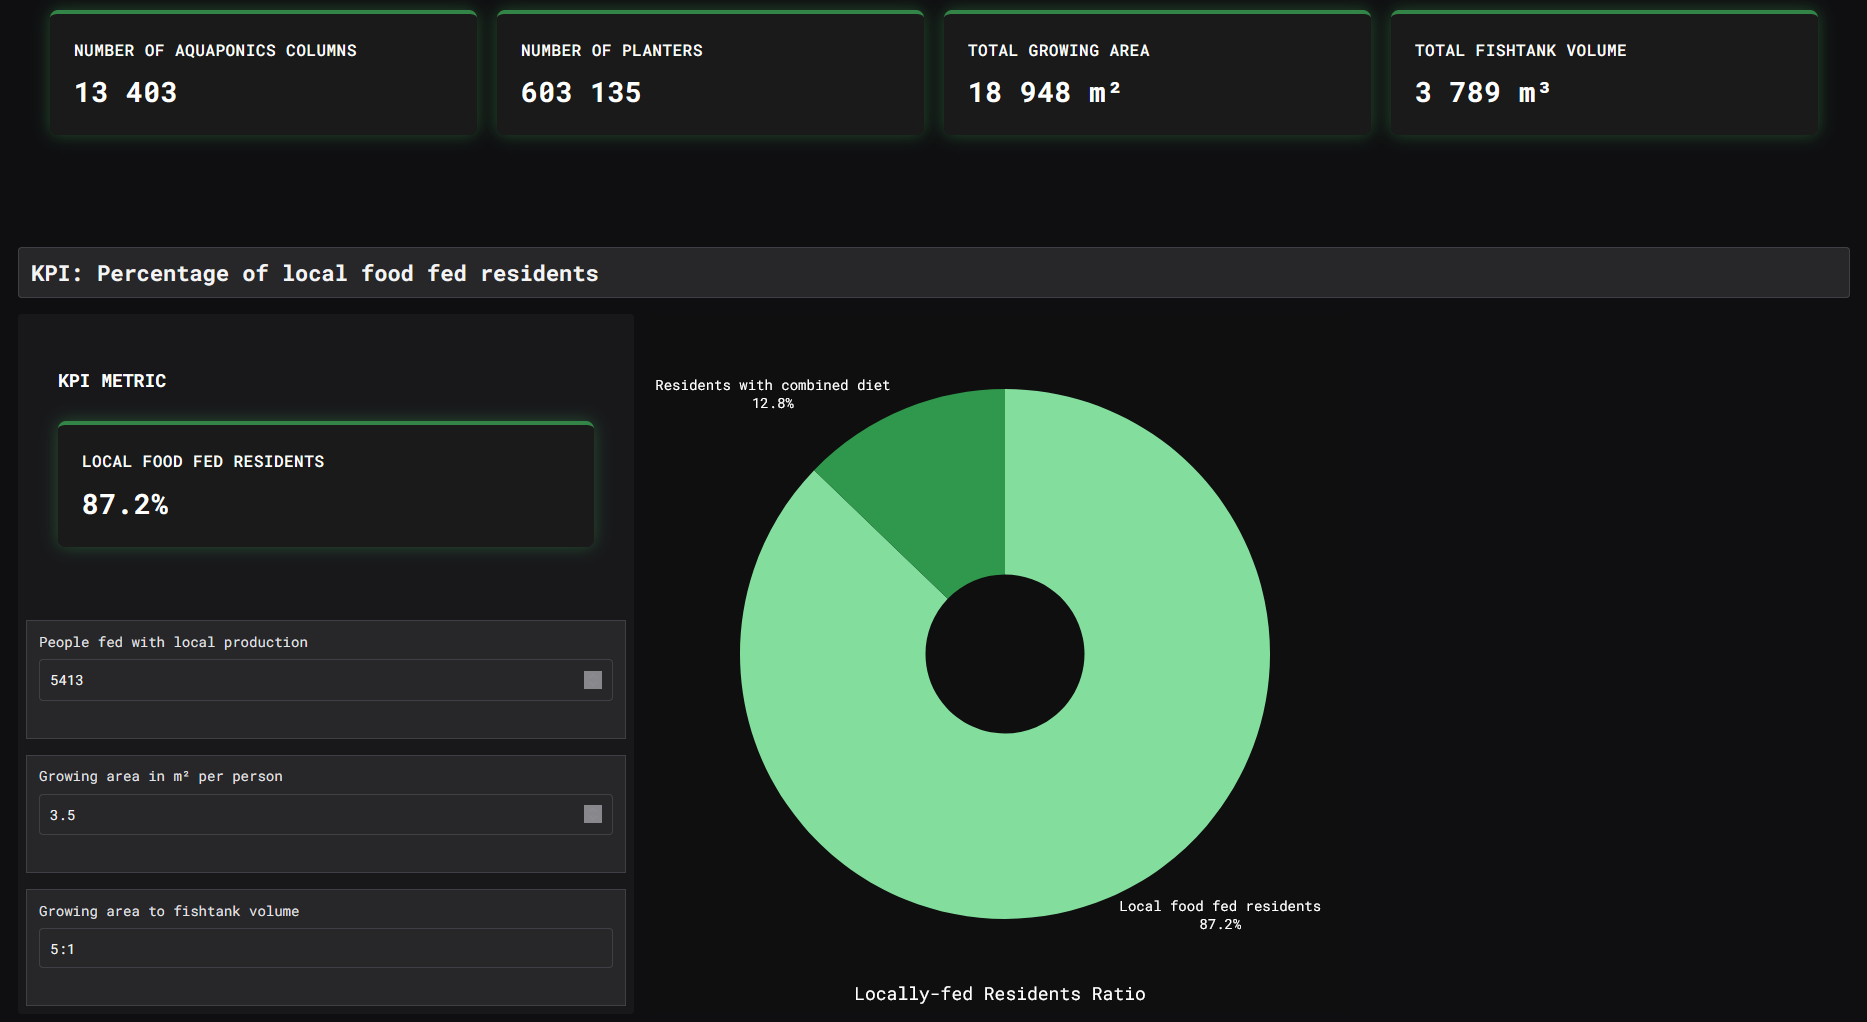
Industrial Team
In response to the demands of a successful closed-loop system, the industrial team explored strategies for on-site food production and the integration of industrial functions. Their work also outlines the reconfiguration of the Shinagawa transport hub, incorporating transit and industrial amenities within the building’s podium structure.
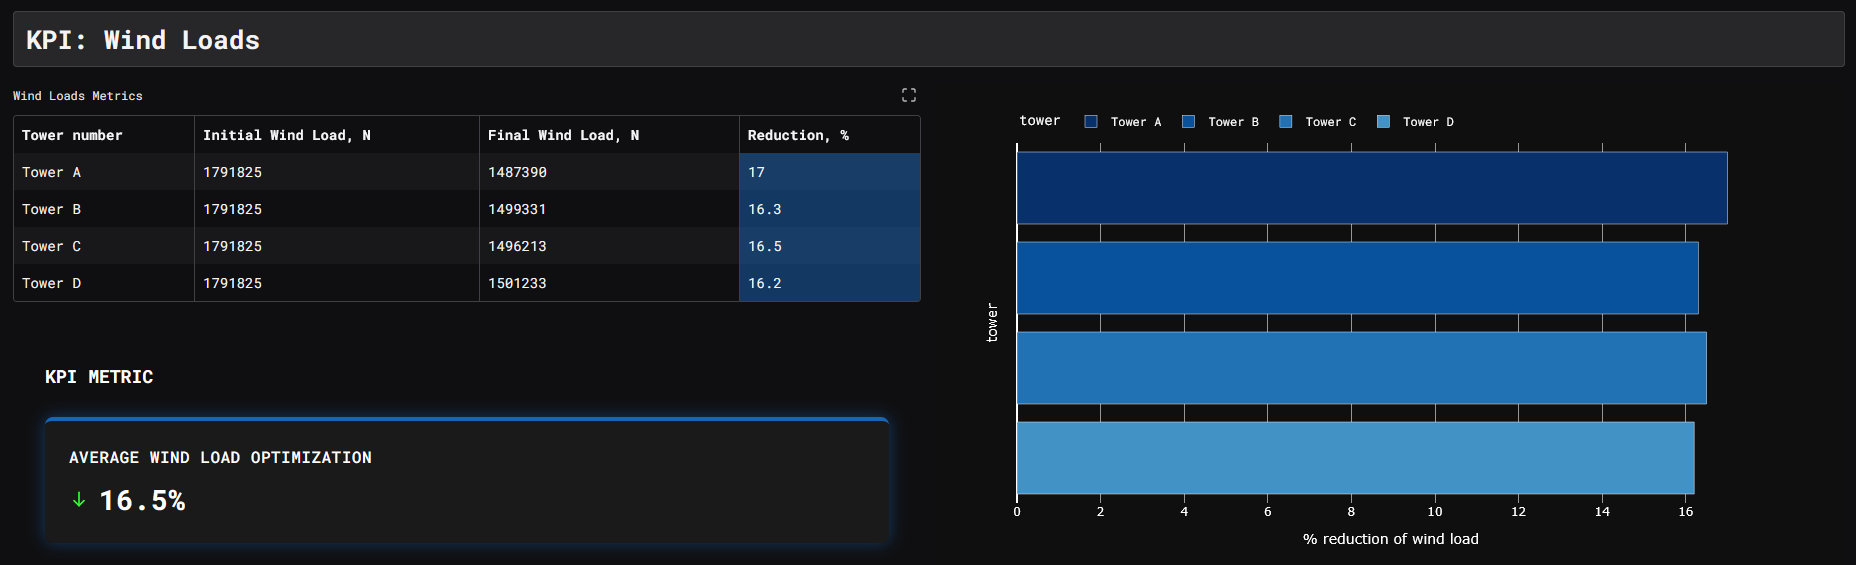
Structure Team
The structure team was responsible for developing a rationalized structural system for the entire building, including the towers, podium, and interconnecting bridges. Their objectives centered on structural analysis, with a particular focus on displacement and optimizing the overall form to minimize wind loads.
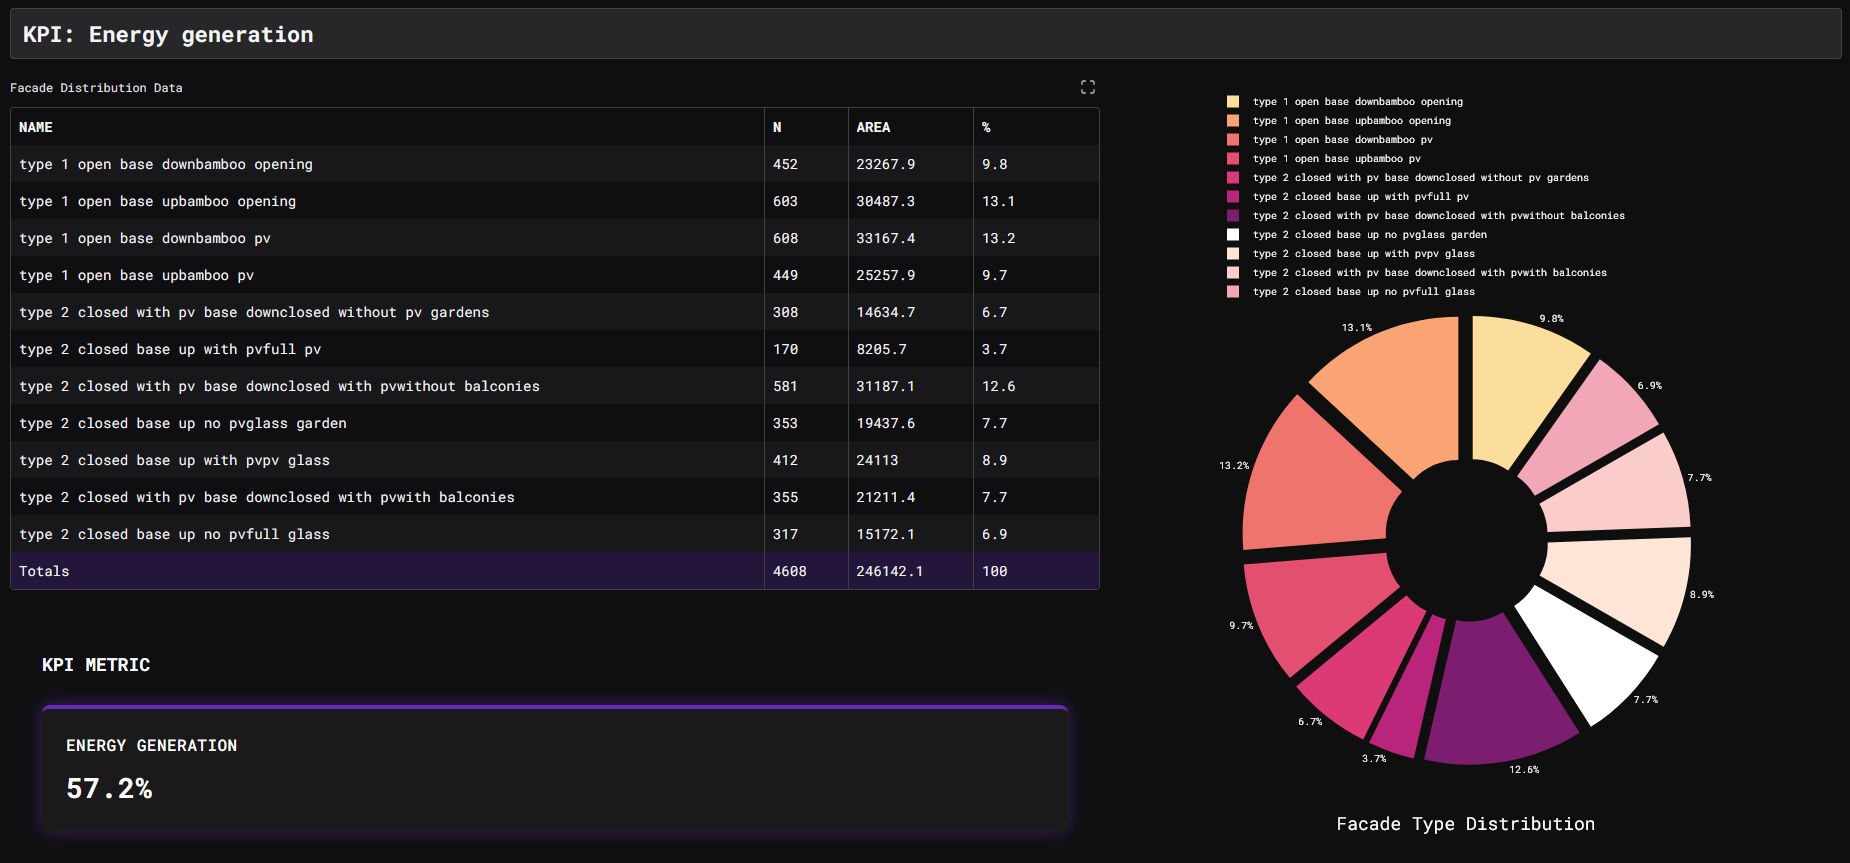
Facade Team
The facade team focused on the building envelope, aiming to strike a balance between aesthetic clarity, energy generation, and wind mitigation. Their work explored the distribution of different facade types and the overall panelization strategy.
The dashboard is available to view here: https://huggingface.co/spaces/angelica-ignateva/hyperB
