
Creating a streamlined pipeline to visualize and extrapolate financial data enabling a correlation with spatial geo-specific information.
The World and all countries alike have been increasingly more susceptible to events and developments in the geo-political theatre. It is not surprising that the world’s top two economic and military superpowers play a pivotal role in this theatre of events.
In the recent past, both the United States of American and the People’s Republic of China have increasingly been locking horns on multiple fronts. Therefore, it is an interesting field of research to delve into analyze the dynamic between these two nations on any particular front.
This project will delve into the correlation between the recent decline of the US Foreign Direct Investment (FDI) into China and explore whether or not this decline ties into agenda for Chinese military expansions and supremacy. We go about this objective whilst creating a pipeline of development for the extraction, processing and visualization of similar relevant datasets.
The Data-sets Involved
Whilst going about the brief for the project, the fascinating point these datasets reveal at first glance is the the reaches and differences between both countries because US controls it’s geopolitical power through the military (hard power) and China does it through ports that have potential to be used for military proposes (soft power).
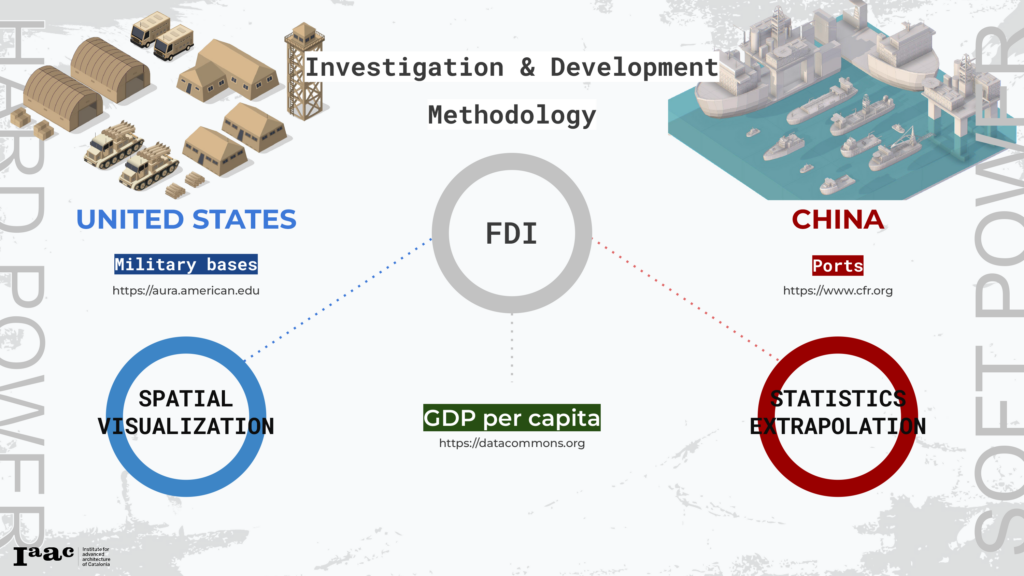
In this project we are working with 4 different data sets. To follow cross-border monetary flows we will analyse ;
- US inflows of FDI into China
- The evolution of the GDP per capita of both countries.
- To measure the geopolitical insecurity of both countries we will use a data set that shows the US military bases around the globe
- Ports Infrastructure China has invested into different countries over the last 20 years.
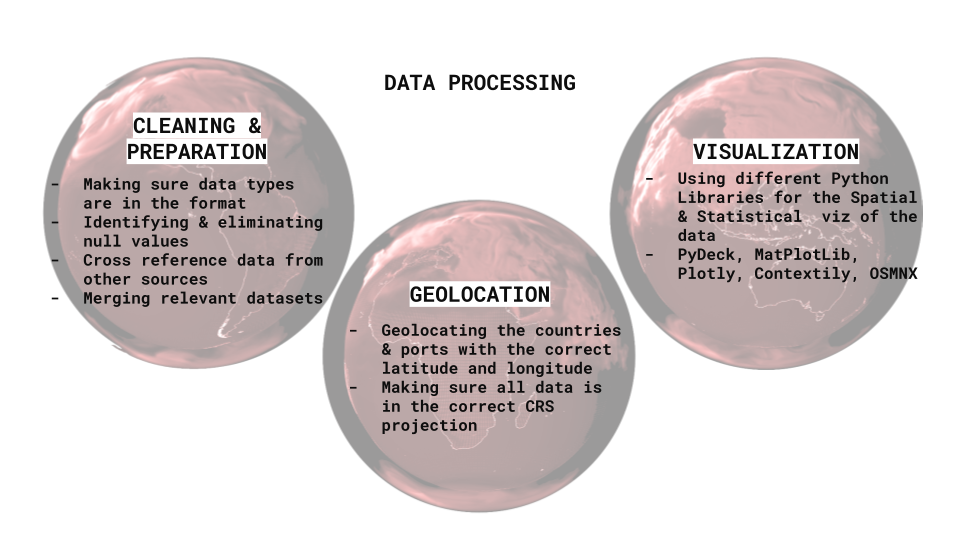
Data Processing
The Data processing involved the primary stage of cleaning and making sure there were no outliers and all the data fields were in the relevant formats to be utilised for the different Python Libraries for visualization. Some datasets would come without the respective geo-location and would have to be identified with the geopy library. Varies different Python libraries were utilised to create a visually impactful report.

The Analysis
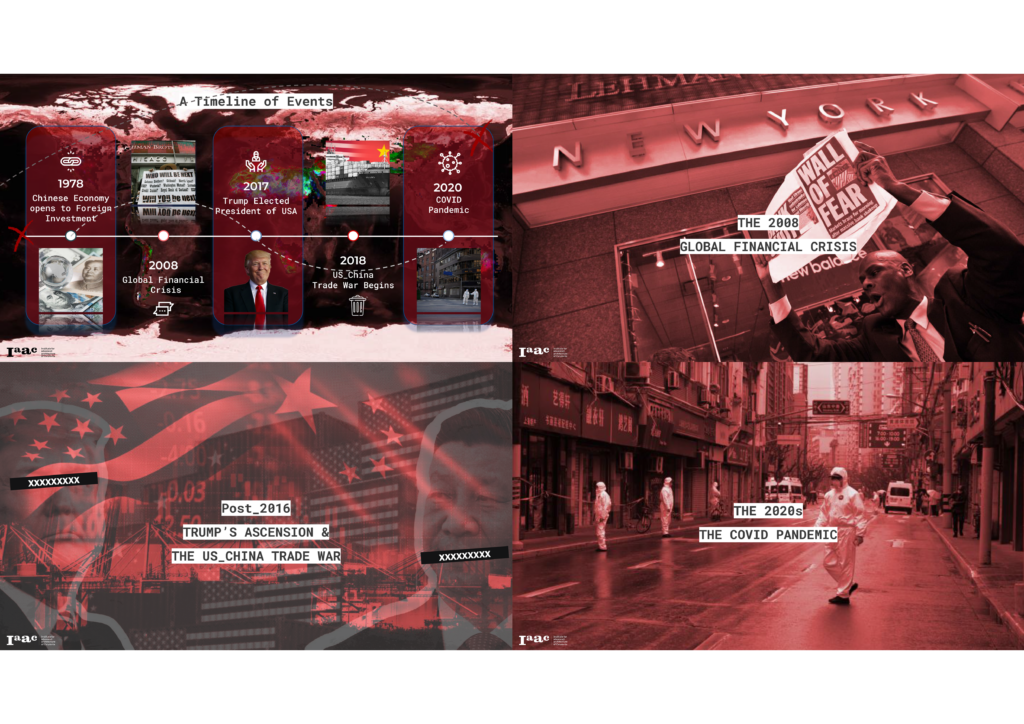
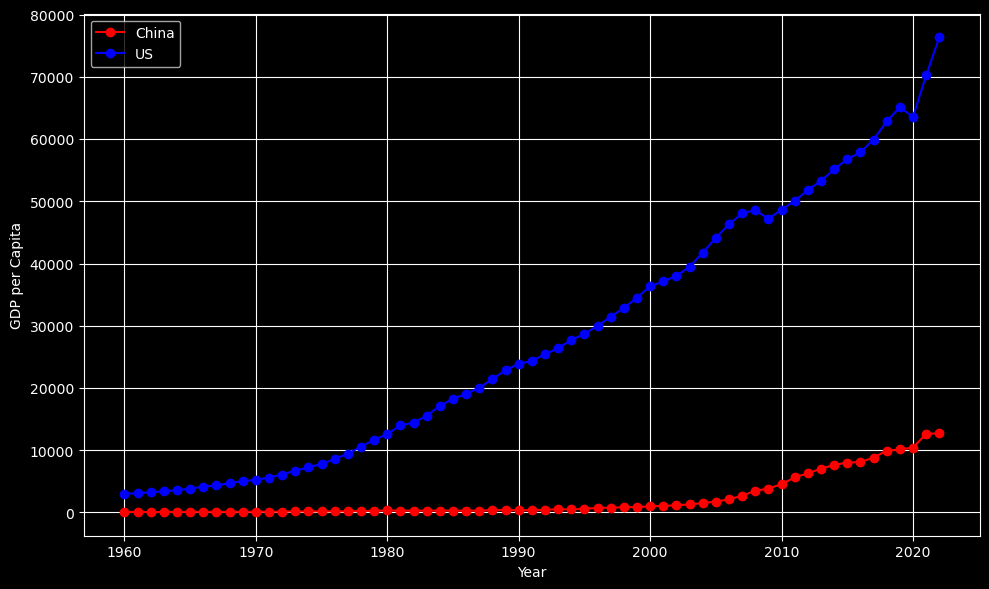
In the above graph we can se the evolution of the GDP per capita of both countries. This is important to understand the cost for the citizens of both countries of investing into their geopolitical strategy. While the GDP per capita has been growing at a similar pace in the US (except 2008 financial crisis and the pandemic), China didn’t spike until some decades ago after opening their economy to the global trade. There is a big difference between these two superpowers and that means that every dollar invested in their geopolitics is much more costly for the Chinese citizens.
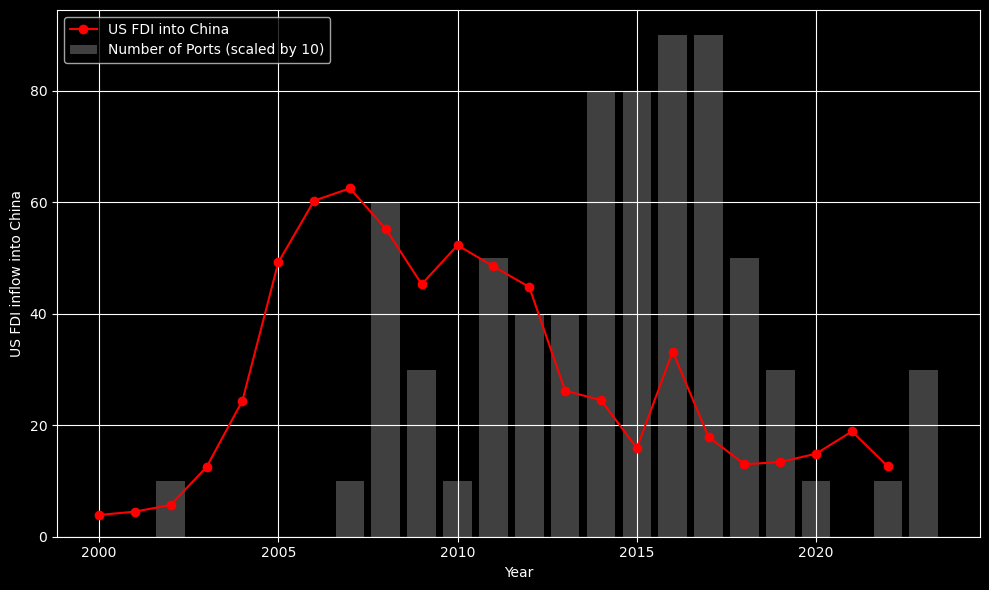
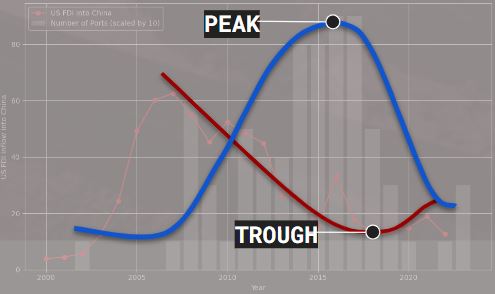
This graph analyses the US FDI into China compared with China’s investment into overseas ports. We see a clear correlation between this two metrics. When US FDI inflows to China start decreasing, the Asian superpower starts investing heavily into overseas ports. After the 2008 crisis, the US started investing less into China and China saw that as a threat or maybe an opportunity to gain power in the global geopolitical spectrum. We also see how after the pandemic, China resumed with their plans of expansion and we expect this country to continue increasing their presence through overseas ports around the world.
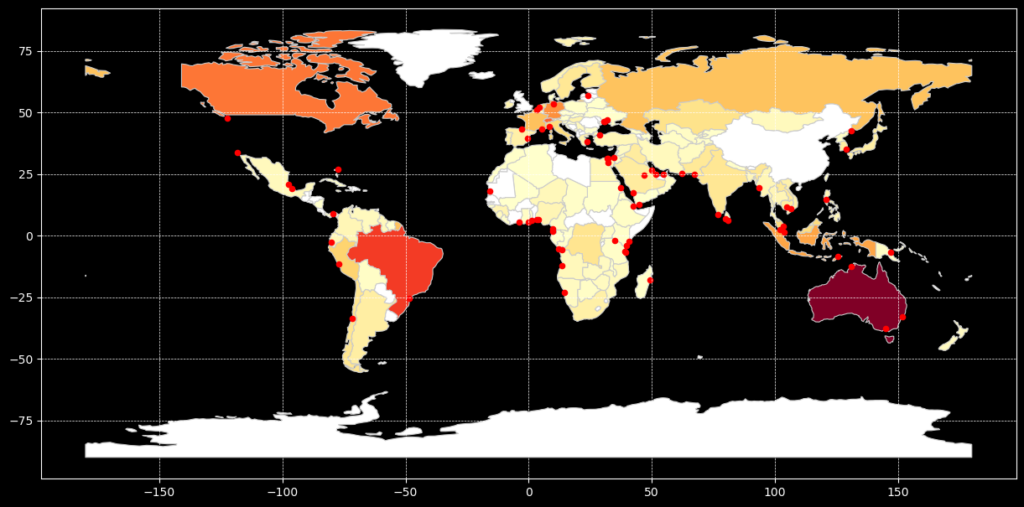
MAPPING THE ‘WORLD’S POLICE’
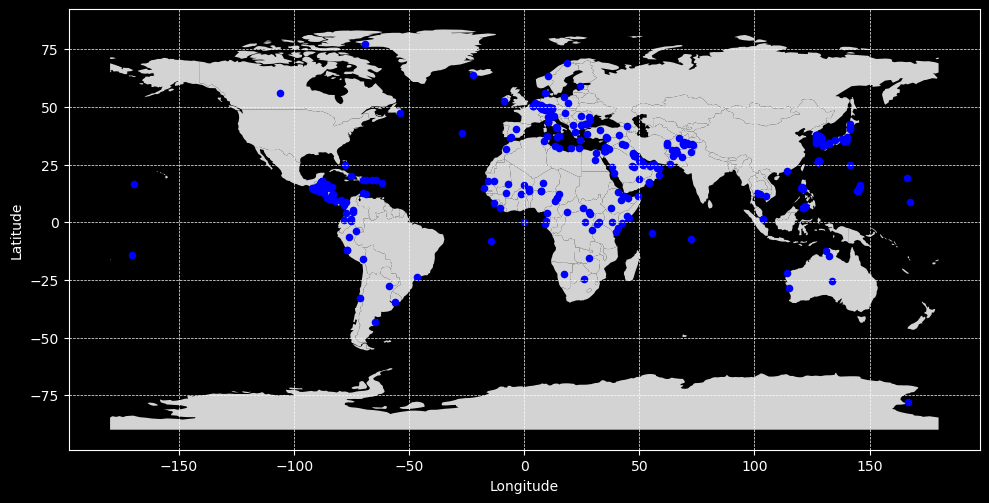
This are all the US military bases in the world by 2020
This heatmap shows the comparison between 2015 and 2020 of the US overseas military bases. The darker countries are the ones that have the most amount of US military bases. We see how the United States has increased their military network in Japan, Northern Africa and the Middle East.
THE CHINESE COUNTER-PUNCH
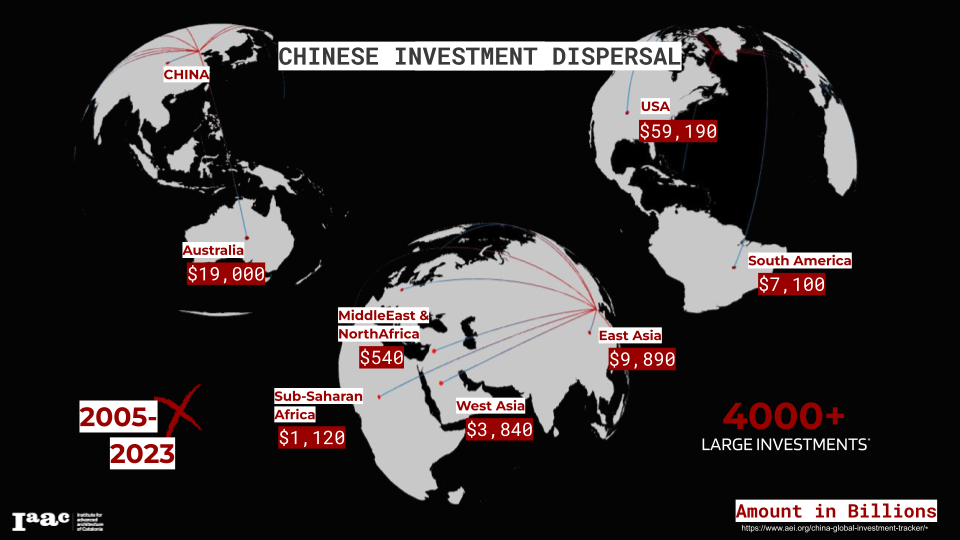
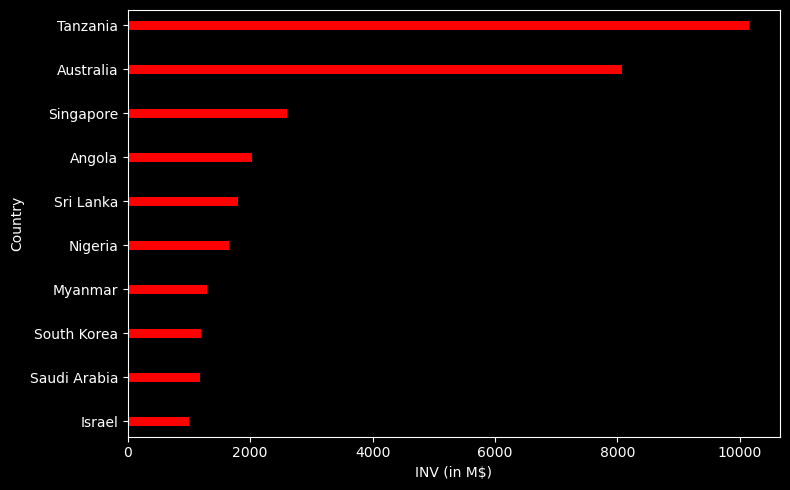
This graphic representation shows that China has been engaged in trade and economic activity with all regions of the globe. USA namely has been the biggest contributor to that, which highlights why the Trade War with the USA has been a sore point in the relations between the two countries. Australia has also seen massive inflow of large investments from China.
As analysed statistically earlier, China has also rapidly increased their port infrastructure presence. The Spatial Visualization above aims to highlight the sheer number of ports that have been constructed across the span of the globe, whilst showing the scaled investment made into each of these ports. The color coding helps visualize the number of ports that been been categorised as having ‘Potential for Naval Use’ (GREEN). As can be seen, most of the port infrastructure investments are Naval use capable
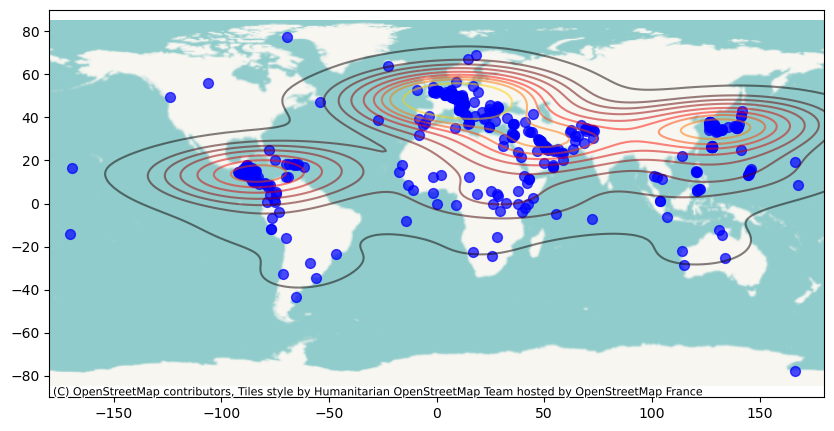
developing Port Infrastructure
This map is a comparison between the 4000 biggest investments made by Chinese companies in the last two decades and the location of the overseas ports they control. The darkest countries are the ones that Chinese companies have made the biggest investments. For this analysis we excluded the US because is by far the country where Chinese companies have put the most amount of money and by doing this we will be able to analyse more accurately which areas of the globe is China more interested in doing business.
In terms of economic investment we can highlight a few countries like Australia, Brazil and Canada but there is not a specific region where the Asian country invests more. This shows that China invests into overseas ports for other reasons rather than economic and with the ports we can see some patterns. A lot of overseas ports are concentrated in the Gulf of Guinea, Middle East and the South East of Asia. This highlights the Chinese control over global trade and the potential of this country to have military presence all over the globe. Even though a lot of ports are located in these 3 regions, they are spread around the globe and that strengthen our reasoning.
REGIONS OF CONTROL
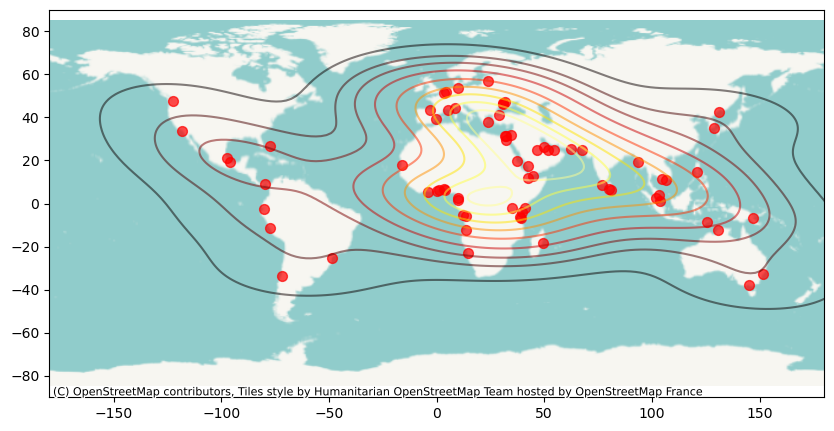
Finally, we wanted to understand if both countries are interested in the same regions or they have different approaches for their geopolitical control. As we can see in the first map, shows that China’s main areas of control are in Central Africa, Middle East and South East Asia while the US has the most military presence in Central America, Europe, Middle East and Japan. Both superpowers are very present in the Middle East but they don’t really share the rest of the control areas. US heavy presence in Japan goes back to the 2WW and is still a huge enclave to show their strength and proximity to China. On the other hand, China started investing into overseas ports around 20 years ago so we can expect an increase of their naval potential presence over the coming decades. Time will tell if they will opt to control the same regions as the US or they will choose a different strategy.
CONCLUSION
After all this analysis we can conclude a few things:
- While the US exerts geopolitical power through military presence (hard power), China does it by investing in overseas ports (soft power) that have potential for military proposes.
- There is a clear correlation between the decrease of US FDI inflows and the increase of Chinese investments into overseas ports. This shows the importance of the relations between this two countries and how monetary flows can affect geopolitics.
- China’s GDP per capita has been growing at a very fast pace but is still very far from the US. This means that the investment per capita into geopolitical matters is much more expensive for the Chinese citizens and raises the question whether China will have the ability to continue investing at this pace.
- Chinese companies economic investments in the last 20 years have almost no geographical correlation with Chinese investments into overseas ports. This strengthen the idea that the Asian country invests into ports for geopolitical and potential military matters.
- Although presence of both countries (military and port) is spread all over the globe, we struggle to see a direct correlation between areas of control. This can be due to two factors; either is to early to see this correlation because China started investing into ports just two decades ago or they follow different geopolitical control strategies.
SOURCES
US military bases: https://aura.american.edu
Chinese overseas ports: https://www.cfr.org
FDI:
GDP per capita: https://datacommons.org
