REIMAGINING WATER TREATMENT INFRASTRUCTURE THROUGH
BIO-BASED SOLUTIONS
PROJECT OVERVIEW
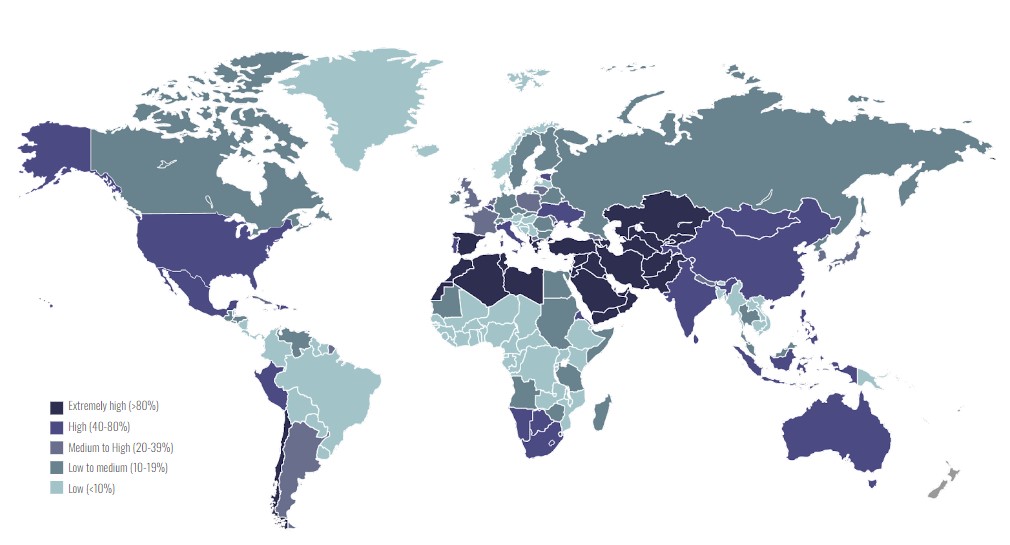
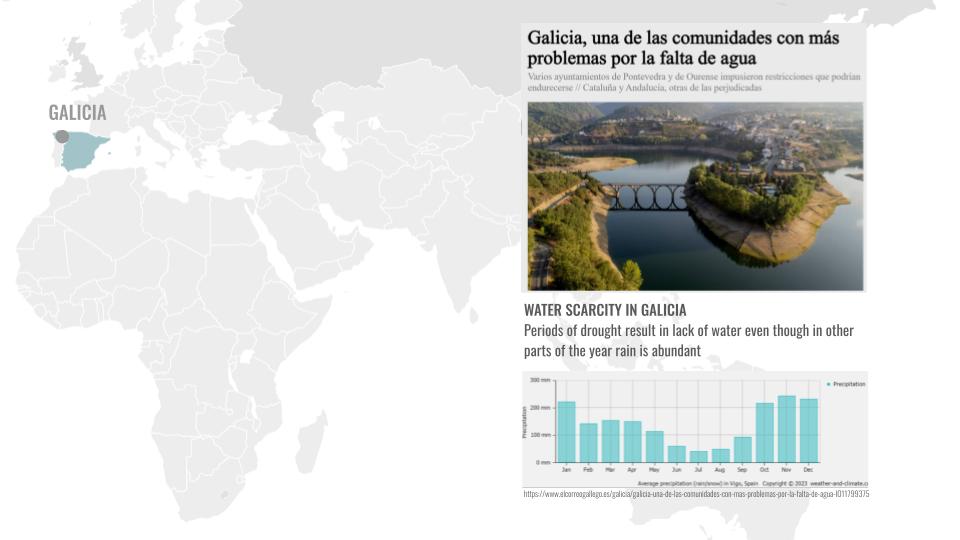
WATER STRESS
Due to the climate change, inefficient irrigation systems for agriculture, population growth and inefficient water infrastructure, the water stress in the world is increasing. But we question ourselves if water is really a scarce resource or is it just the issue of how the water is managed and stored? Studies show that ? of all produced water in the world is lost or wasted, which is equivalent to the annual water consumption of china. And also many locations with abundant rainwater seasons still face water scarcity.
The current water treatment facilities are very industrial and centralized. Around 24.150gwh of energy is consumed yearly in Spain for water facilities and upto 14mi tons of CO2 is emitted from these centralized water facilities.
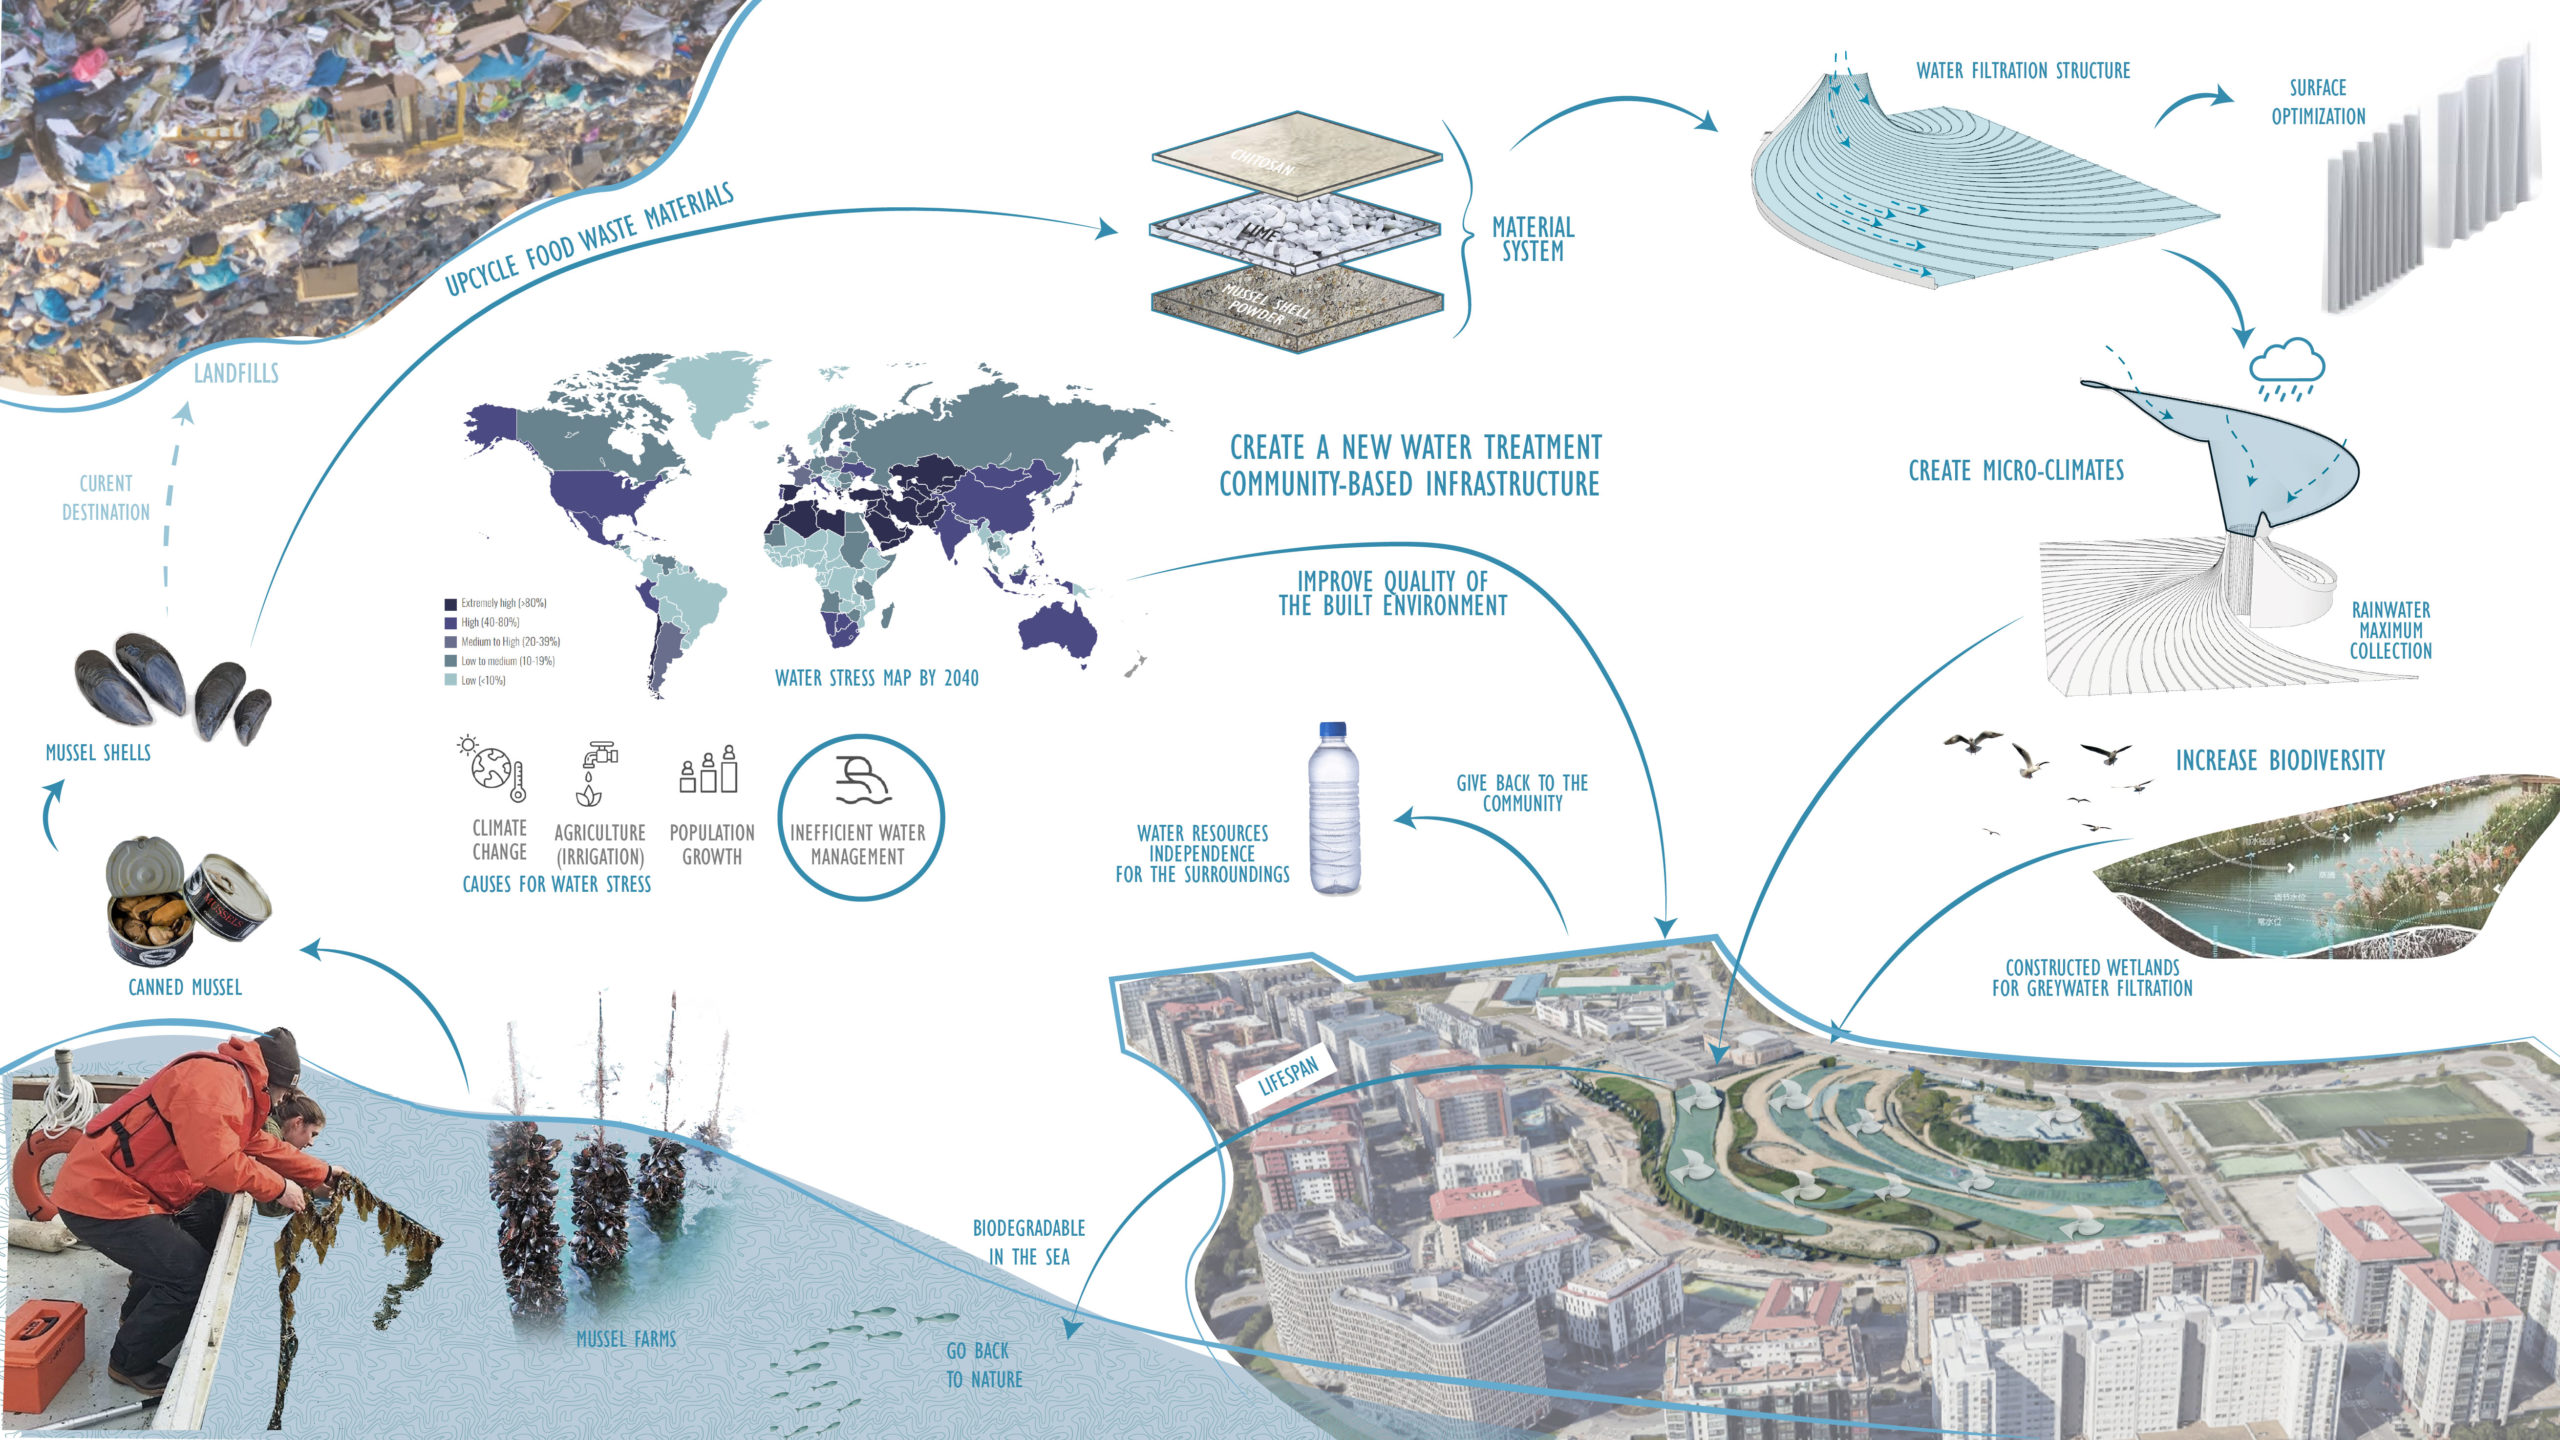
WE NEED TO CHANGE THE RELATION BETWEEN WATER MANAGEMENT AND COMMUNITIES, AND START SEEING WATER AS ABUNDANCE, NOT SCARCITY. WE MUST CREATE NEW WATER INFRASTRUCTURES THAT ARE CLOSER TO THE CONSUMERS, EMITS LESS CO2, AND THAT TAKE ADVANTAGE OF NOVEL SOLUTIONS REGARDING WATER TREATMENT, UPCYCLED MATERIALS, AND COMPUTATIONAL DESIGN. WE NEED TO THINK FROM WASTE TO TAP.
MATERIAL EXPLORATION
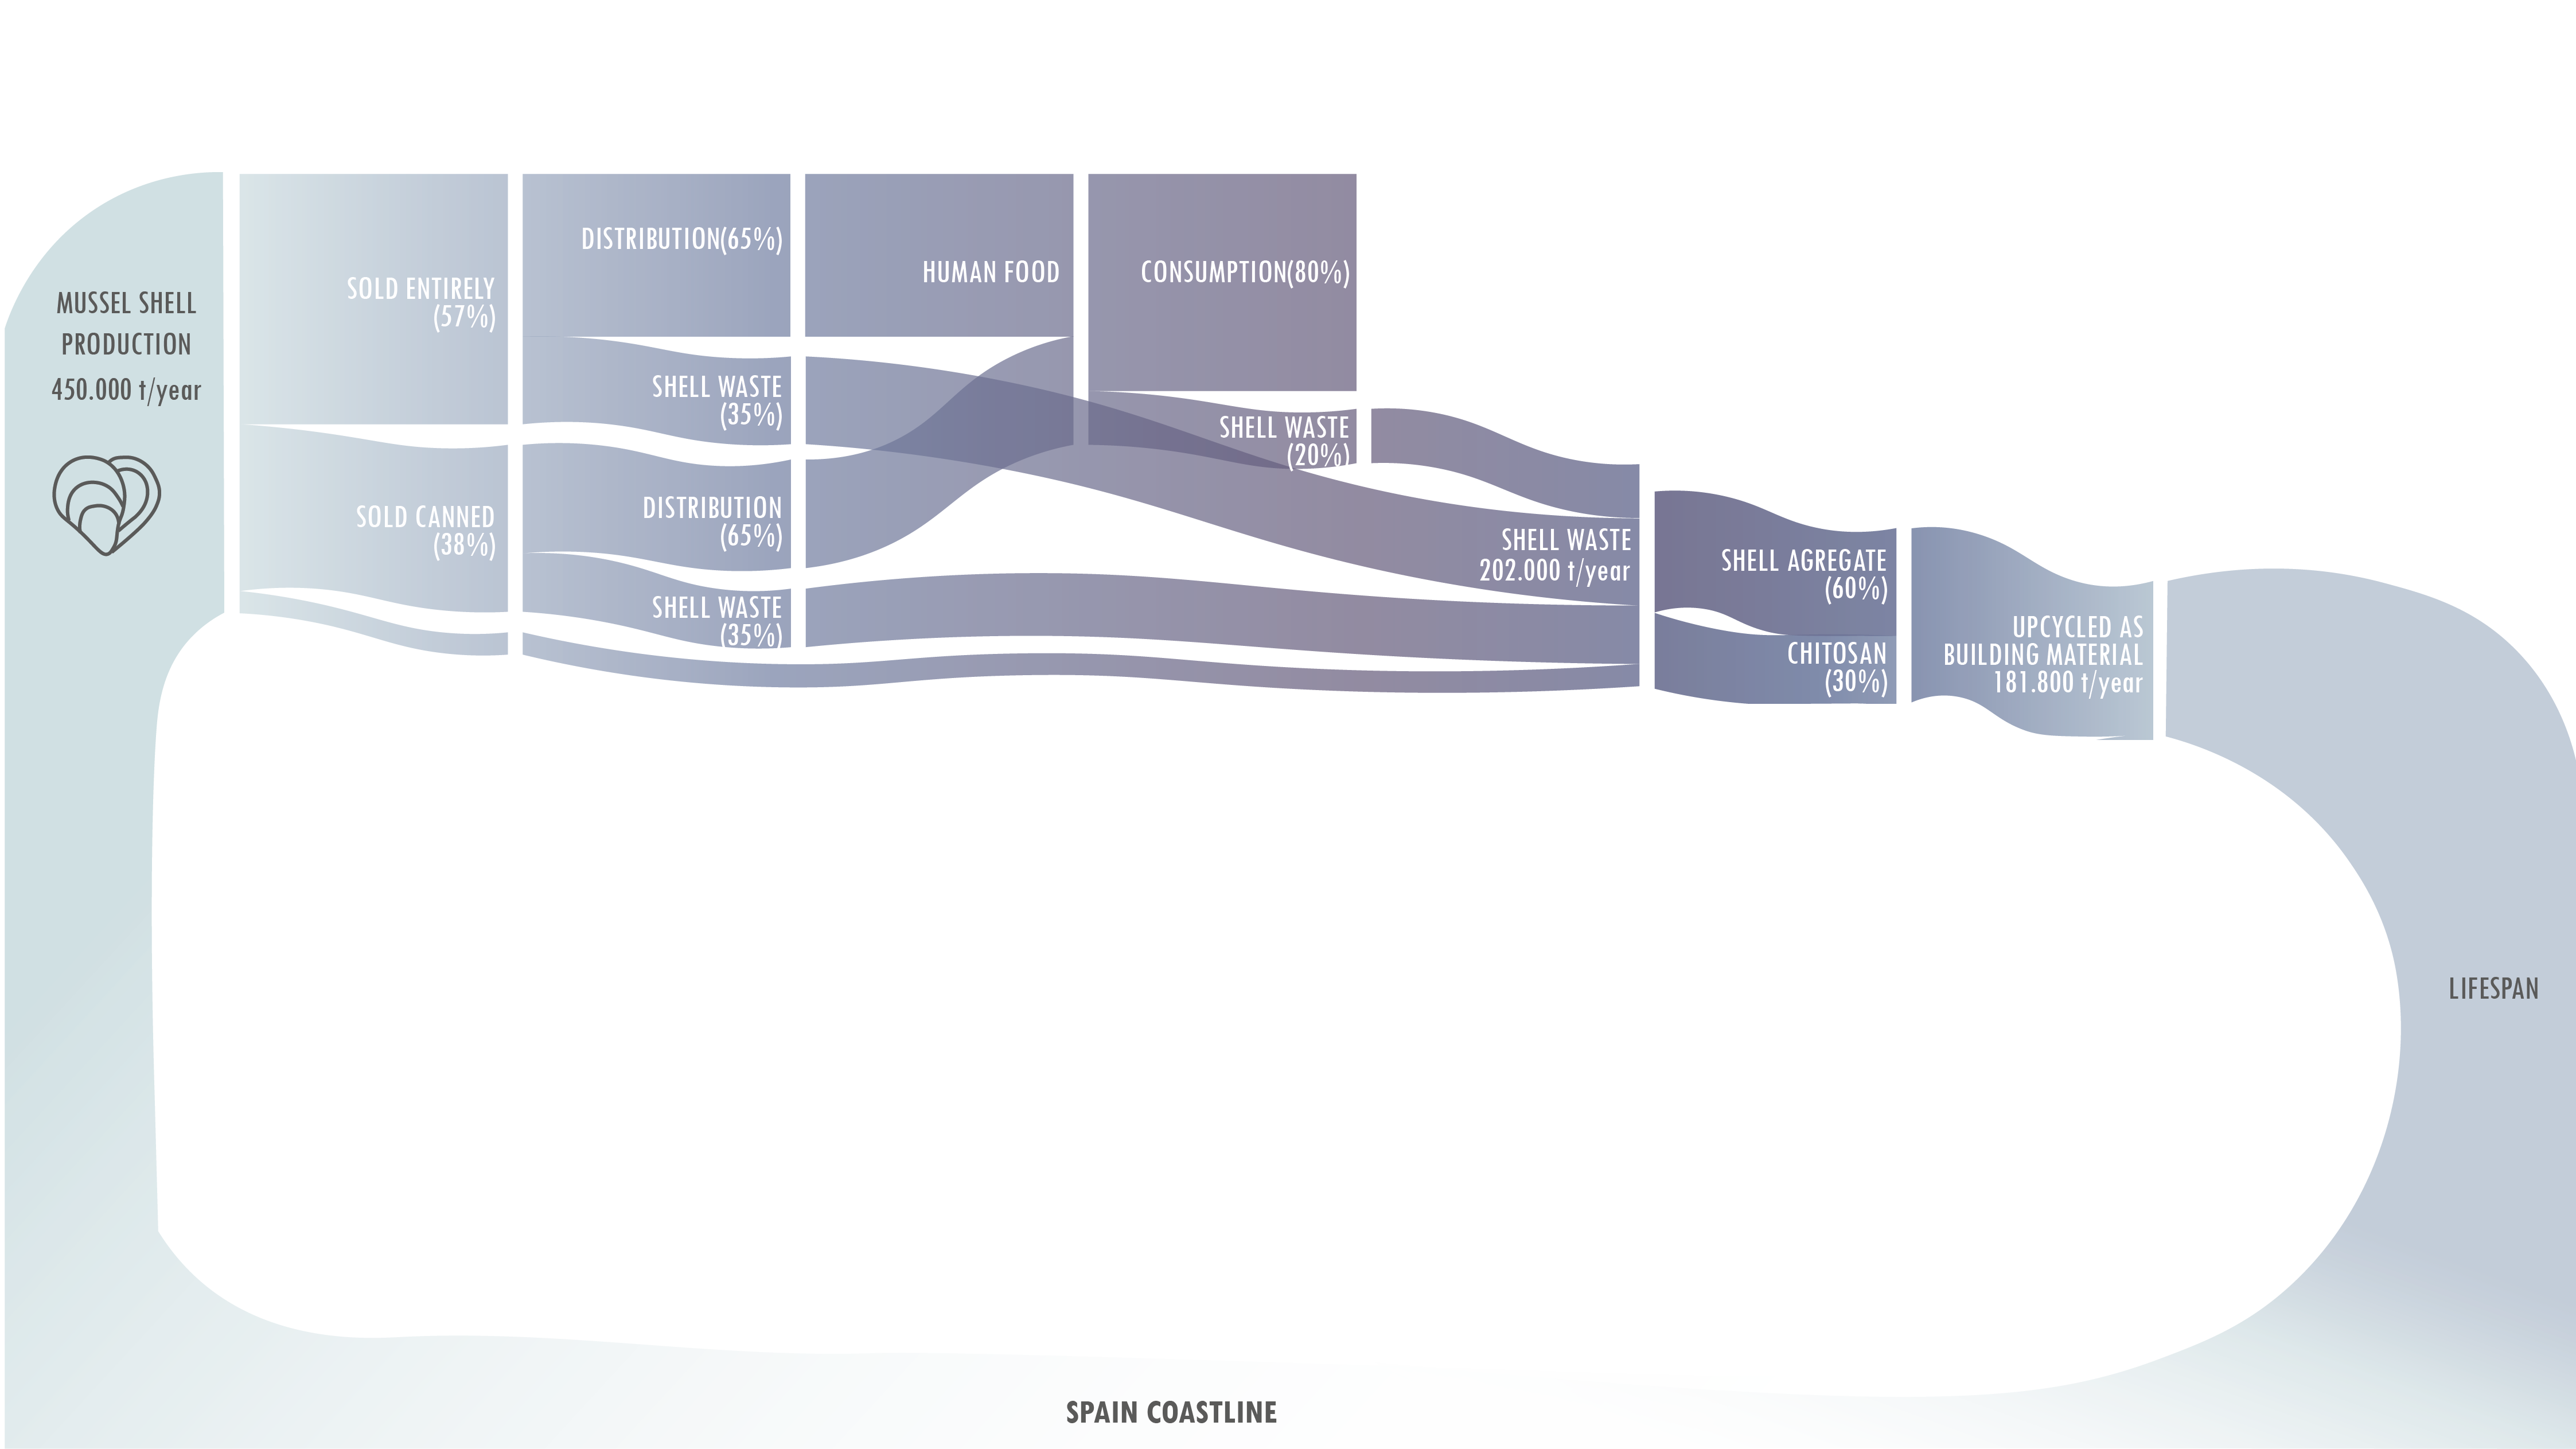
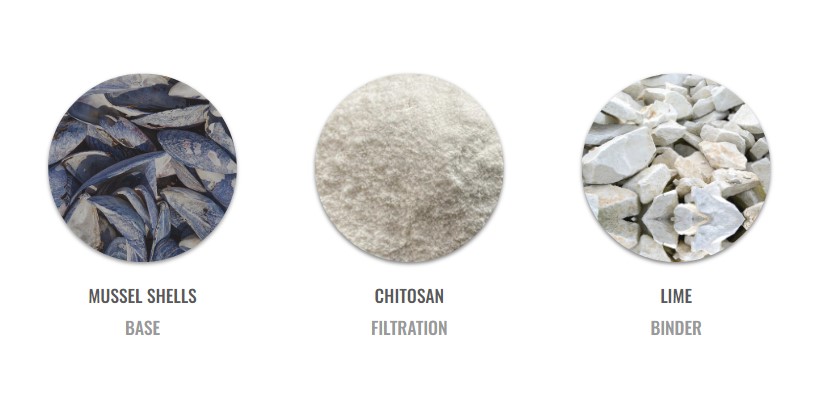
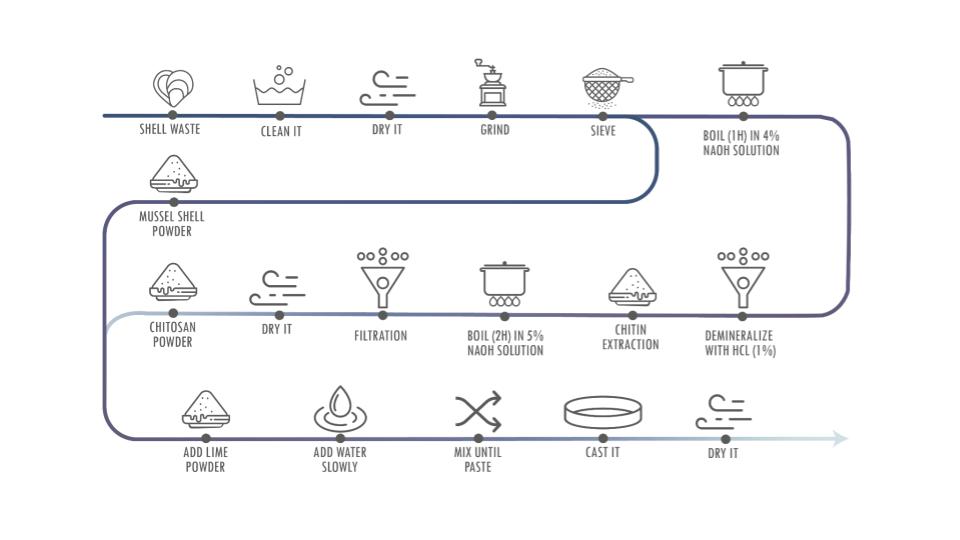
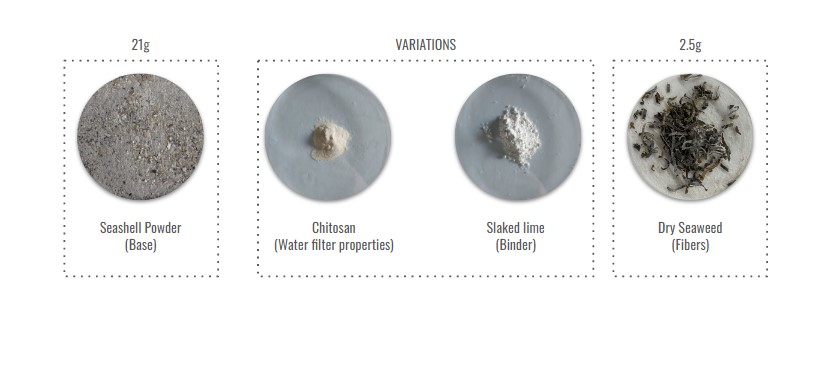
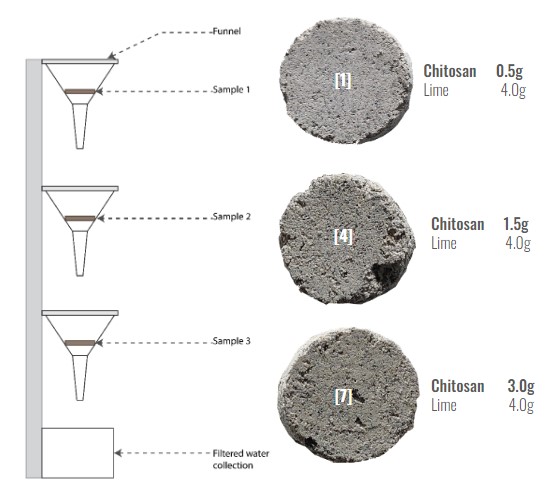
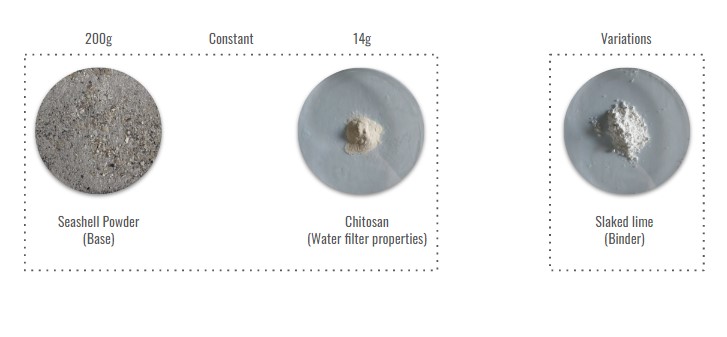
One of the novel solutions for water filtration is the use of chitosan, a biopolymer that can filter many constituents of grey water and also rainwater. And it can be extracted from crusteceans and molluks skins and mussel shells. Chitosan is the second most abundant biopolymer on the planet (non-toxic, biodegradable) and helps filter organic and inorganic pollutants such as heavy metals, suspended solids, fat and oil impurities, bacteria, ammonia and textile dyes.
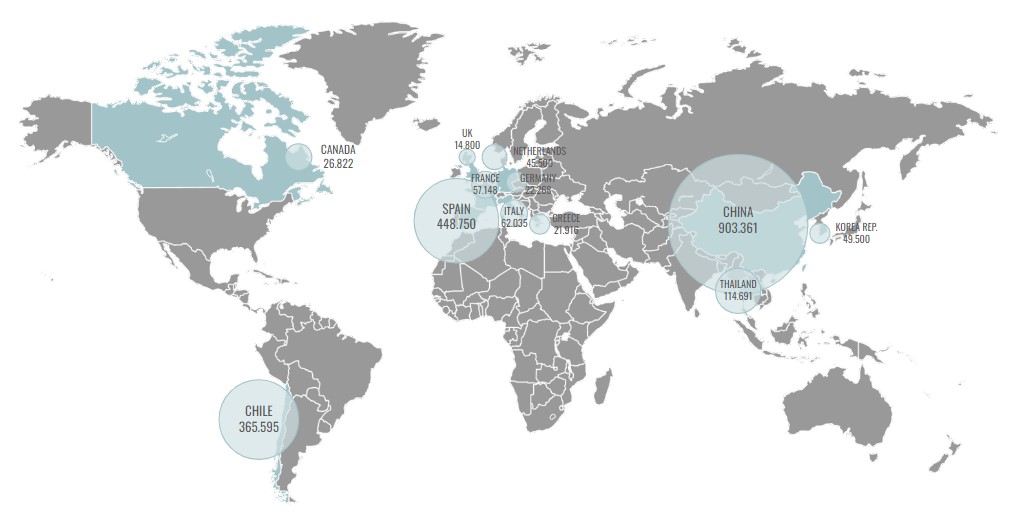
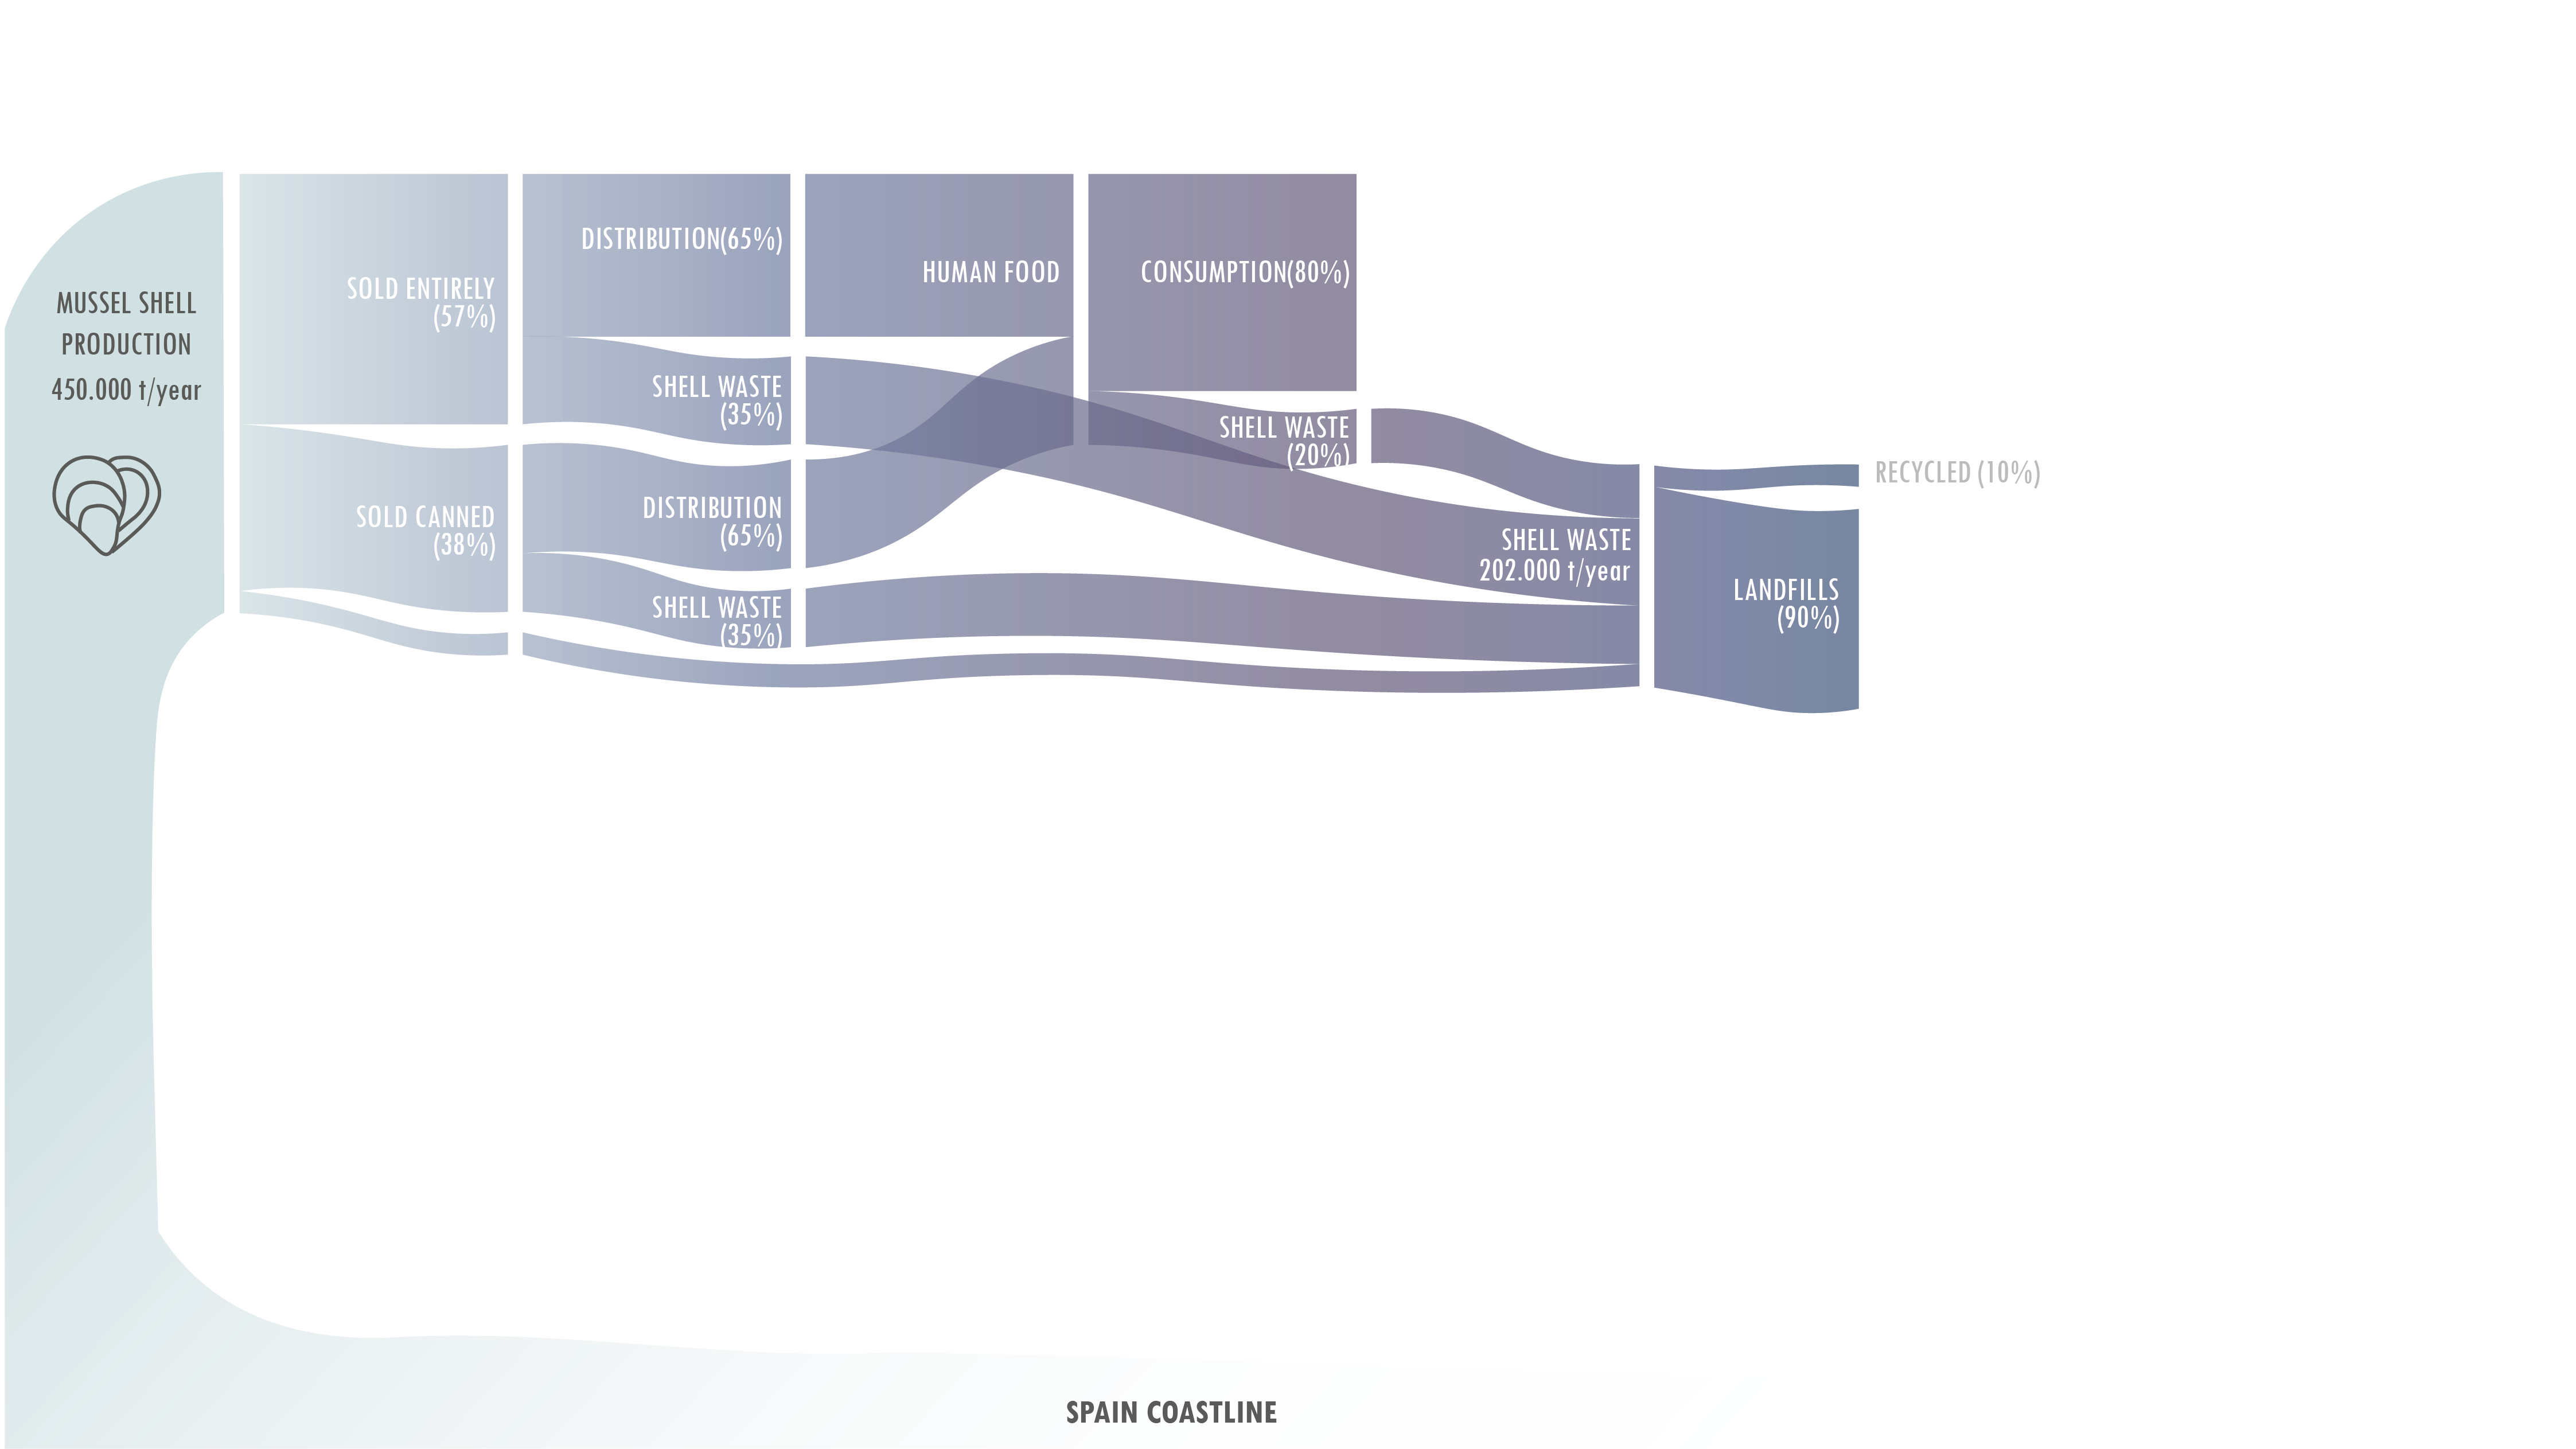
Spain is the Second largest producer of mussel shells.
EXPERIMENTS
INITIAL TESTS // EXPERIMENTING WITH EXISTING RECIPES
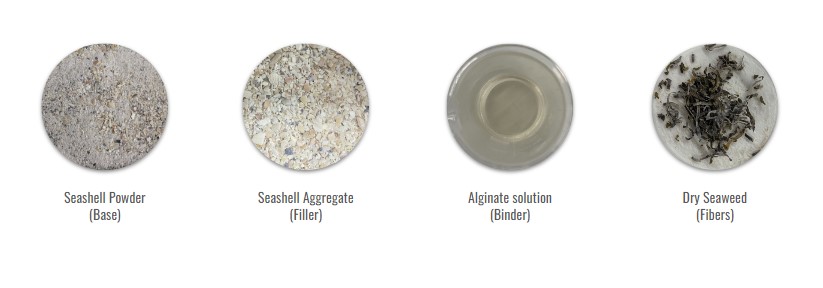
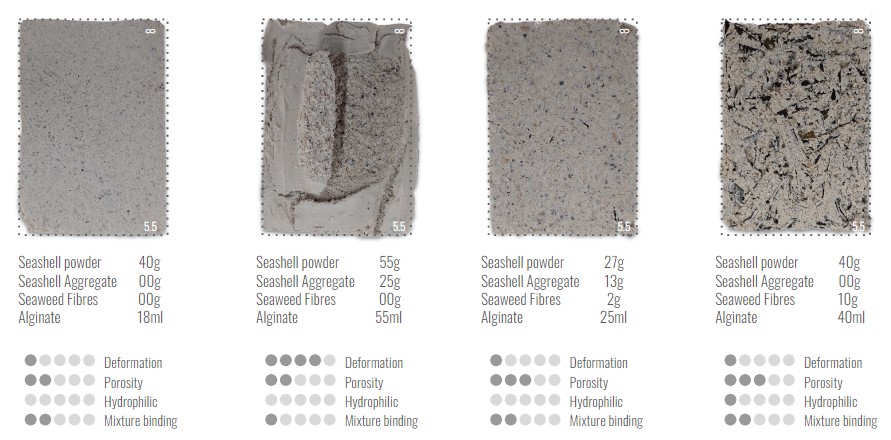
2nd TESTS // TESTING BINDERS AND ADDING CHITOSAN
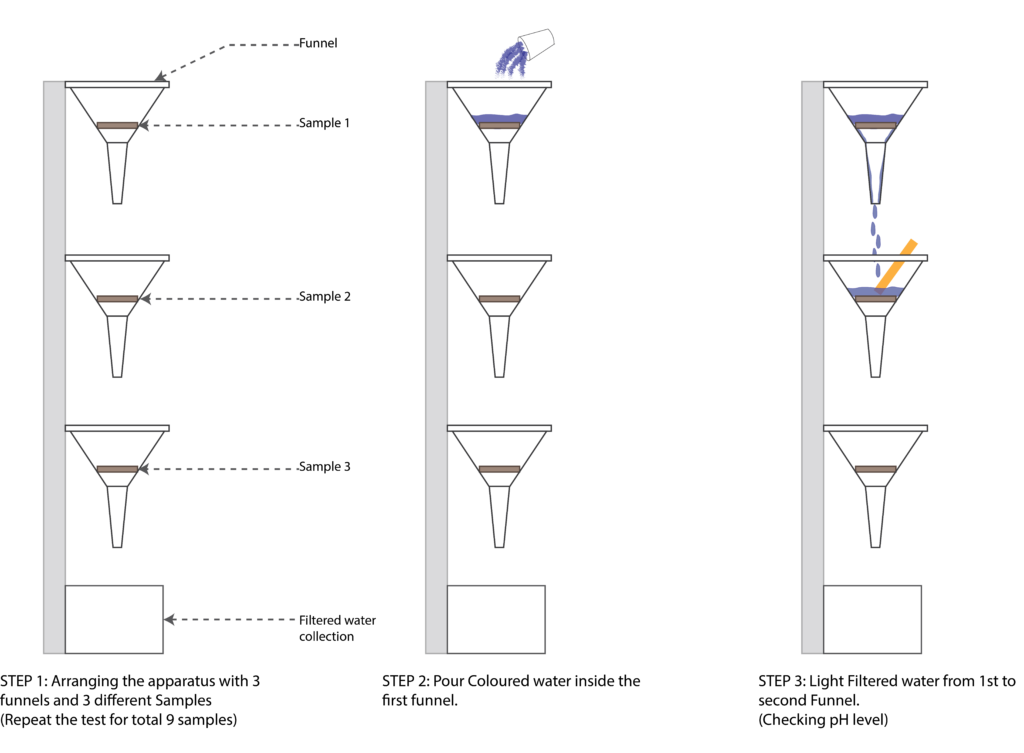
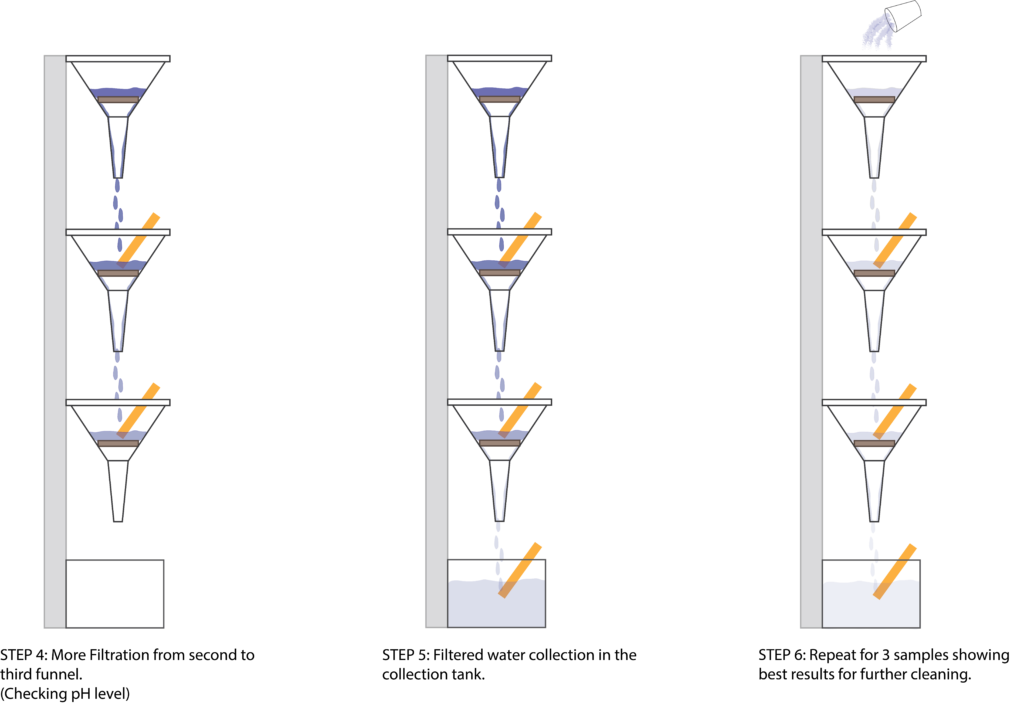
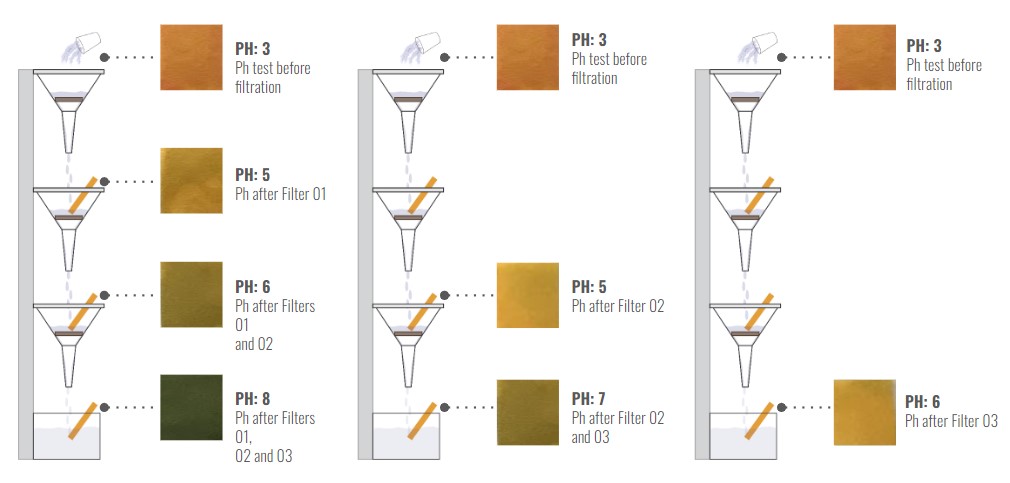
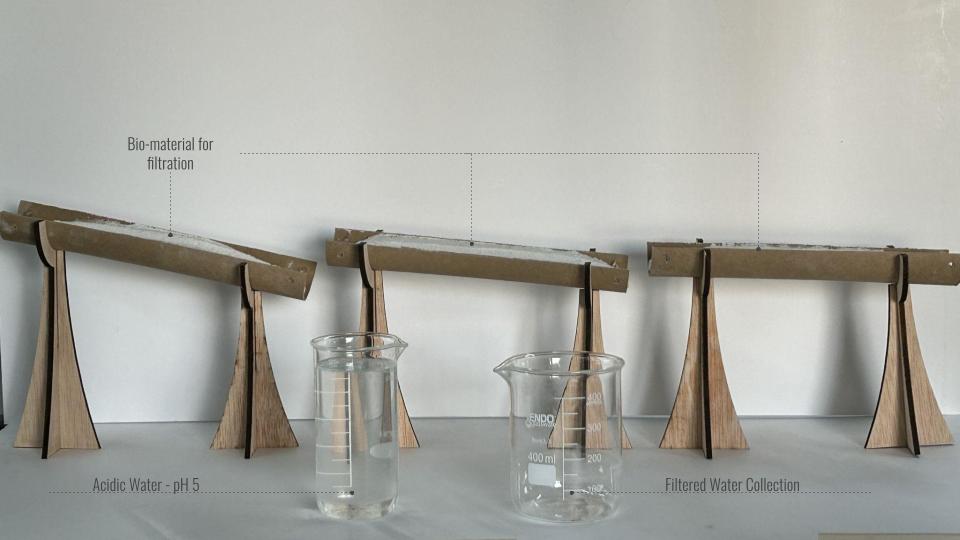
FILTRATION TEST 1
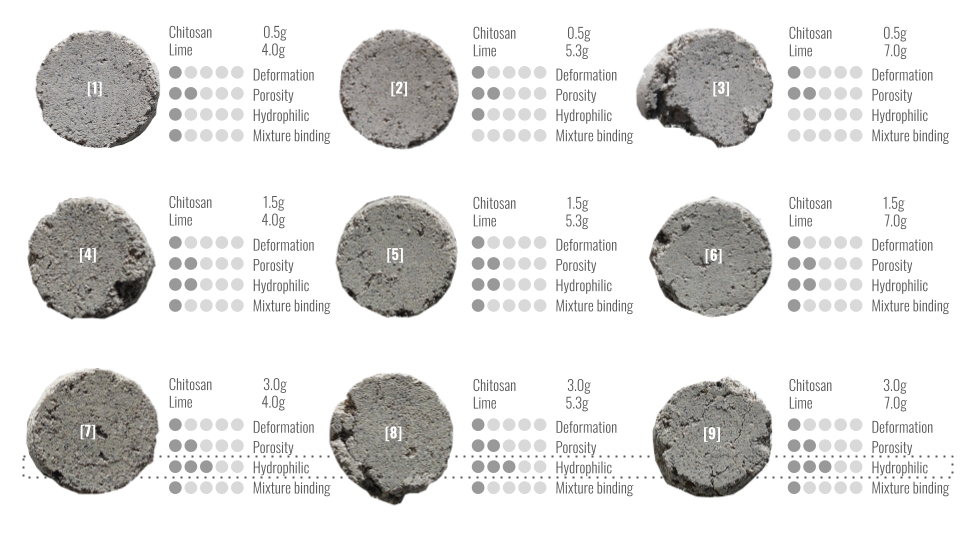
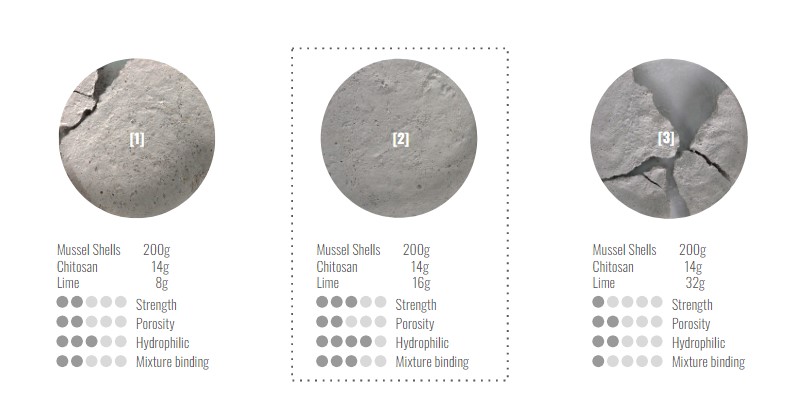
3rd TESTS // REMOVING SEAWEED AND TESTING VARIATIONS IN BINDER QUANTITY
FILTRATION TESTS 2
TEST 1
3 material channels at different inclinations

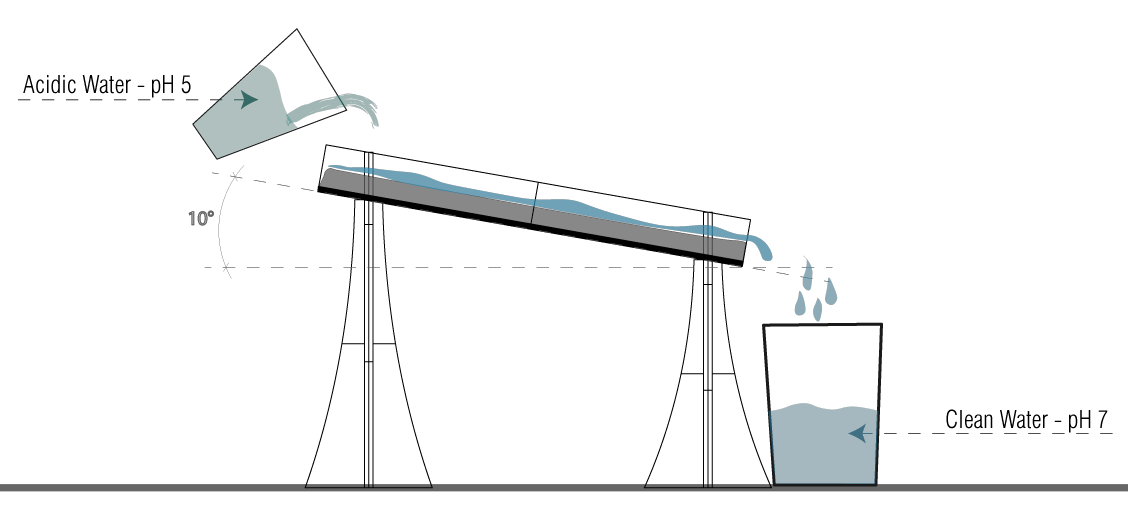
CONCLUSION
Length Travelled – 24cm
No. of Passings – 3
Angle – 10°
Water Travel time – 1.8 – 2.5s
pH Change – from 5 to 6
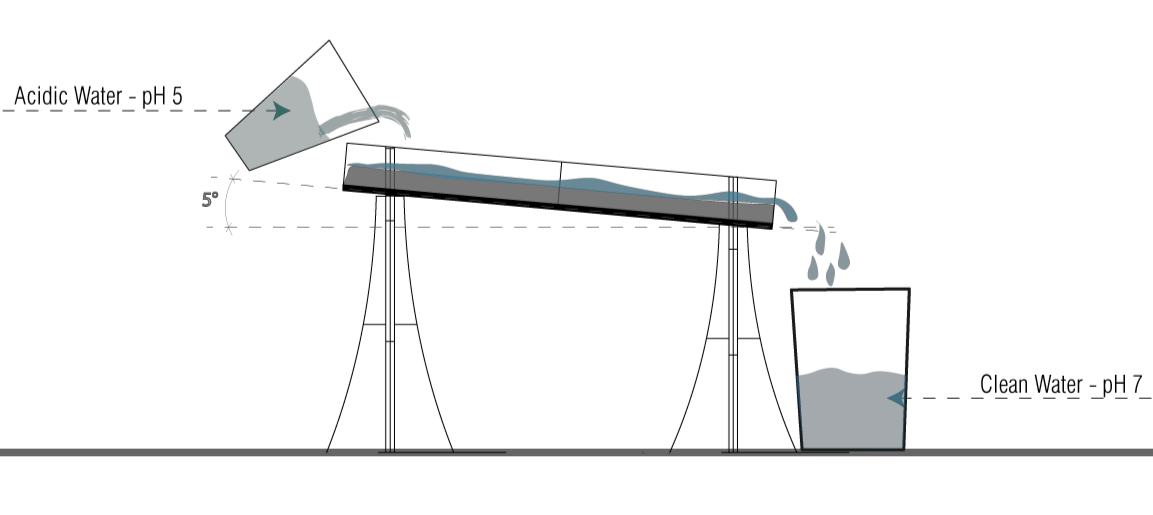
CONCLUSION
Length Travelled – 24cm
No. of Passings – 3
Angle – 5°
Water Travel time – 3 – 4.5s
pH Change – from 5 to 6.5
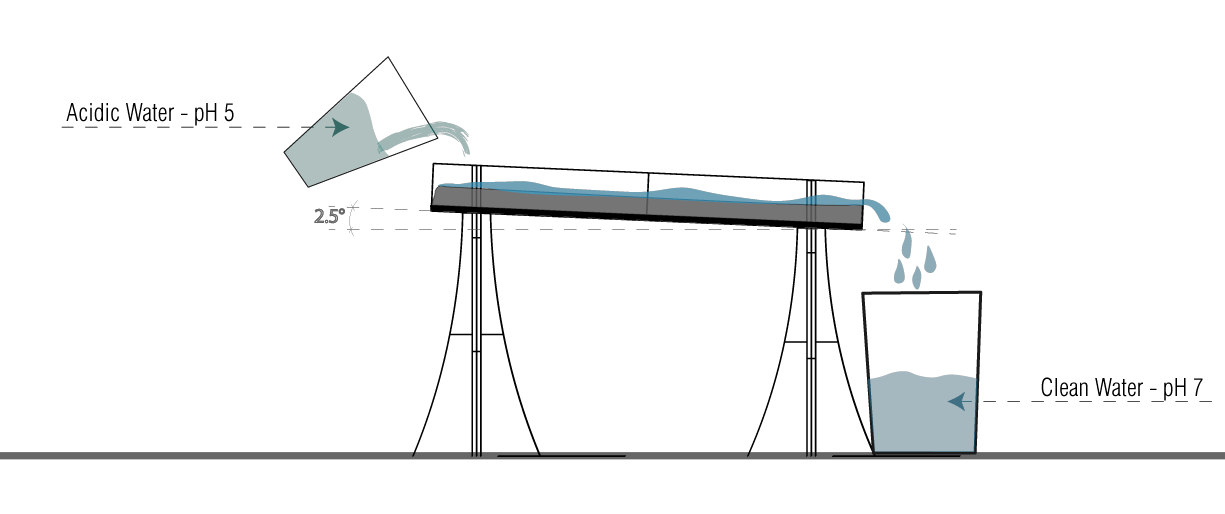
CONCLUSION
Length Travelled – 24cm
No. of Passings – 3
Angle – 2.5°
Water Travel time – 4 – 6.5s
pH Change – from 5 to 7
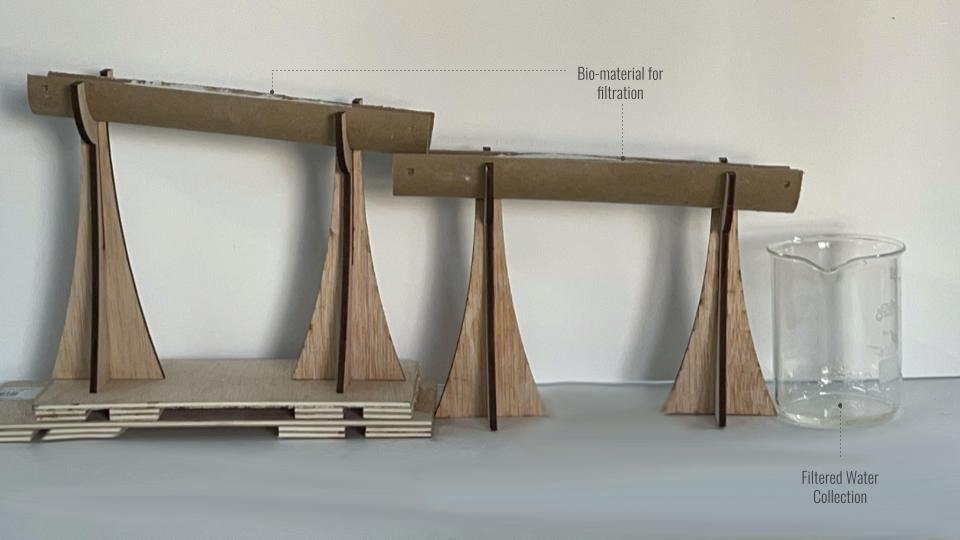
TEST 1
Taking 2 molds for cascading and increasing travel time
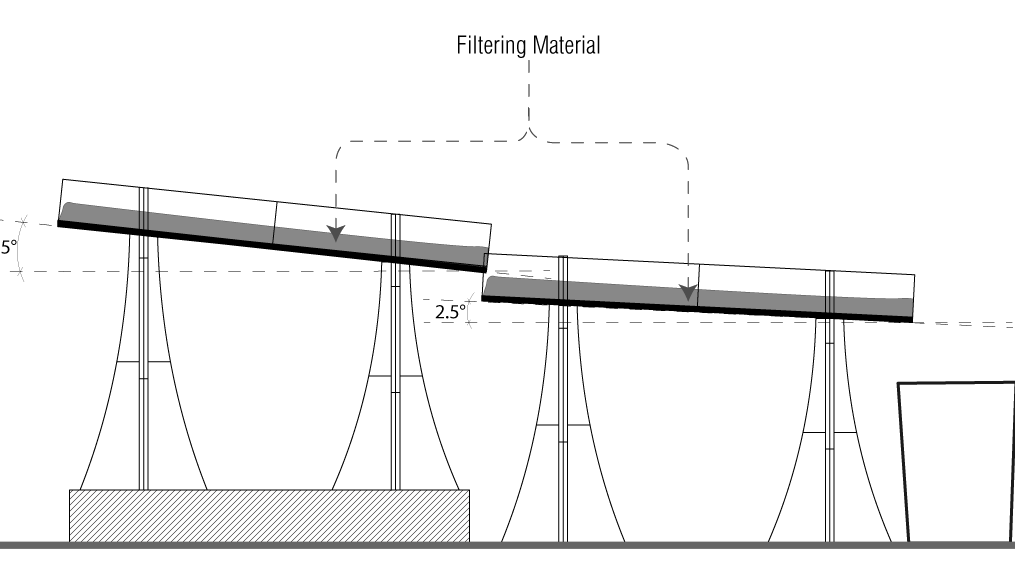
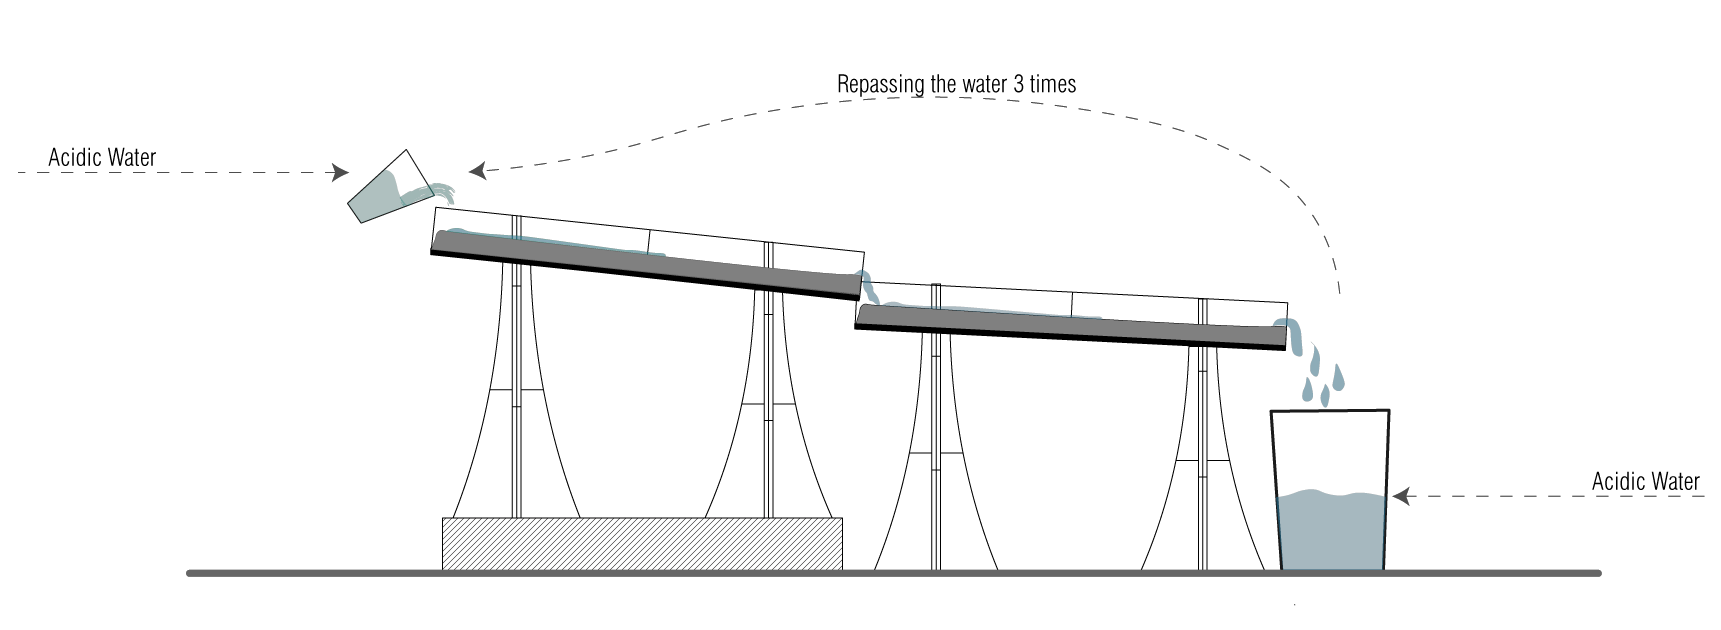
CONCLUSION
Length Travelled – 48cm
Angles used for cascading – 5° + 2.5°
Water Travel Time per pass – 9.5 – 11s
Total Length Travelled – 48 x 3 = 144cm
Total Water Travel time = 30 – 33.5s
pH change :
1st Pass – 5 to 6
2nd Pass – 6 to 6.5
3rd Pass – 6.5 to 7
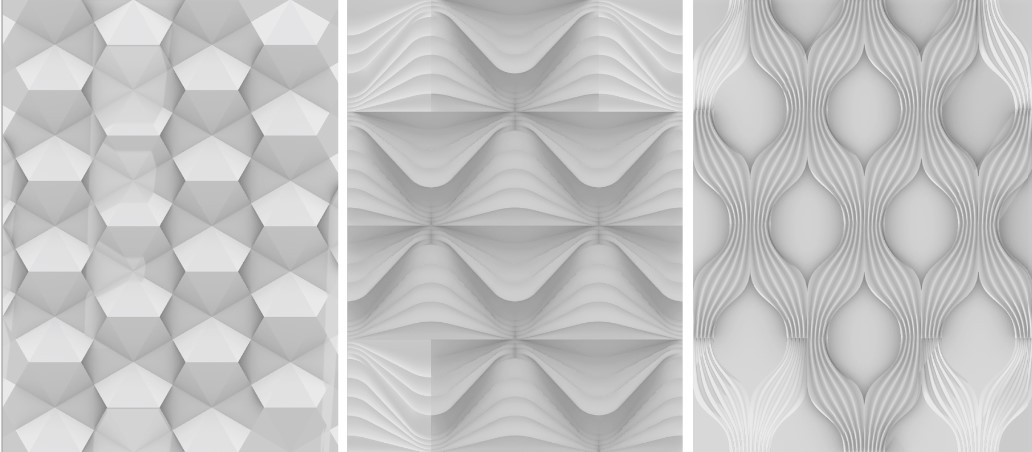
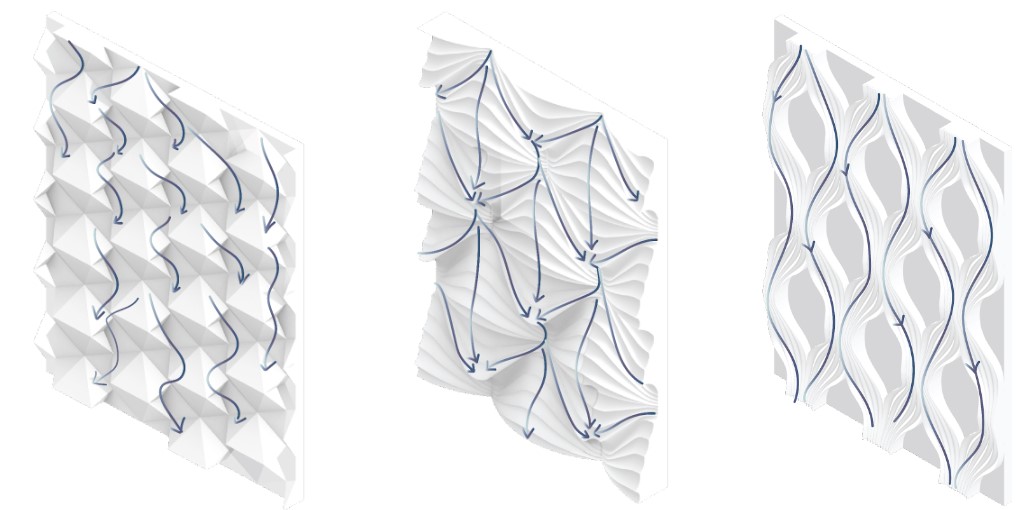
DESIGN EXPLORATION 1
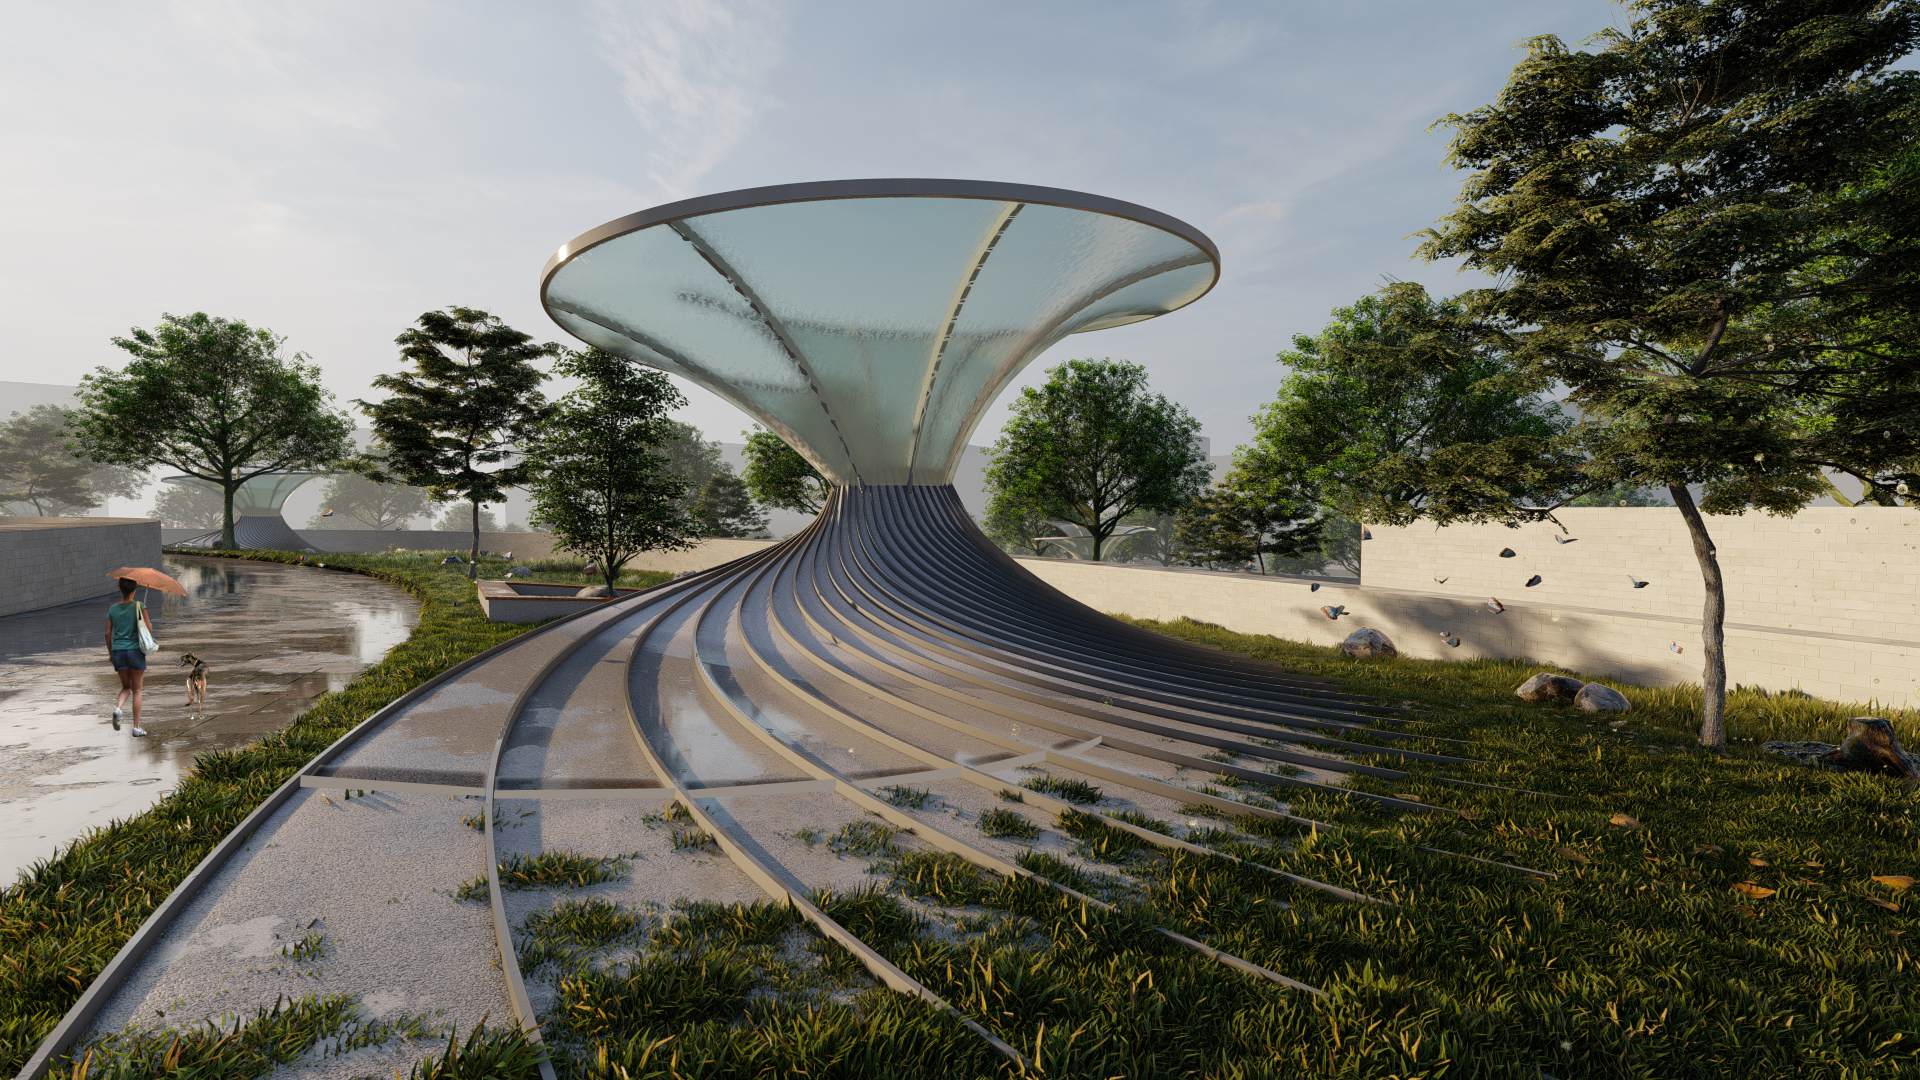
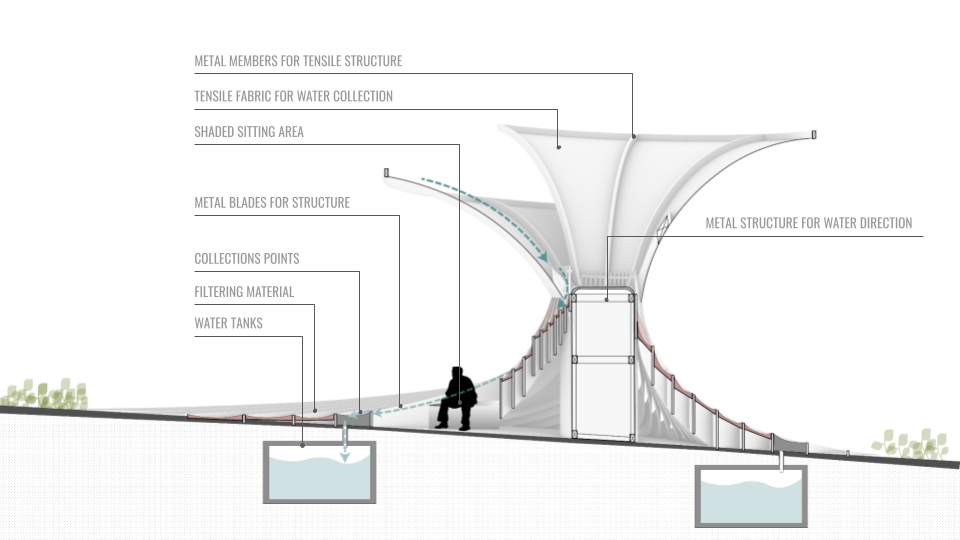
To create a facade system with panels cascading the flow of water and providing self shading.
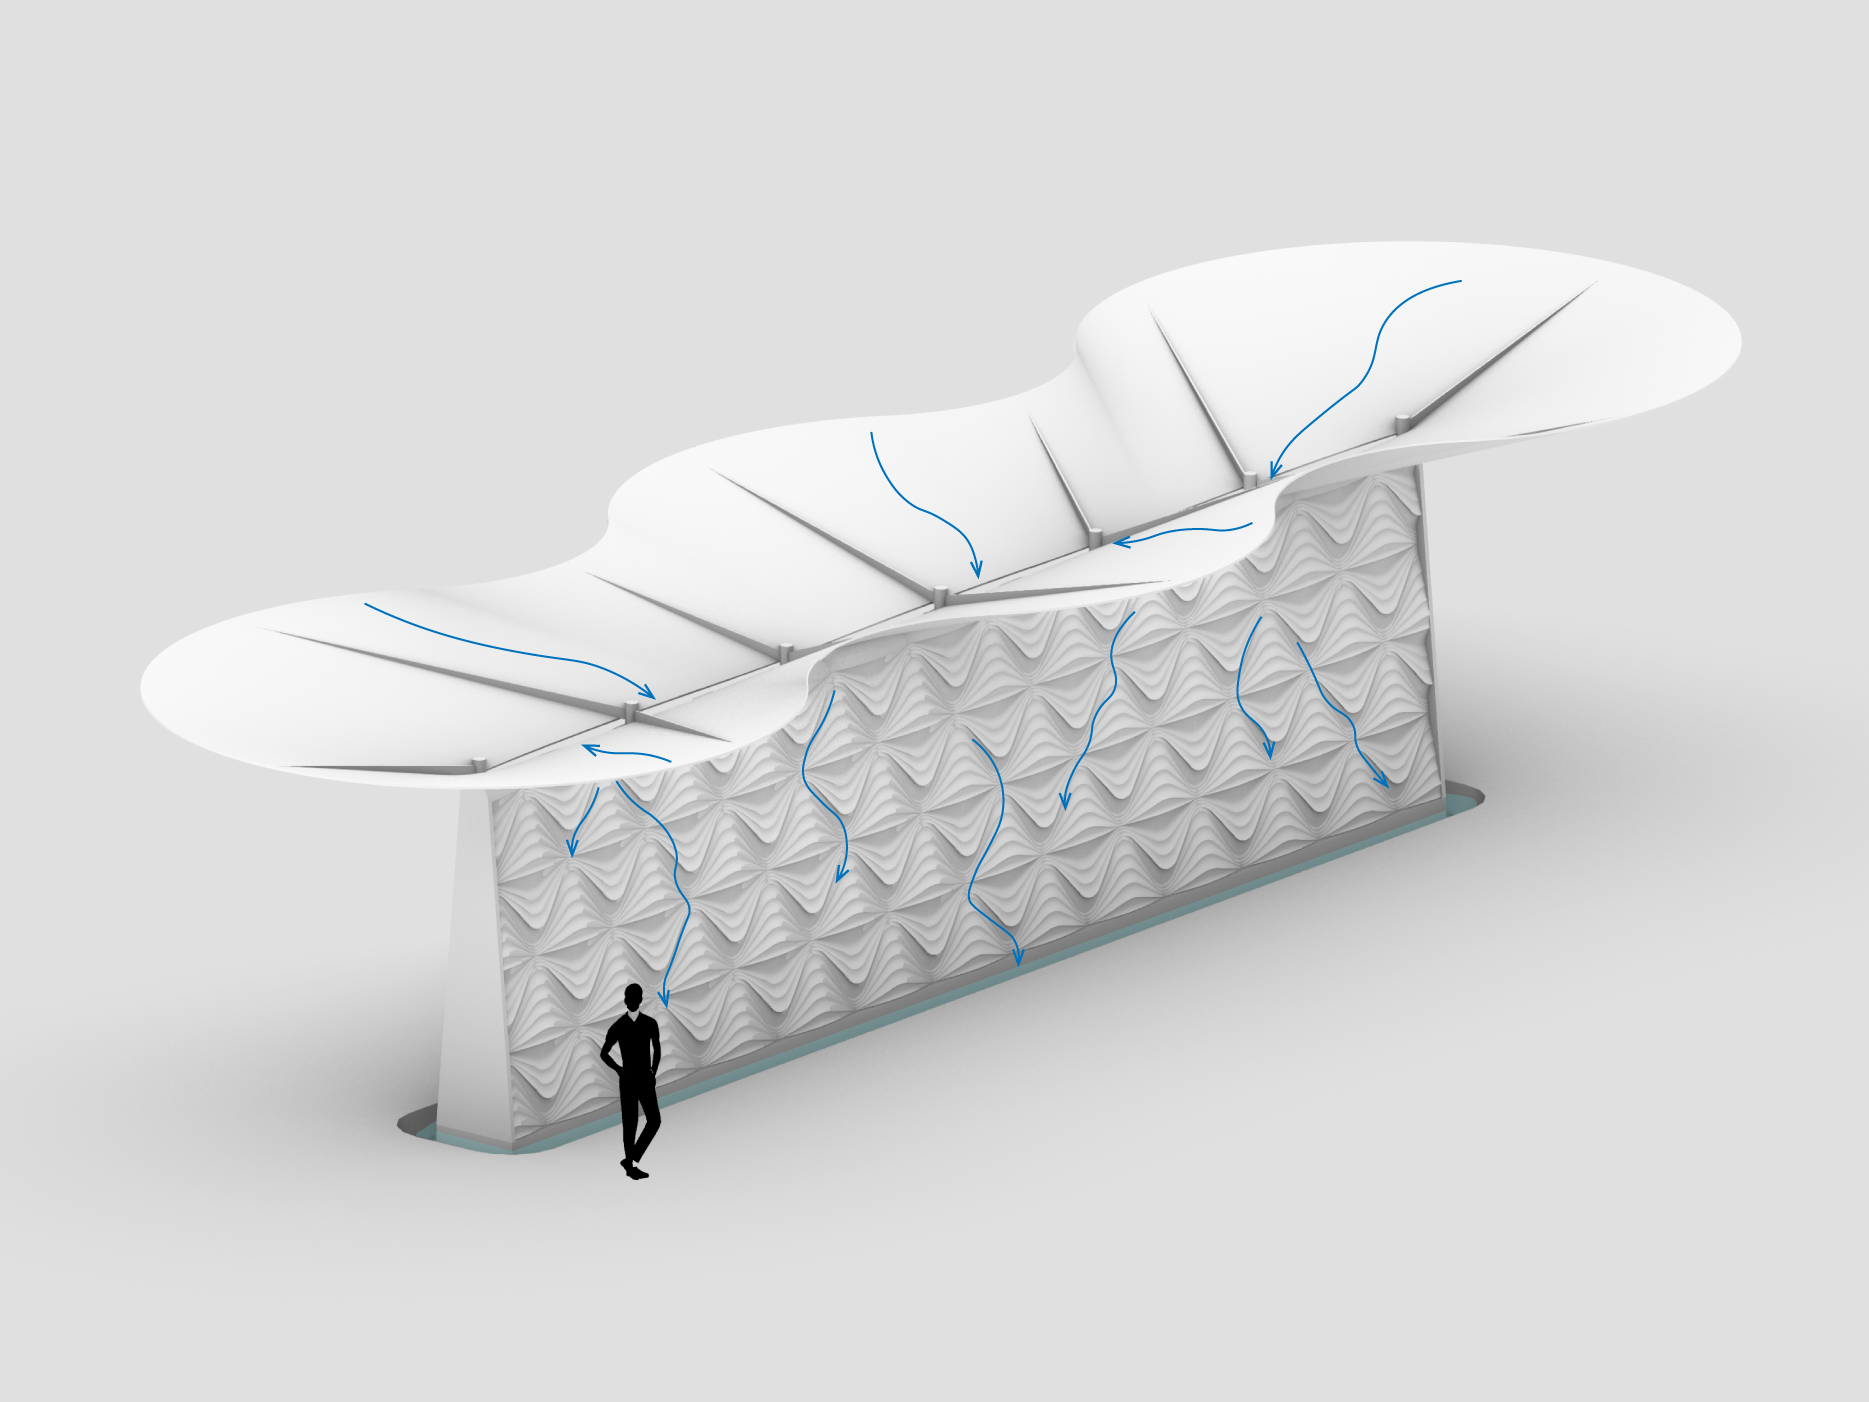
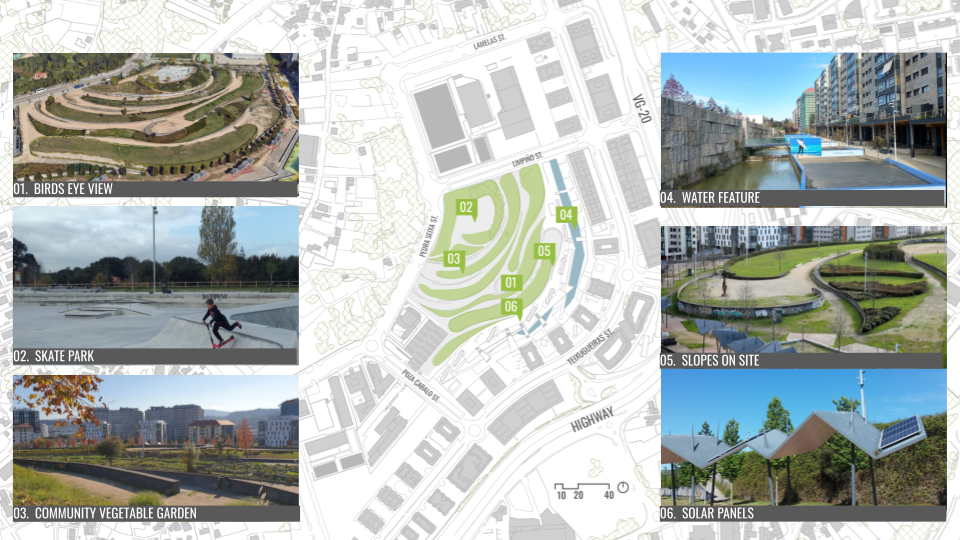
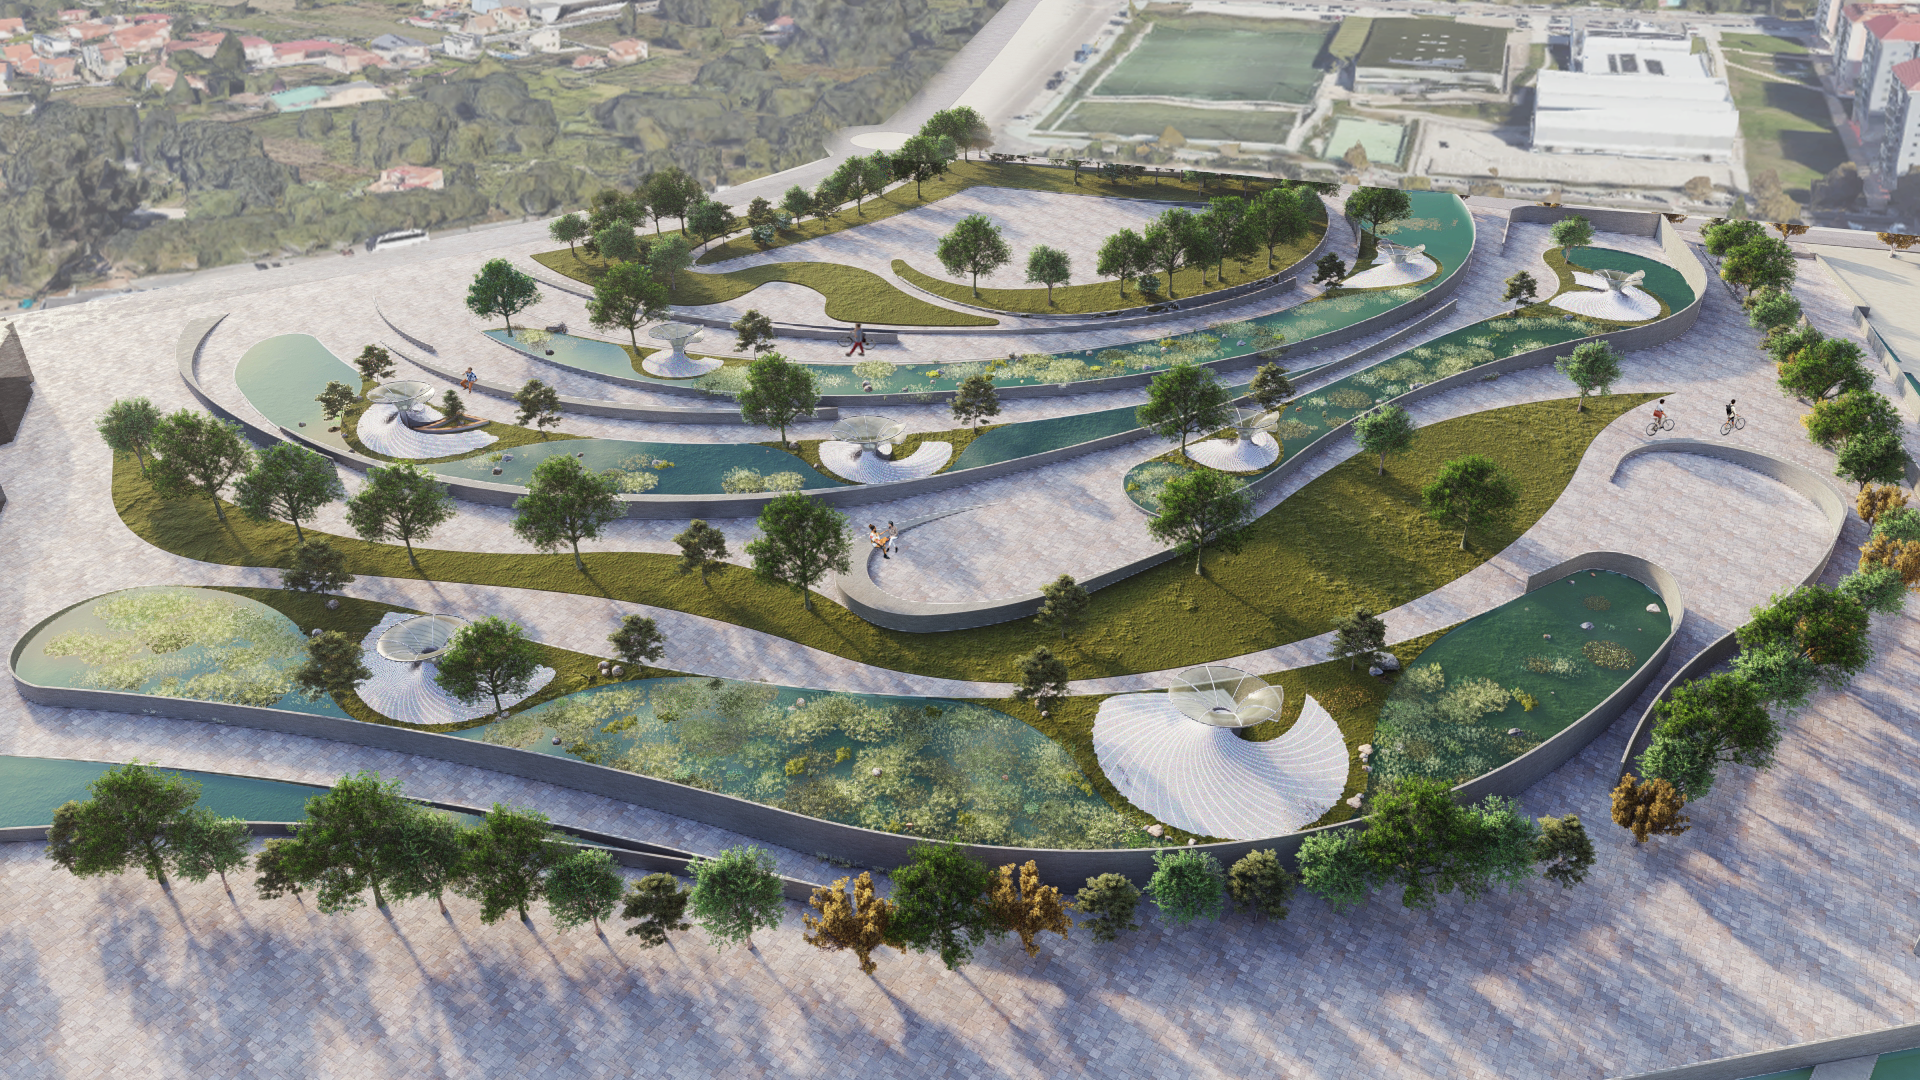
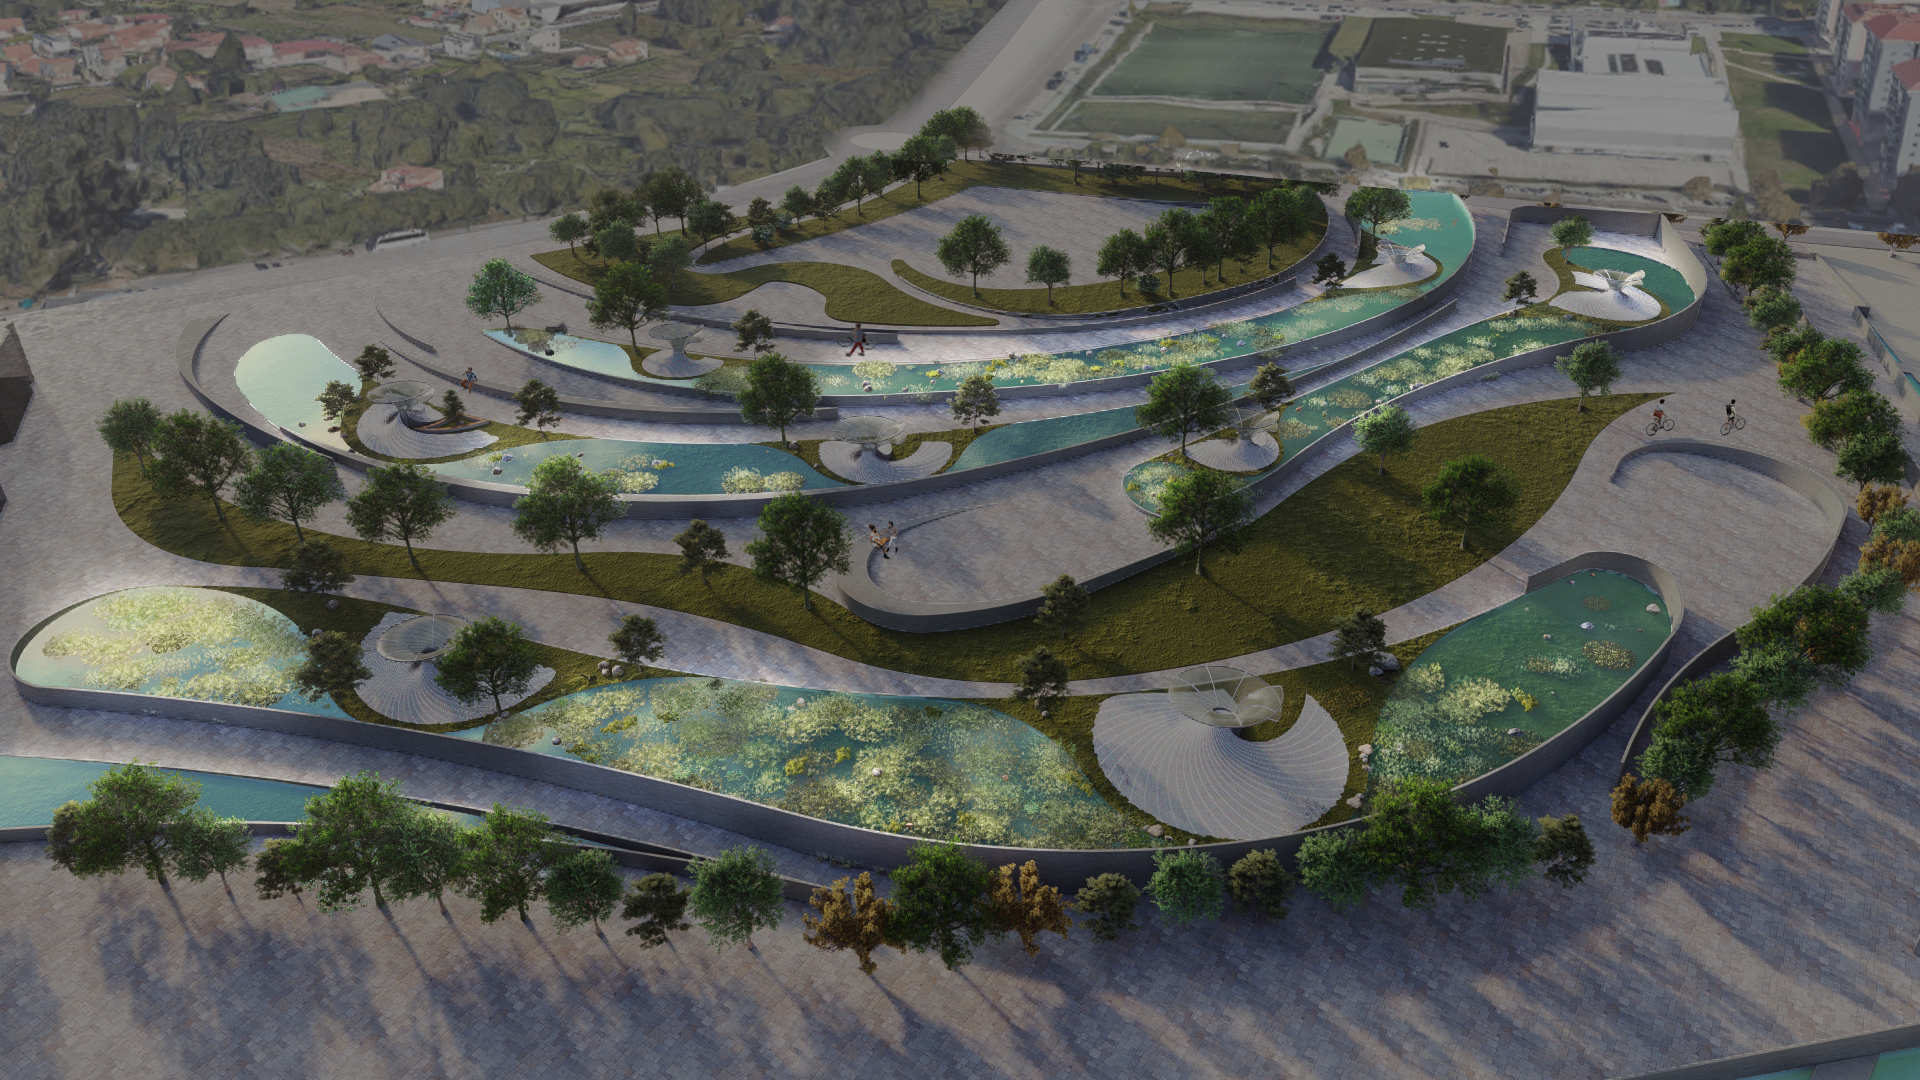
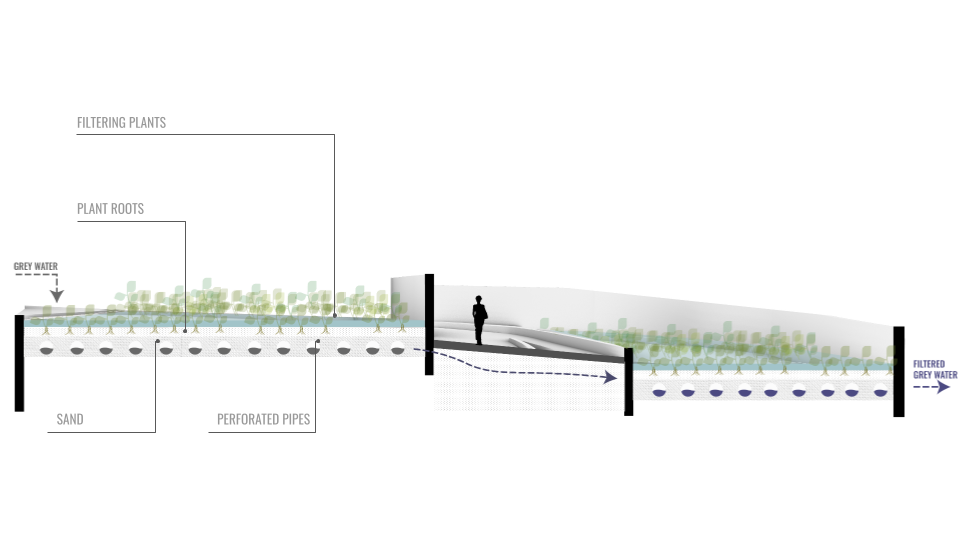
DESIGN EXPLORATION 2
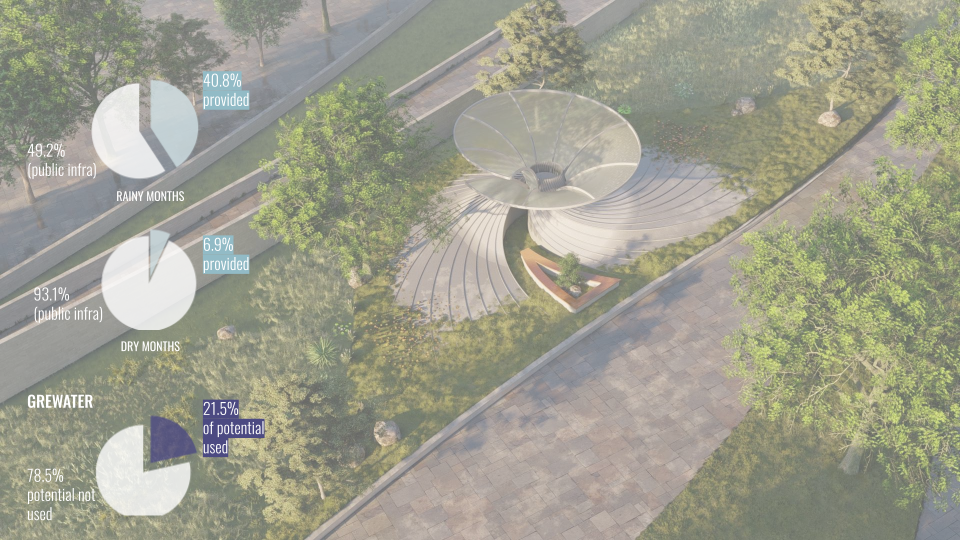
Further going into Landscape applications and applying the paneling system along with a catchment area.
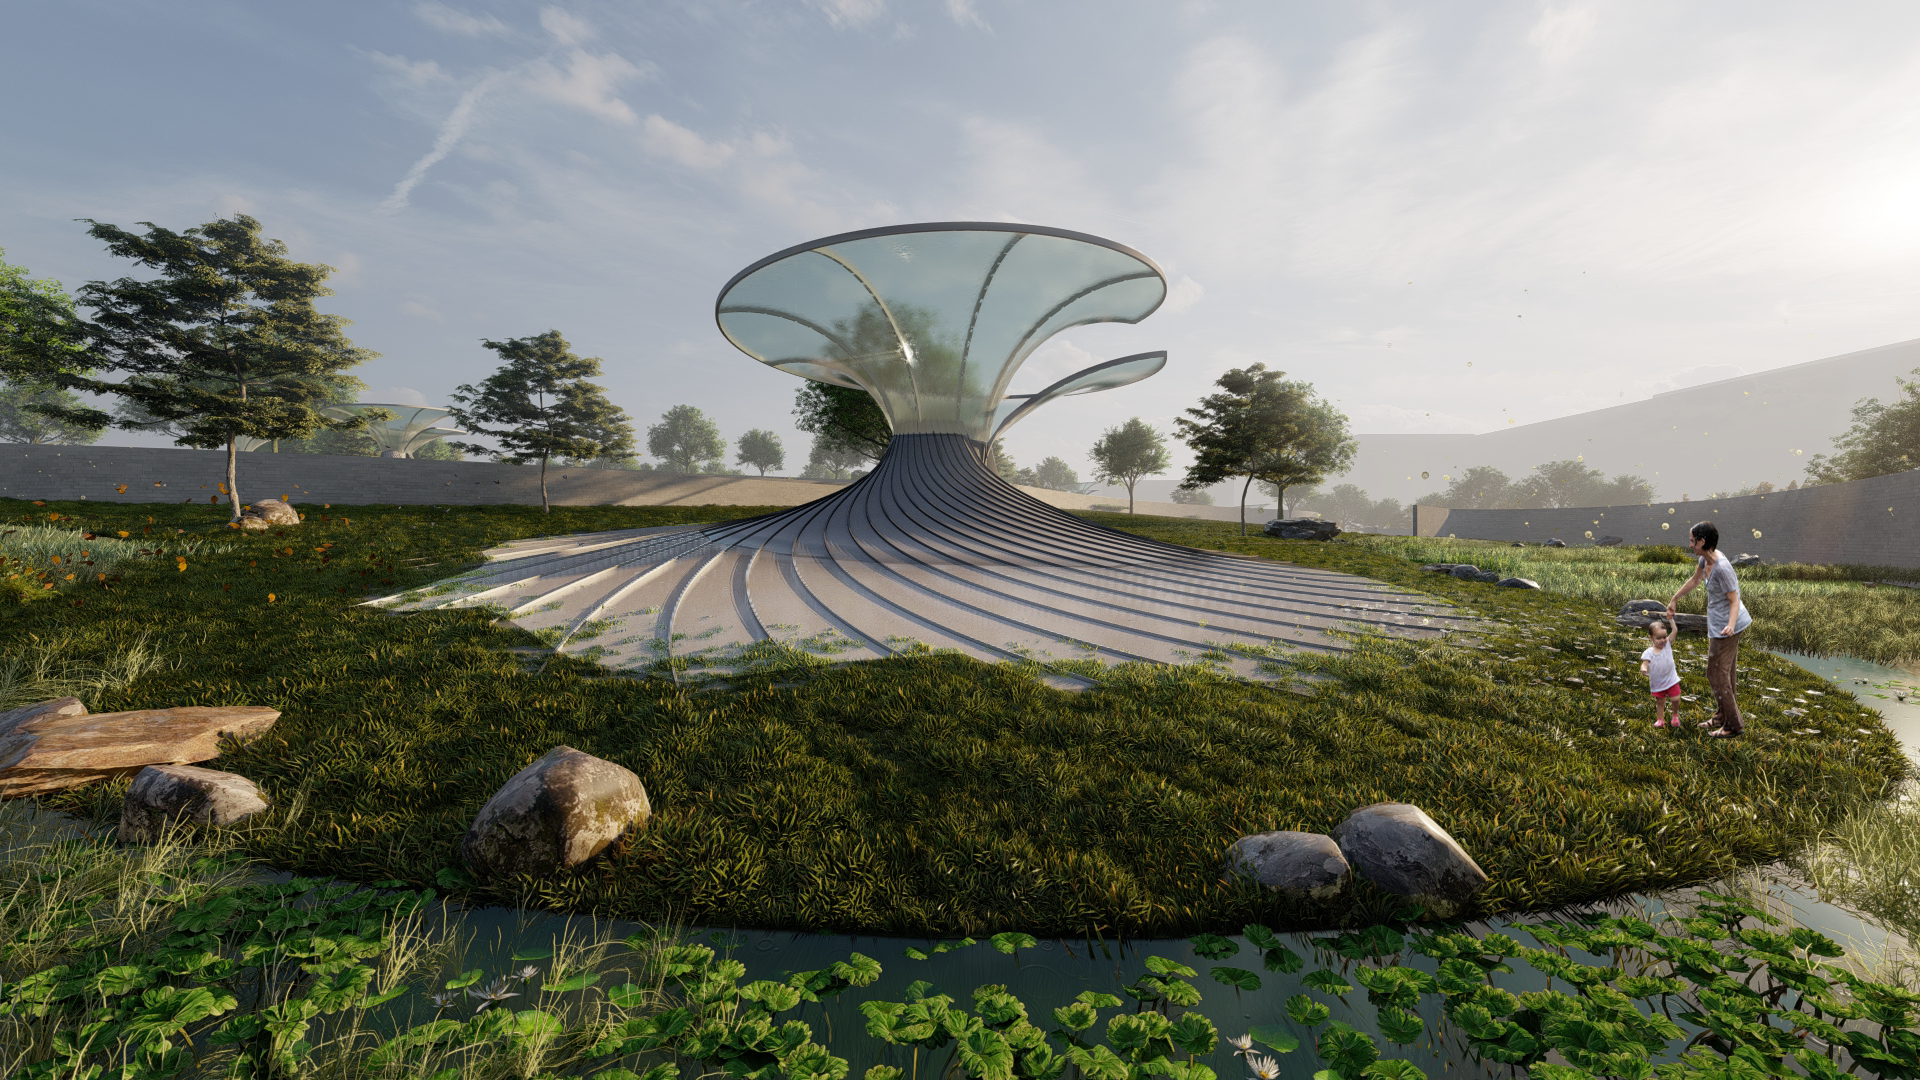
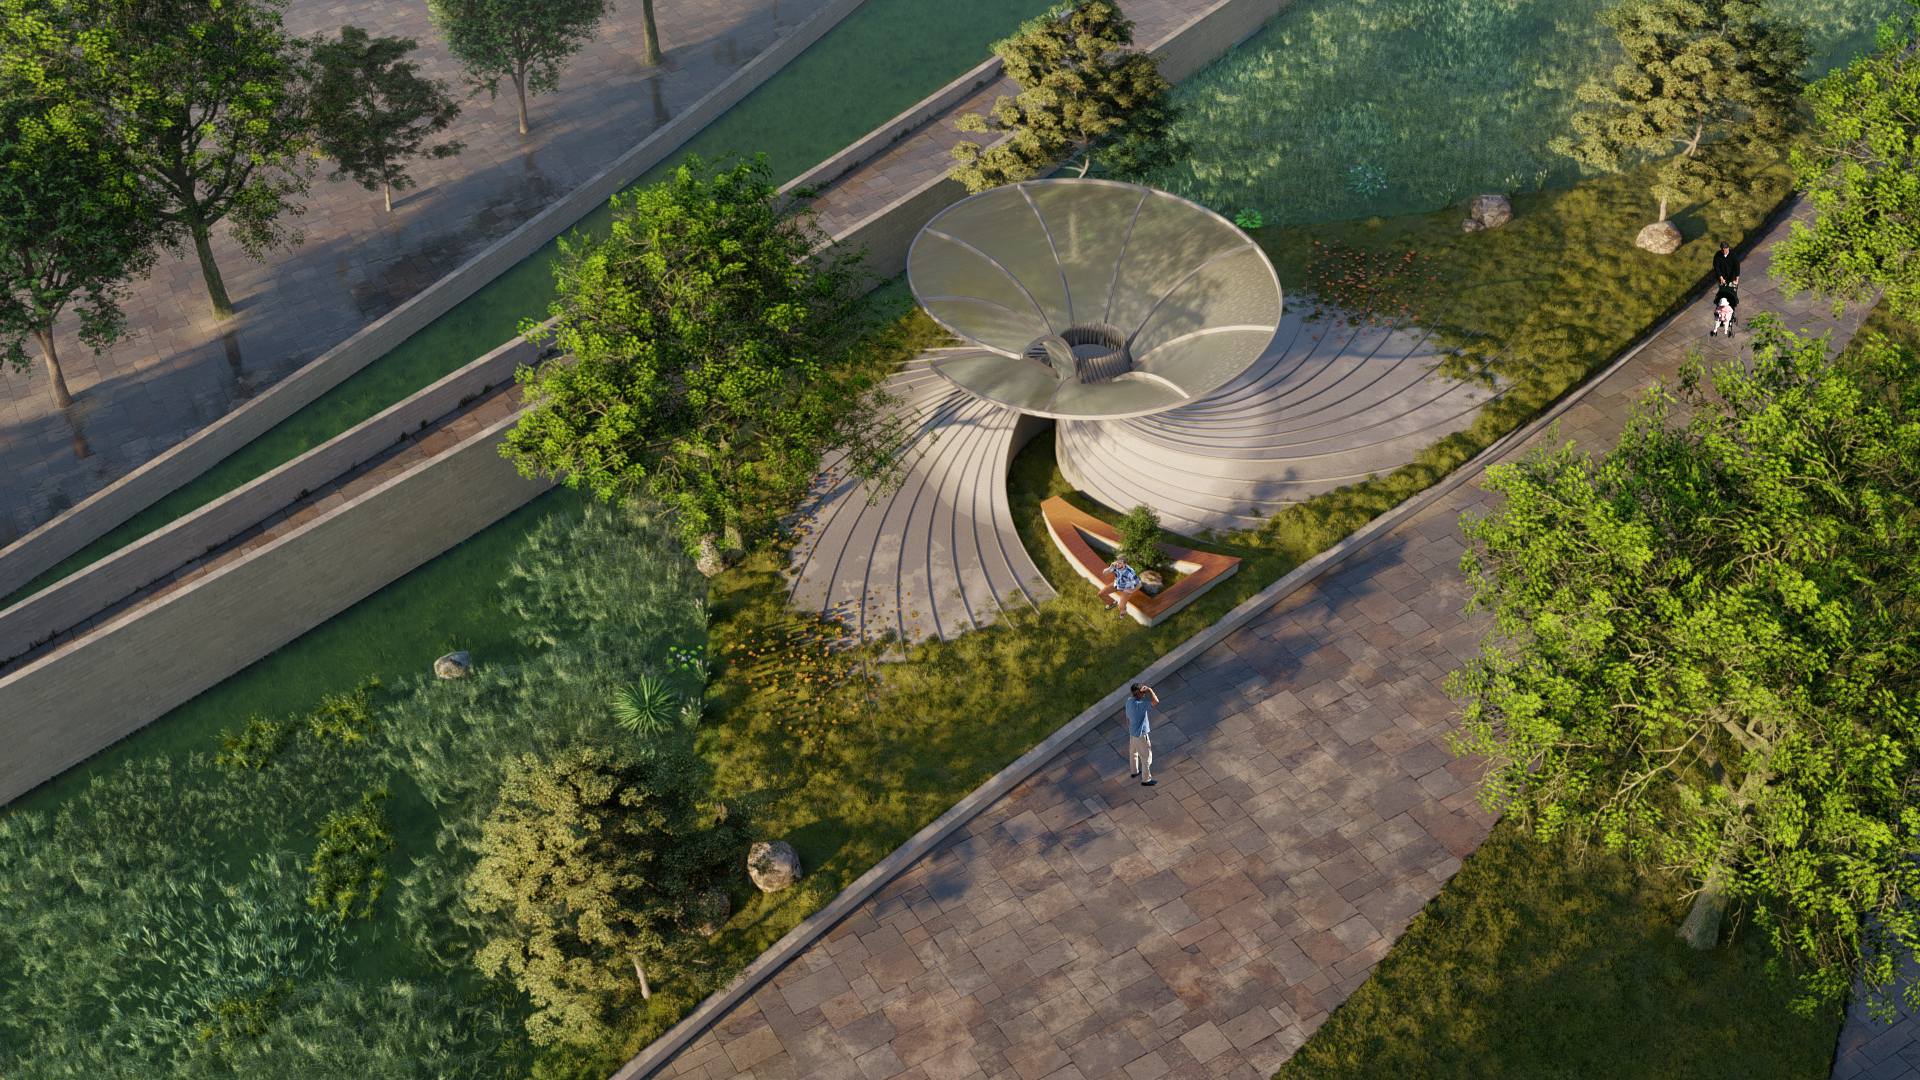
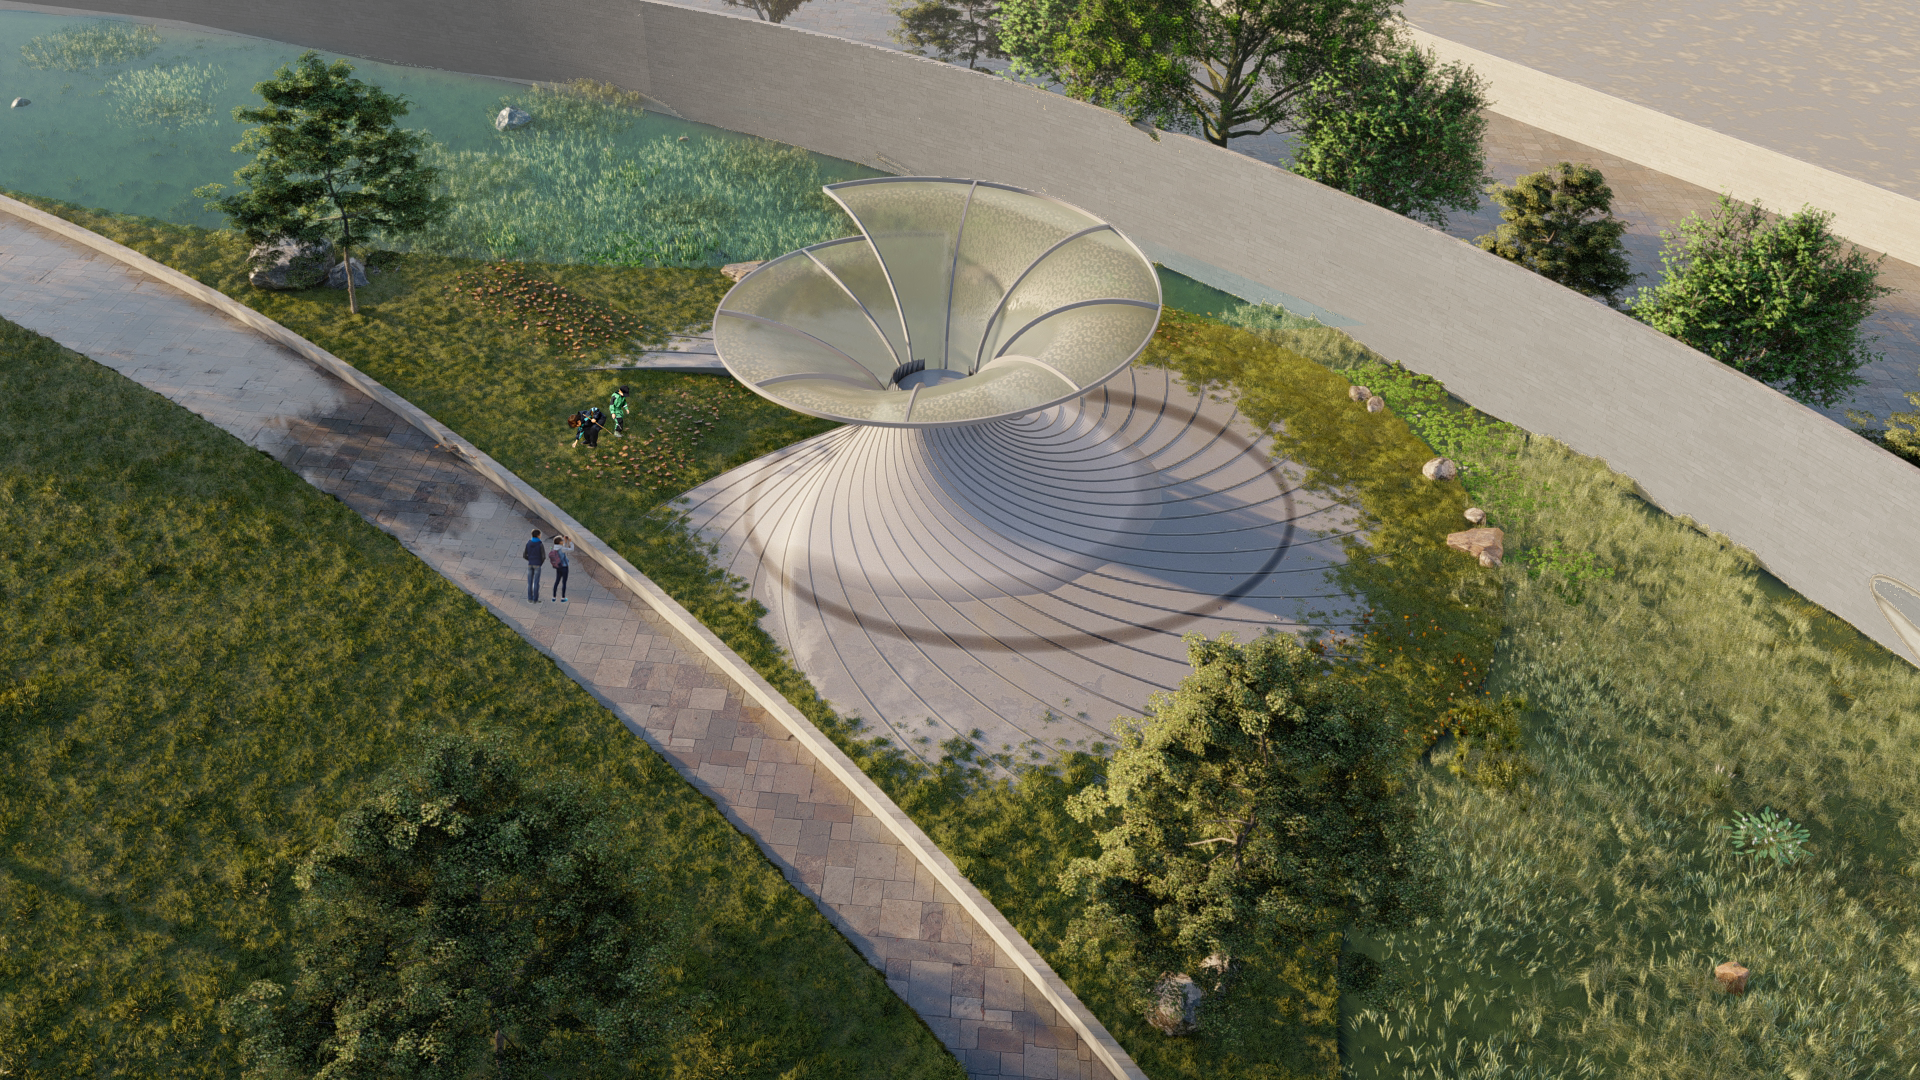
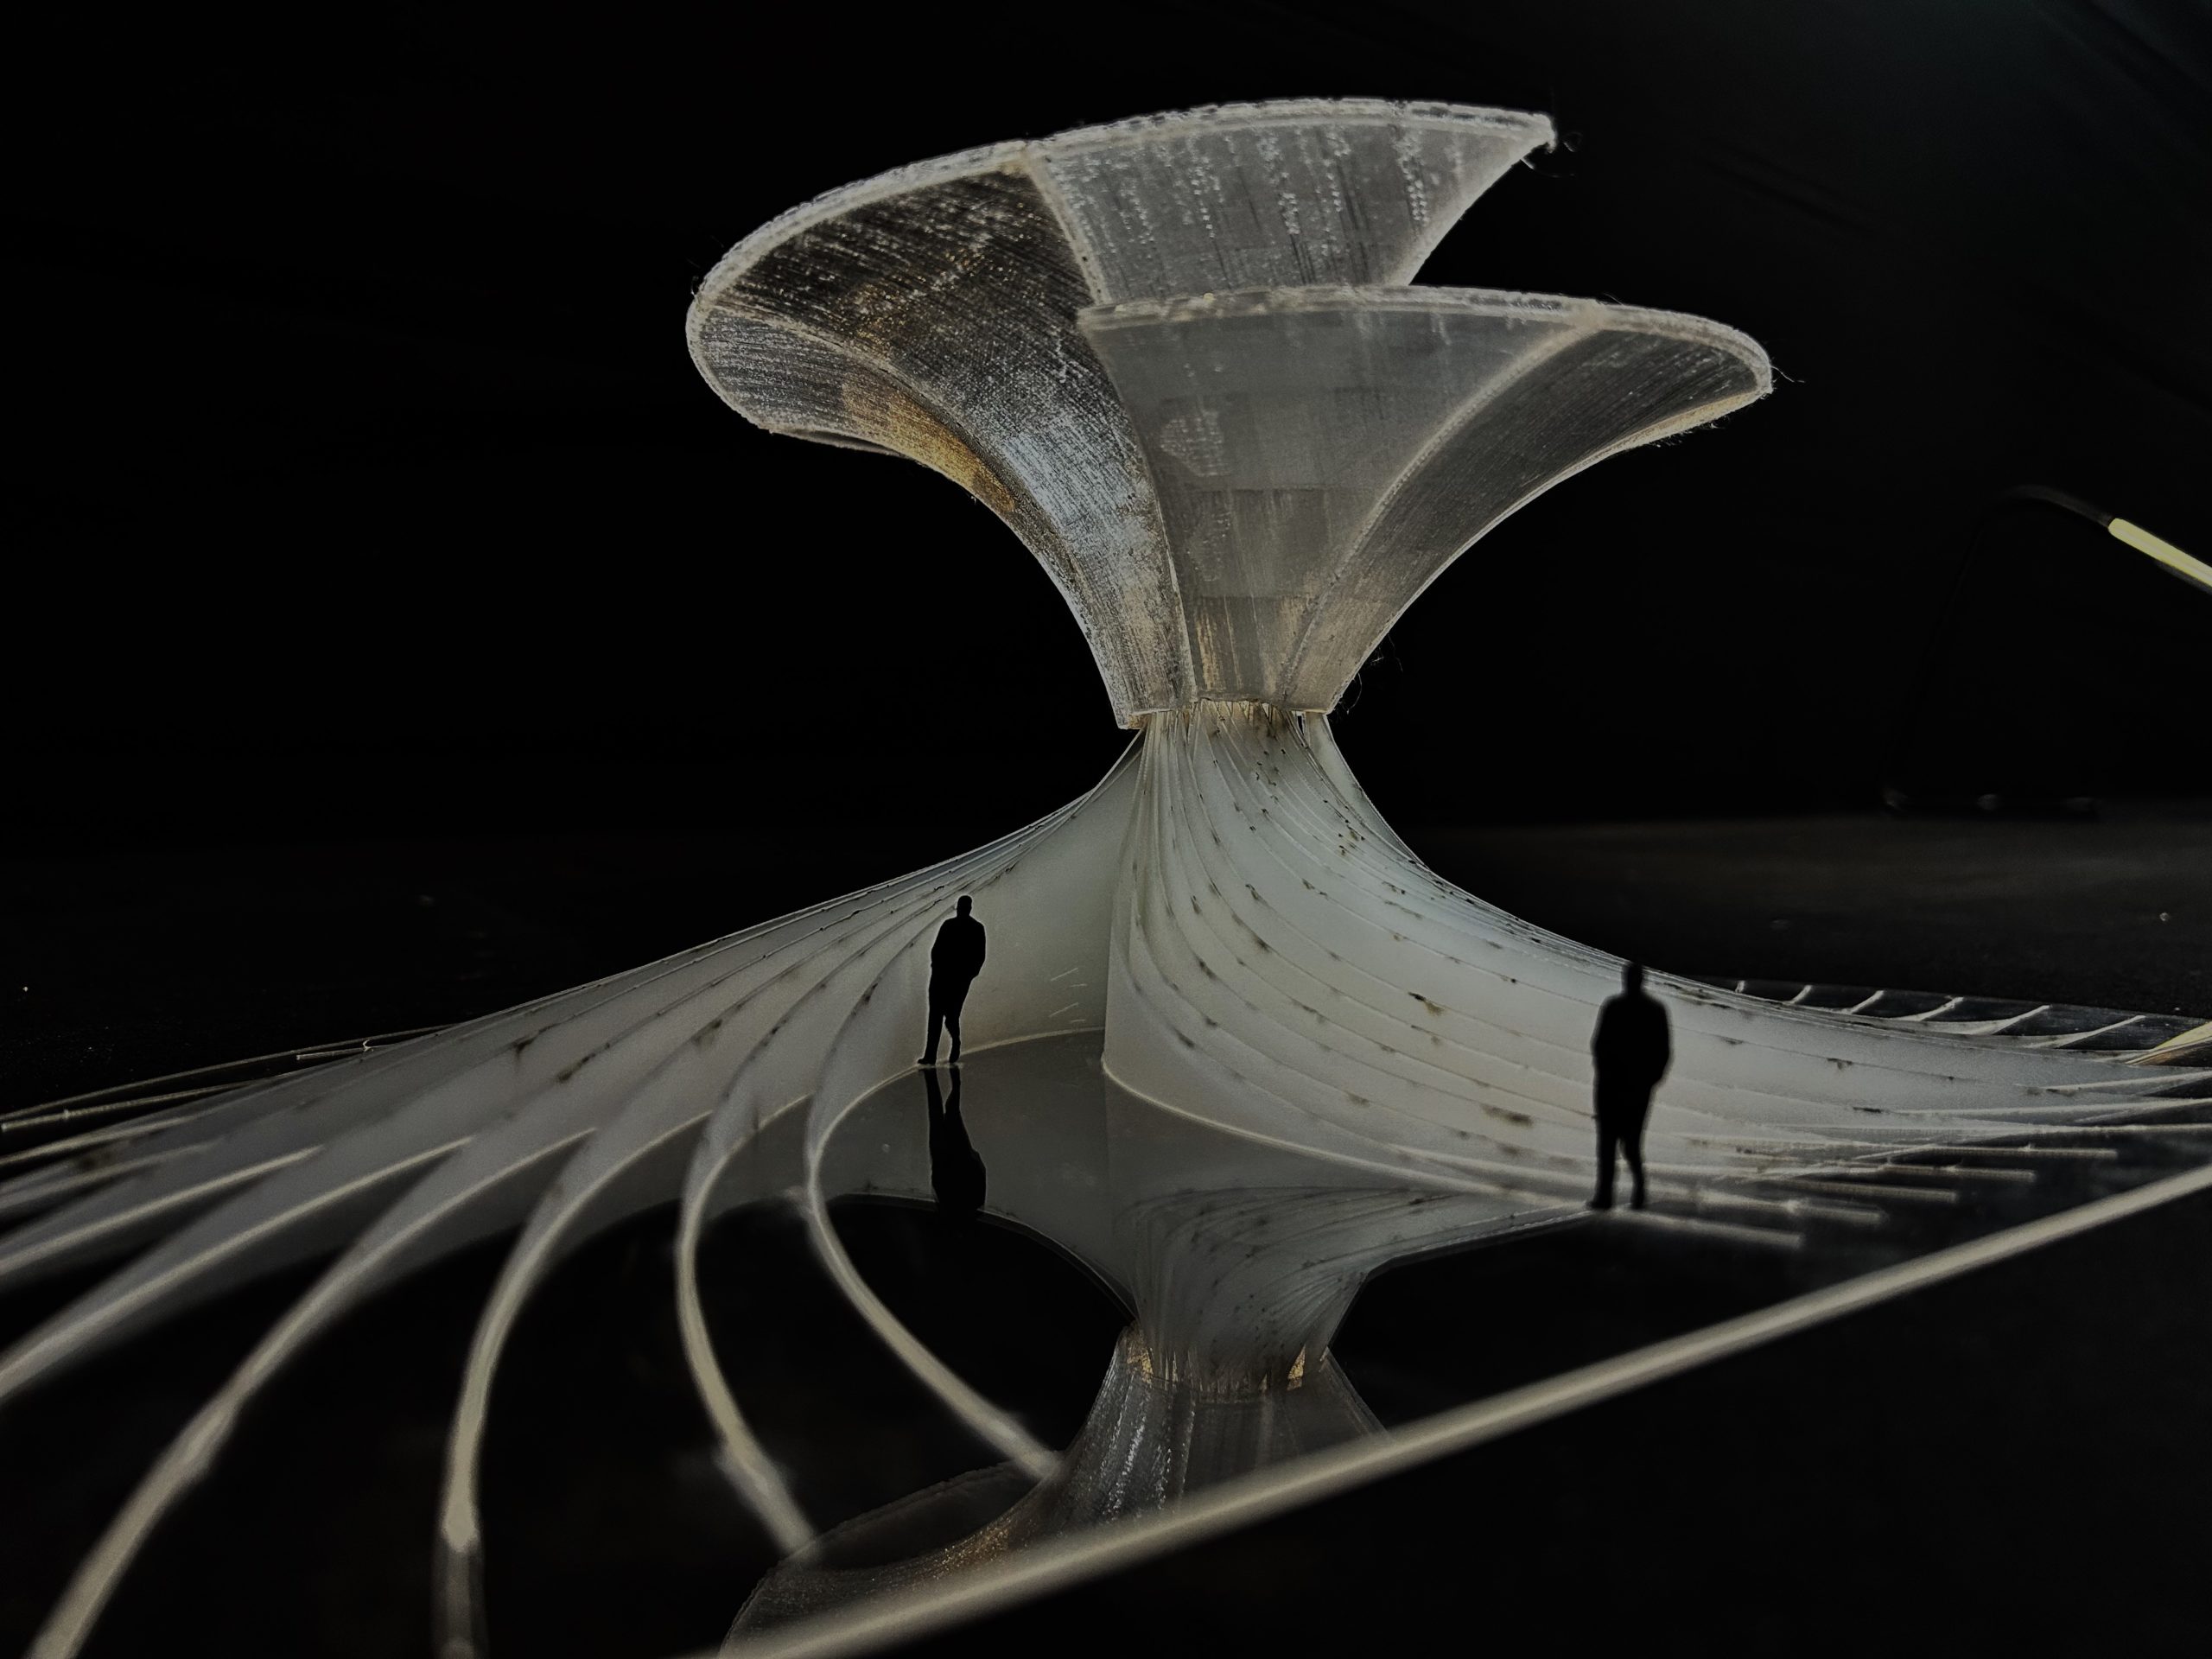
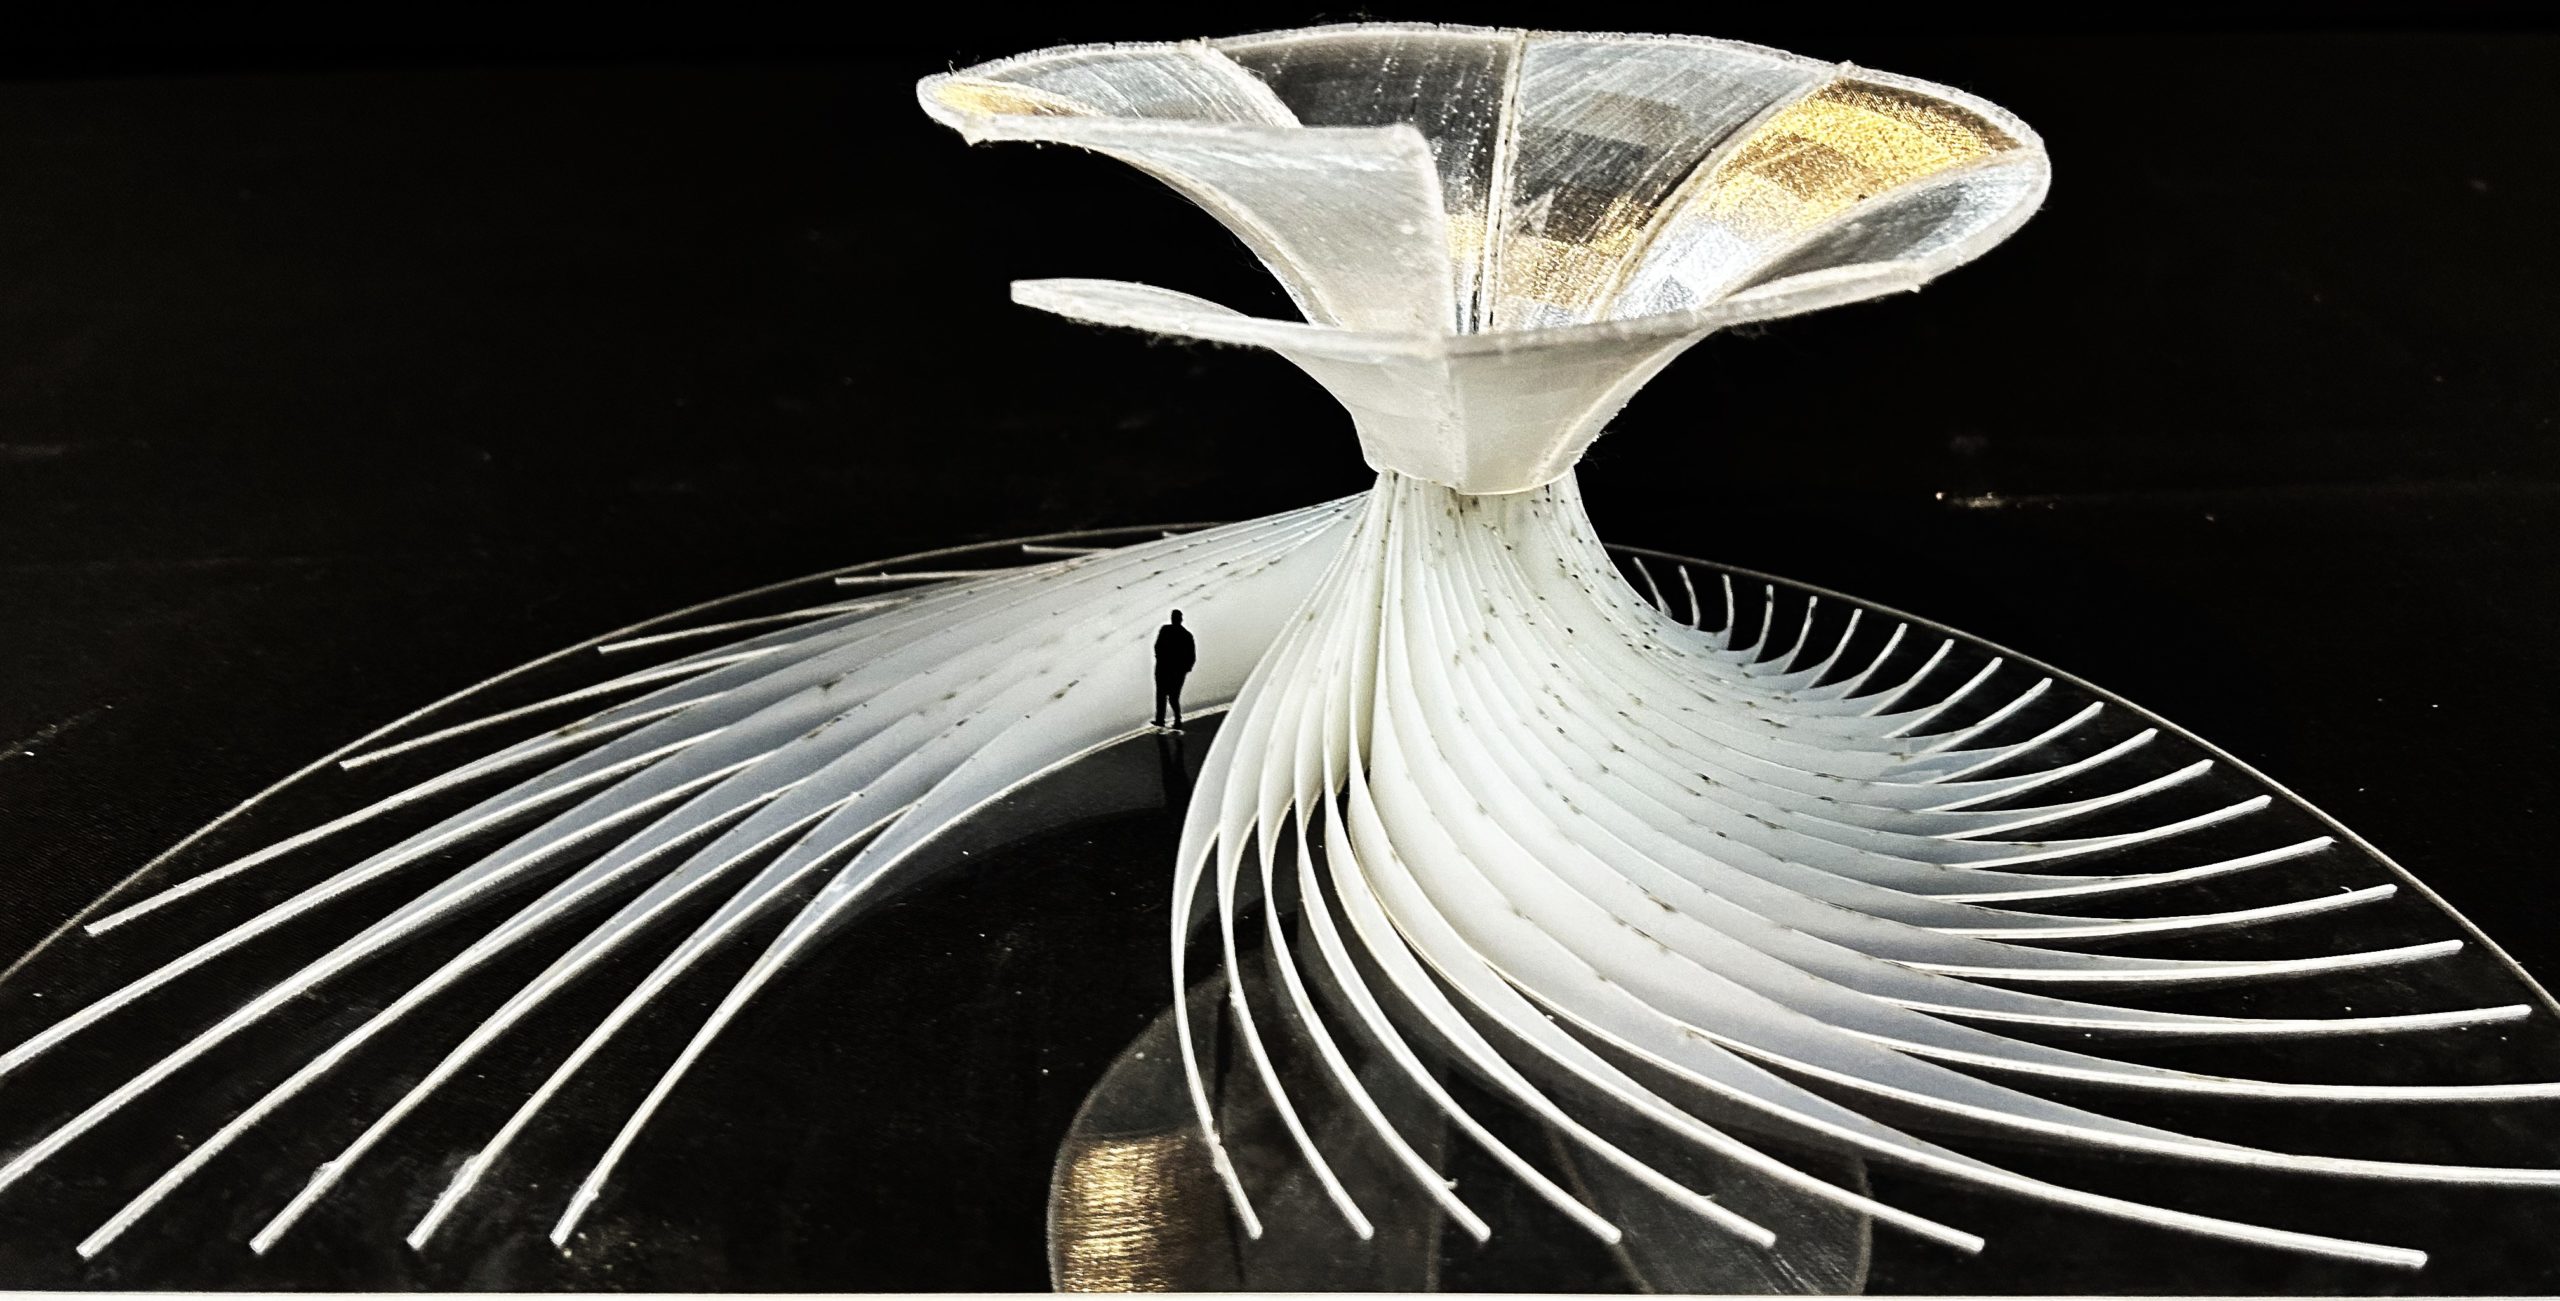
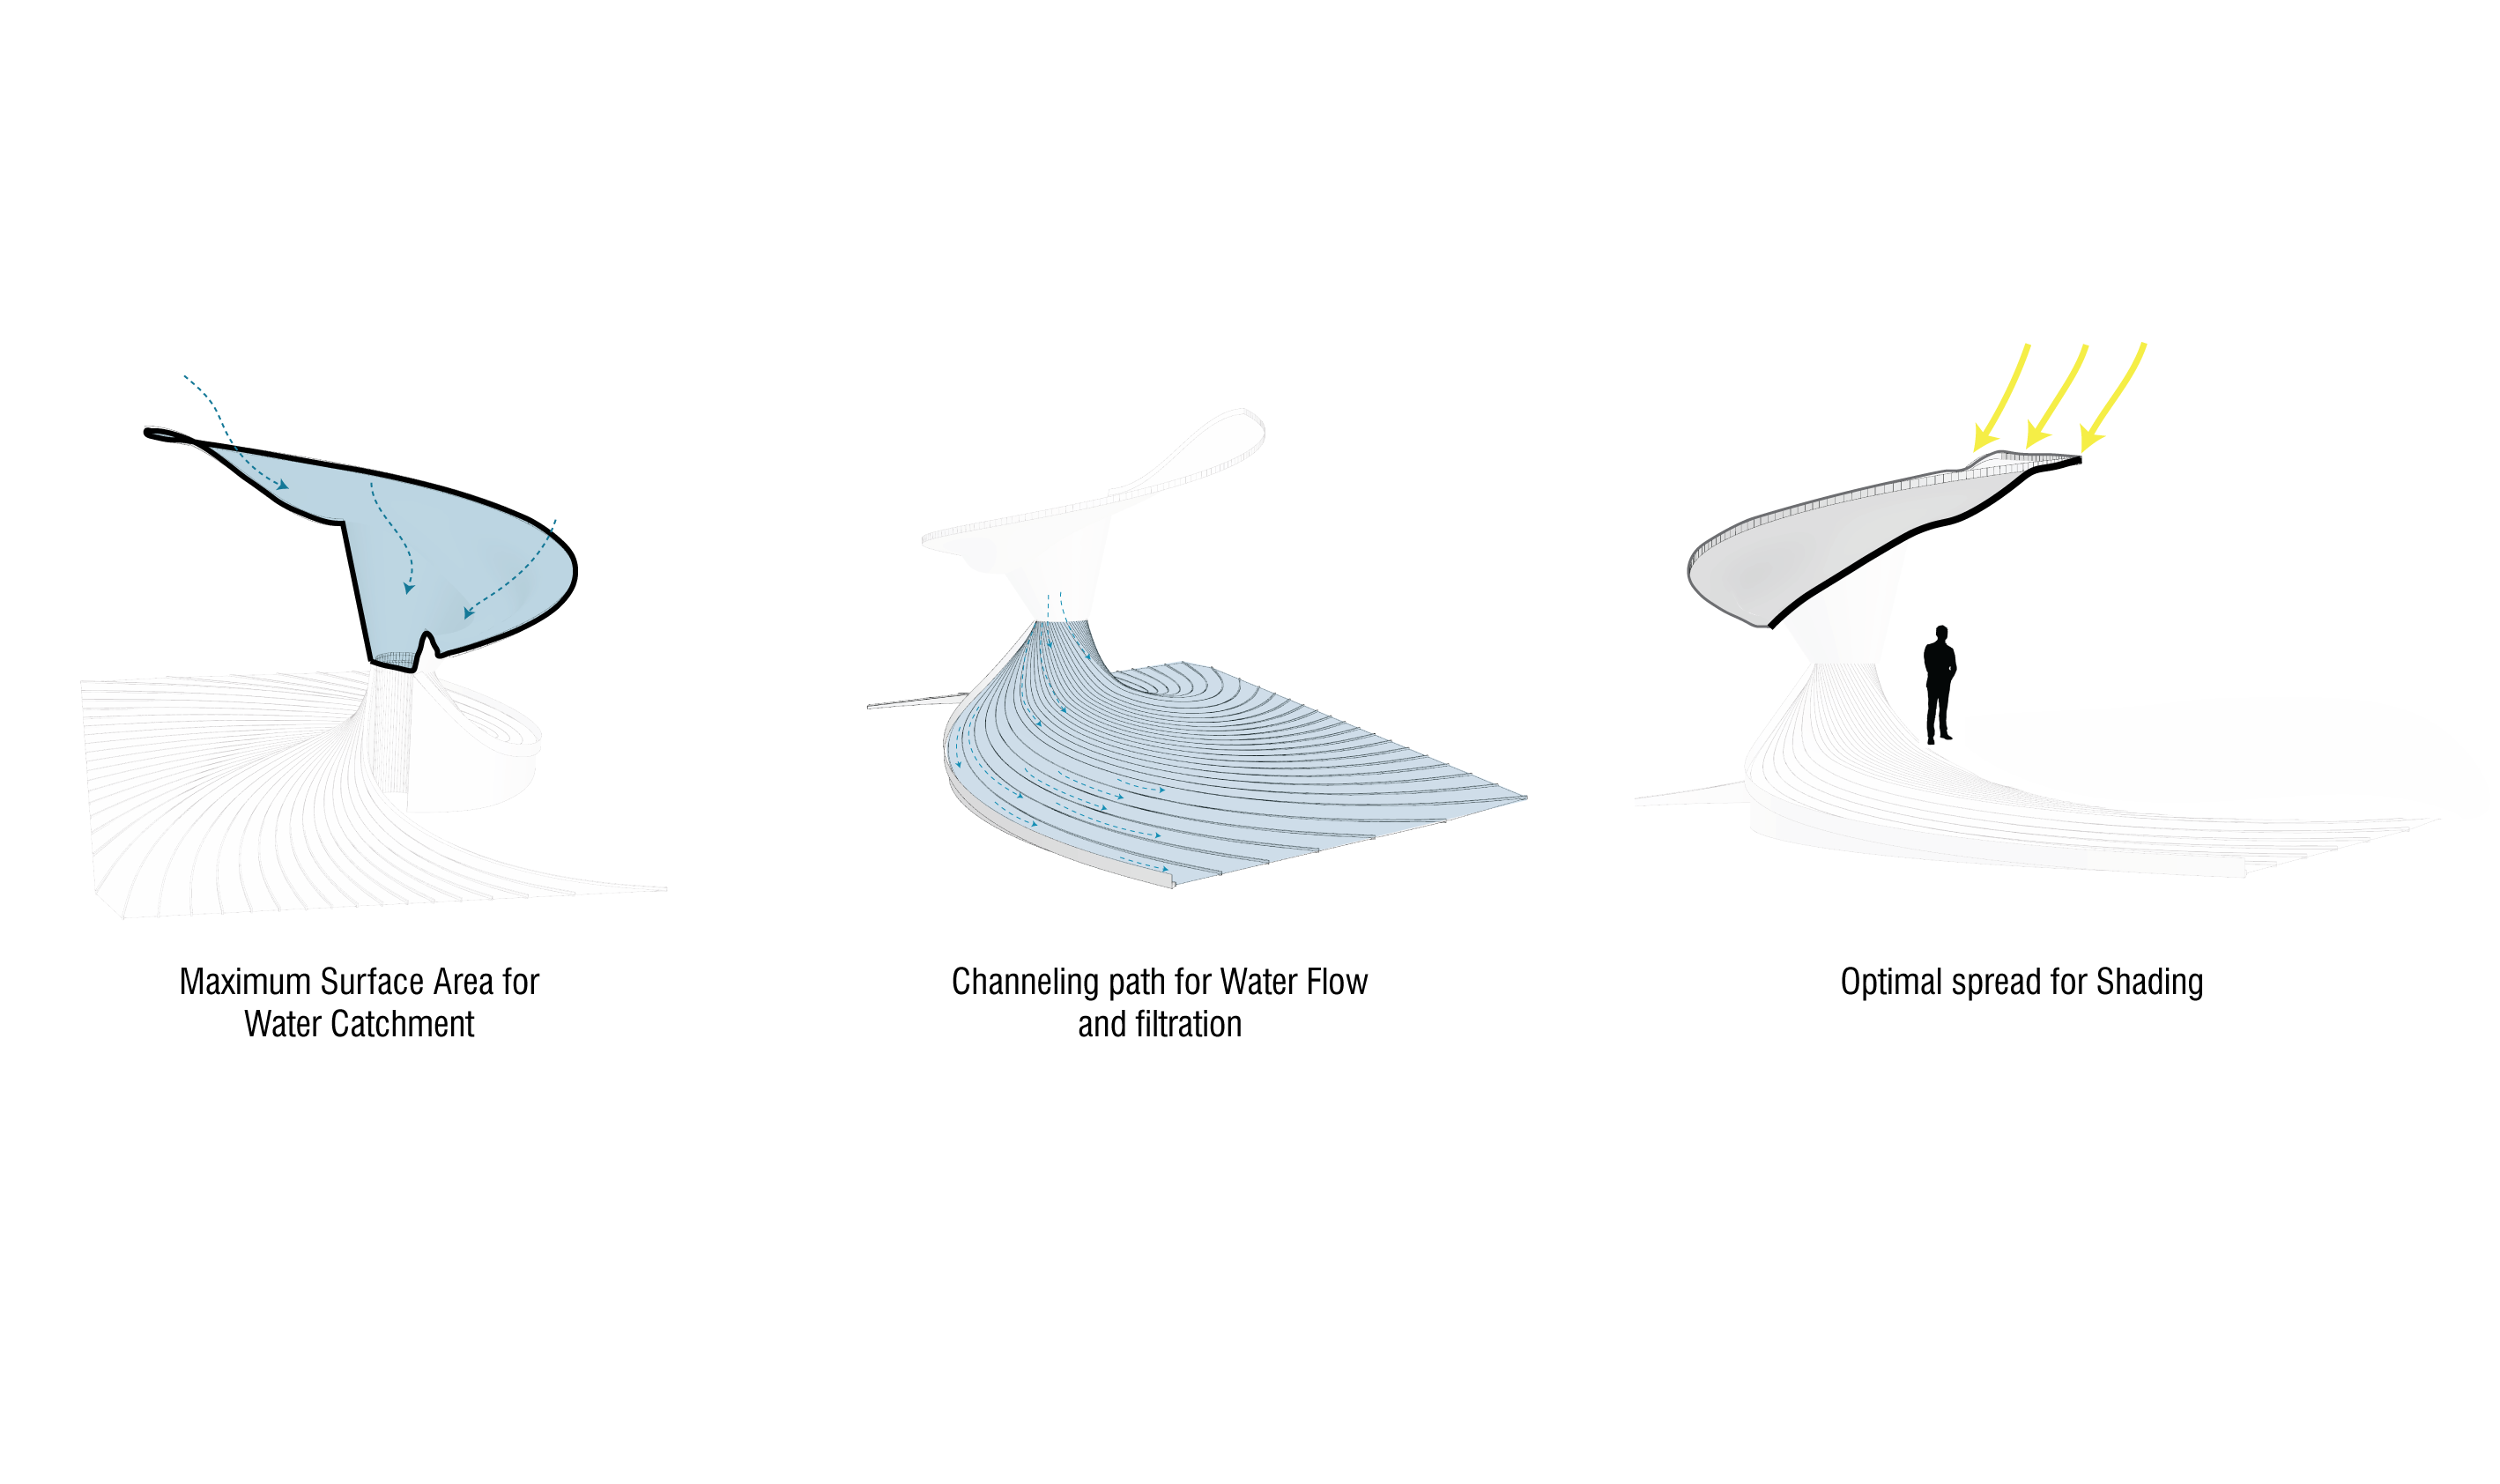
DESIGN PROPOSAL
DESIGN PARAMETERS
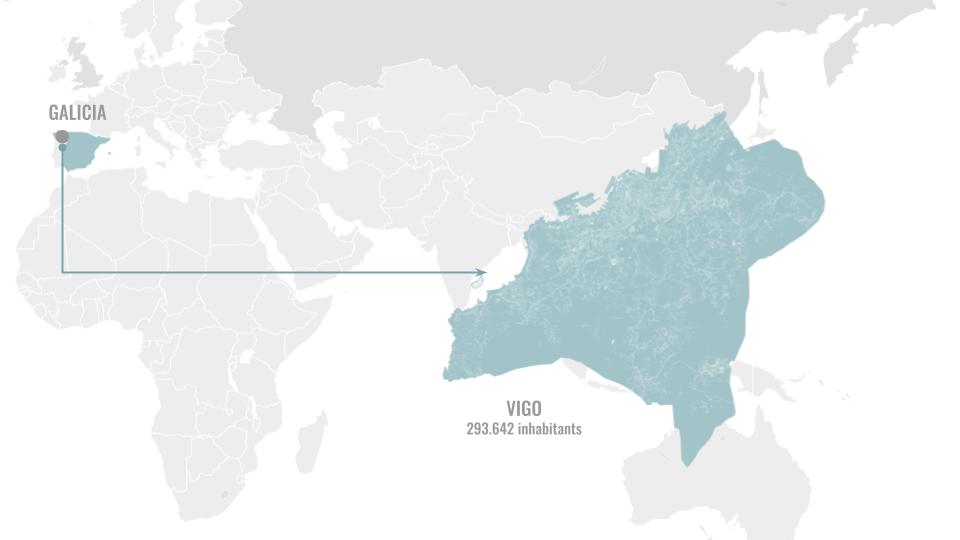
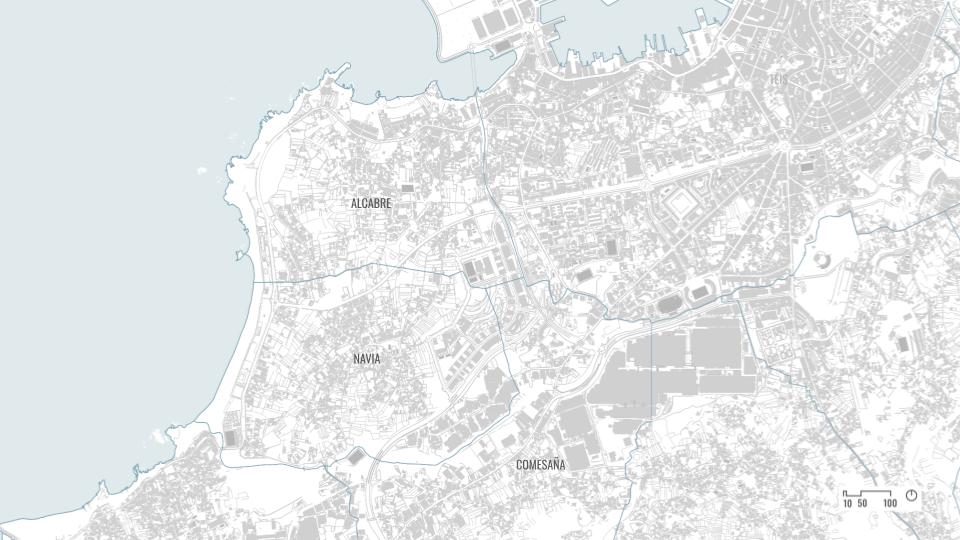
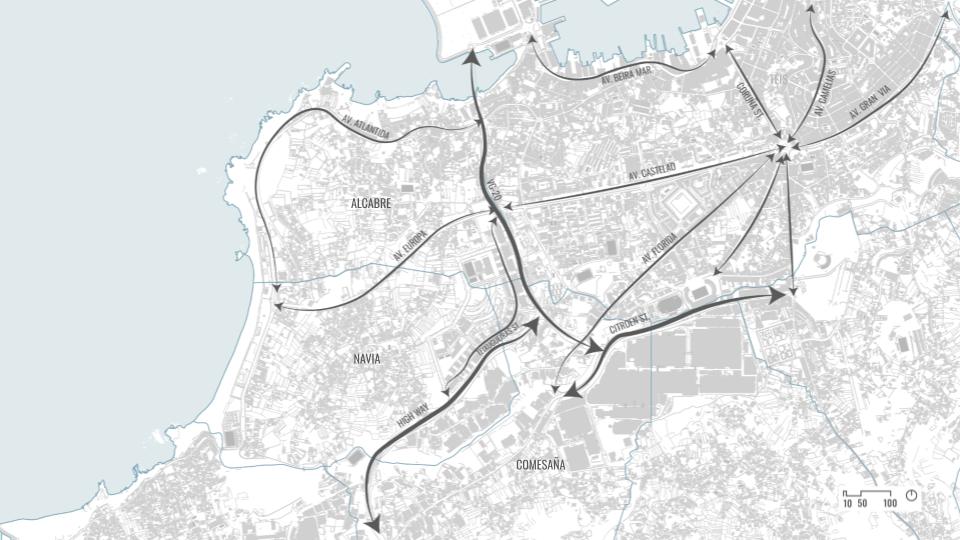
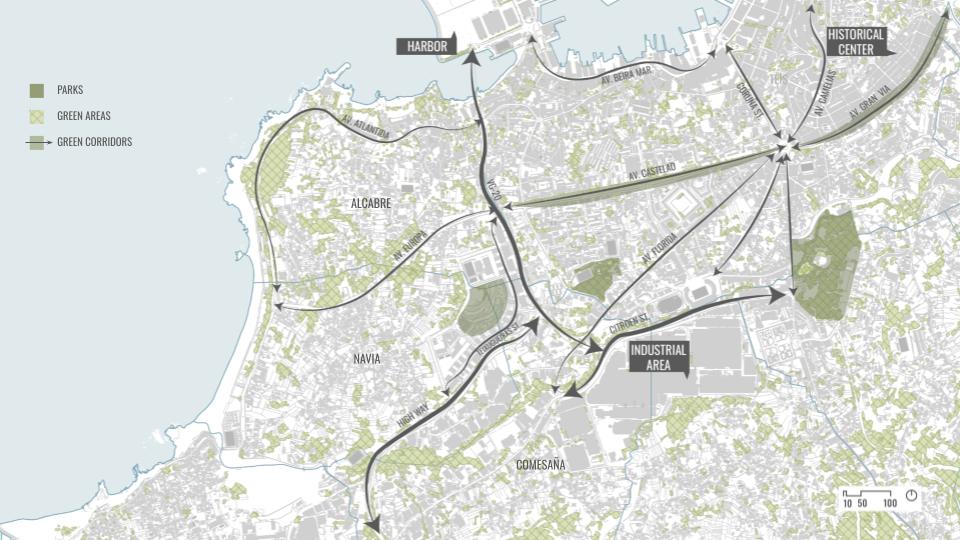
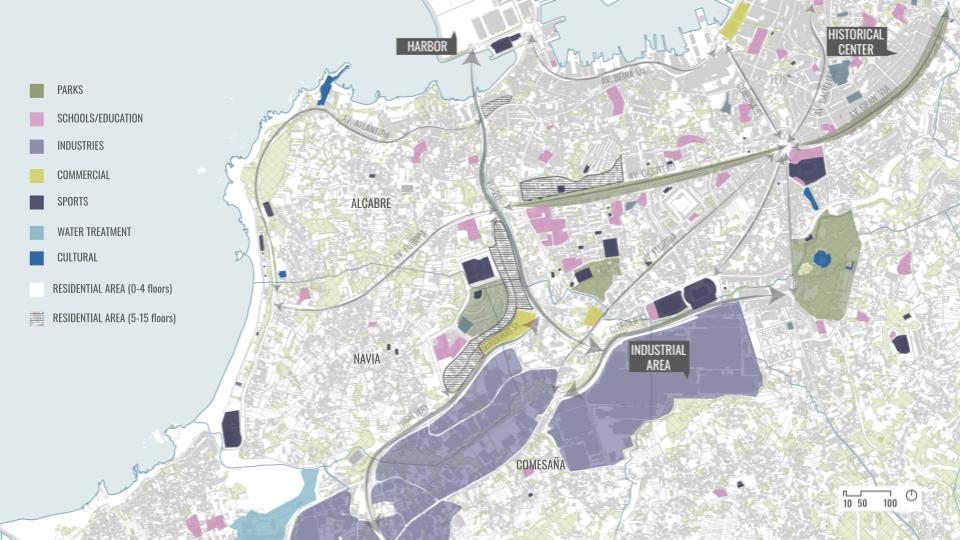
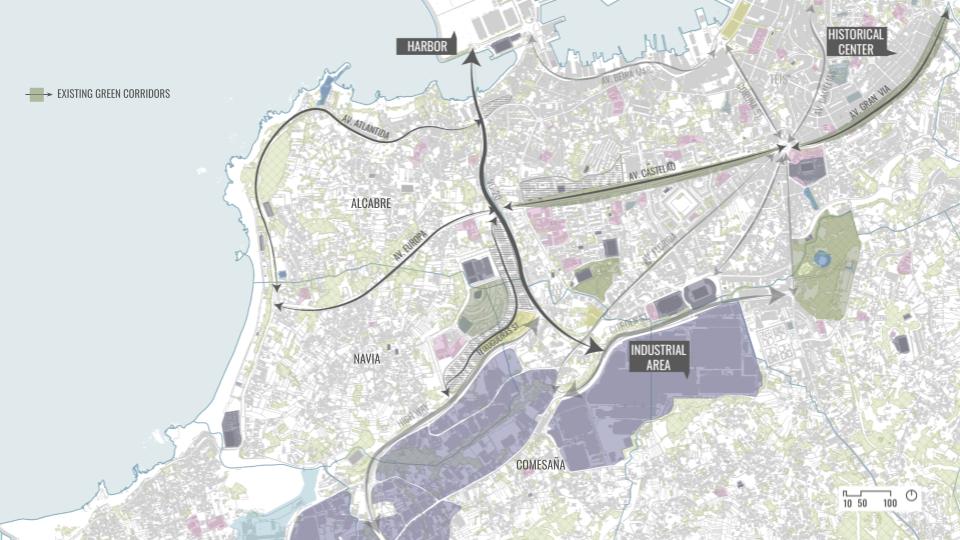
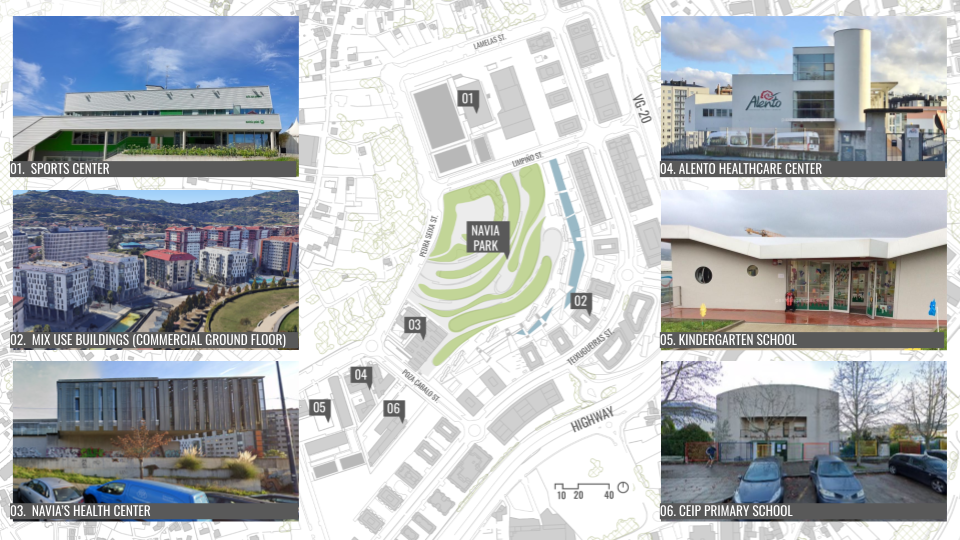
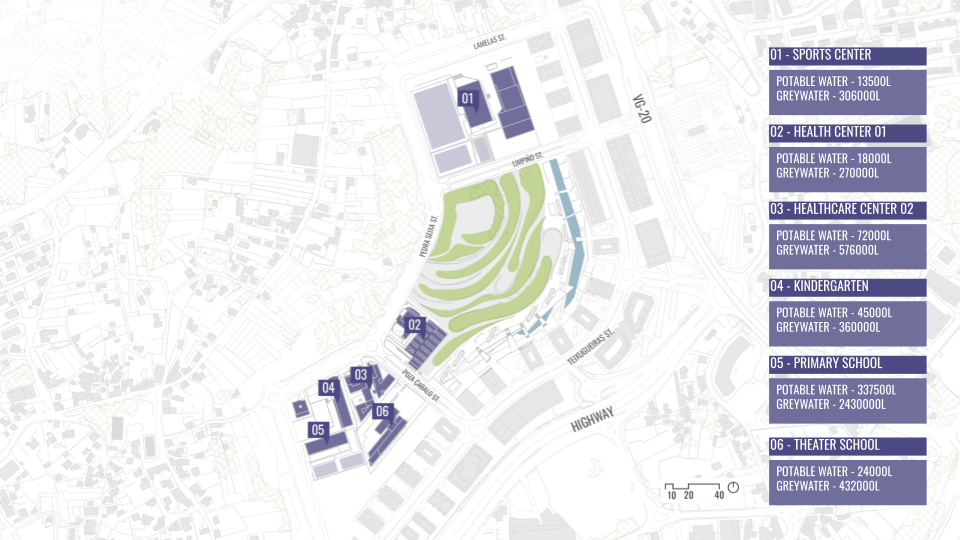
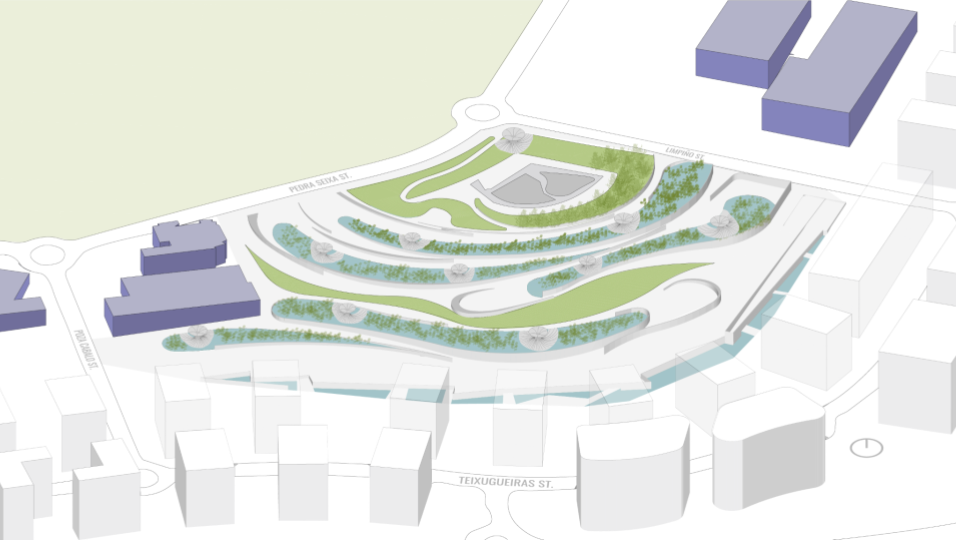
SITE INTRODUCTION
The site chosen was in a country with high water stress to show the potentials of our intervention and from where our material waste was abundant.
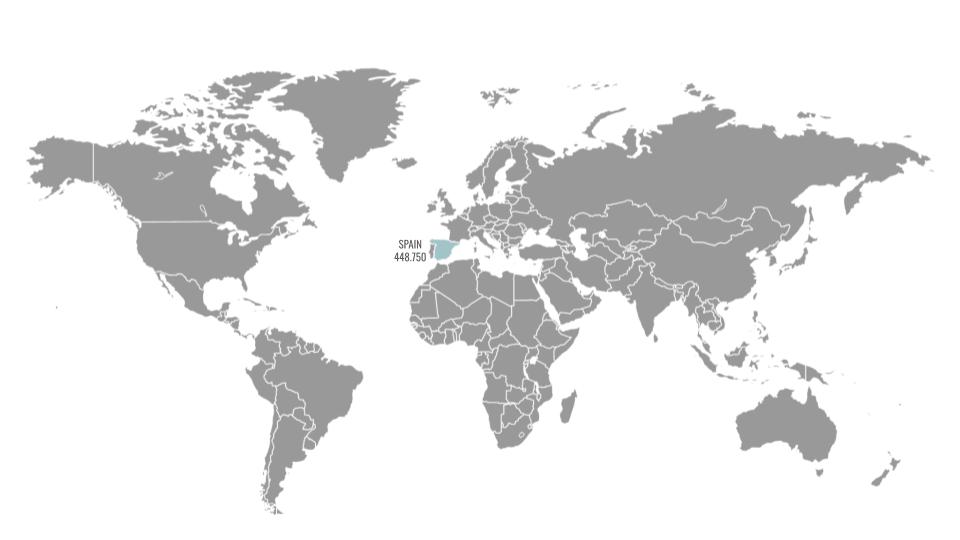
The region of Galicia in Spain is a place where we have abundant rainwater for many months and still suffers with water scarcity. It is also the region from where our material is sourced in abundance.
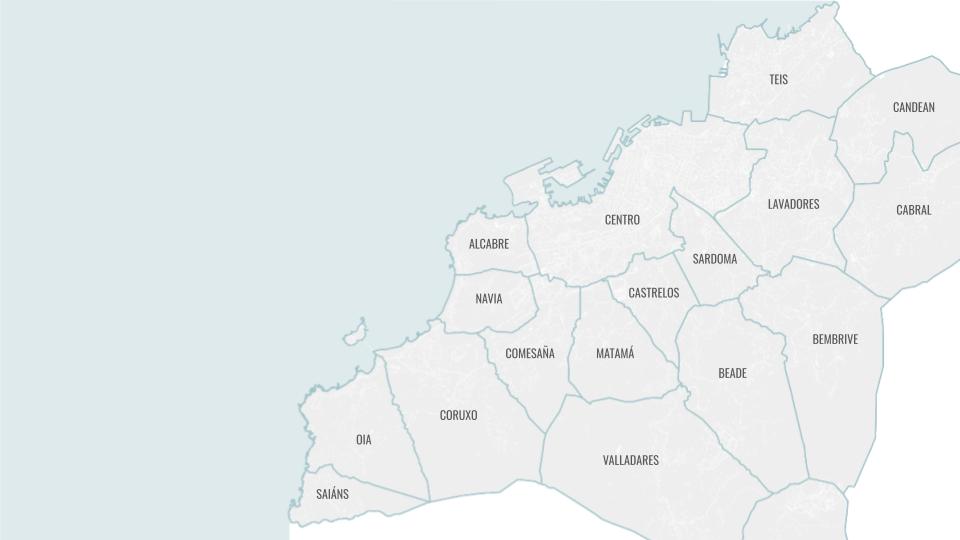
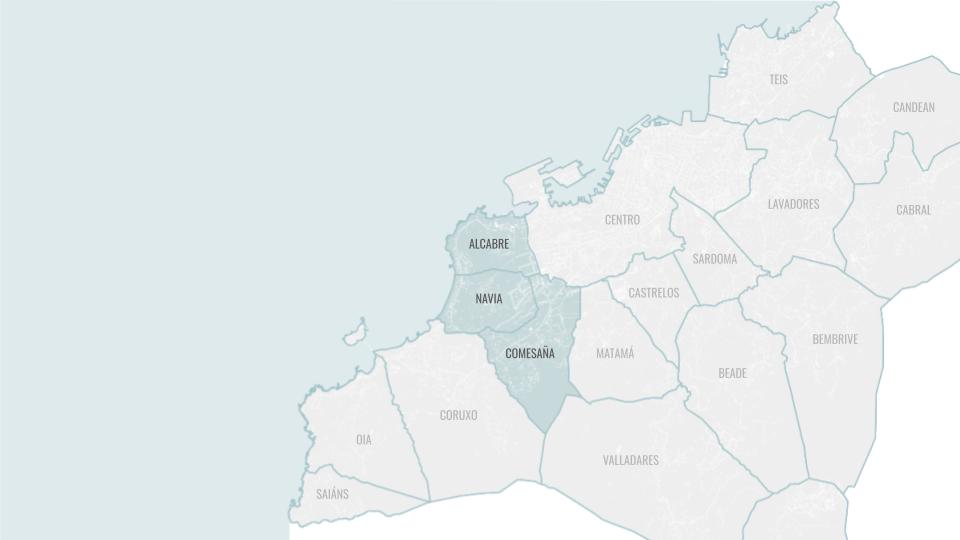
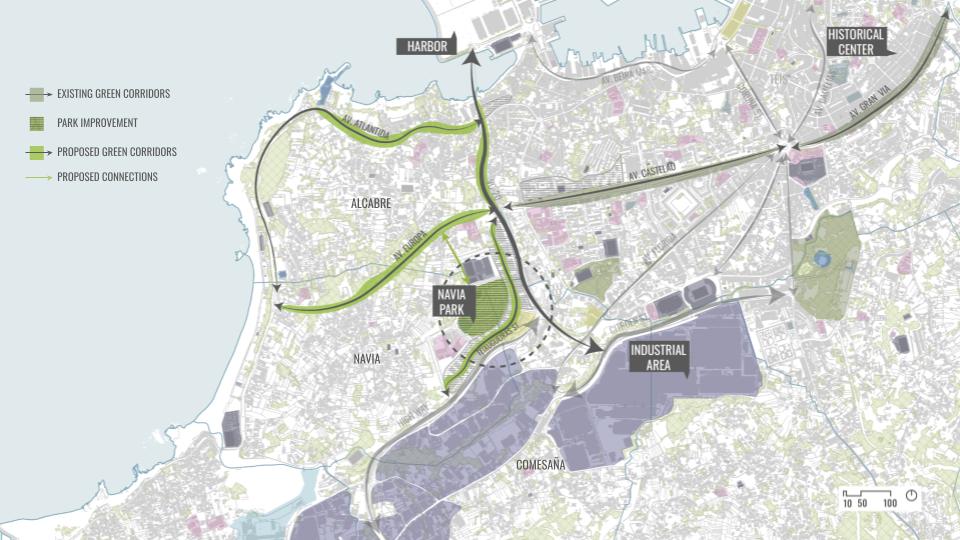
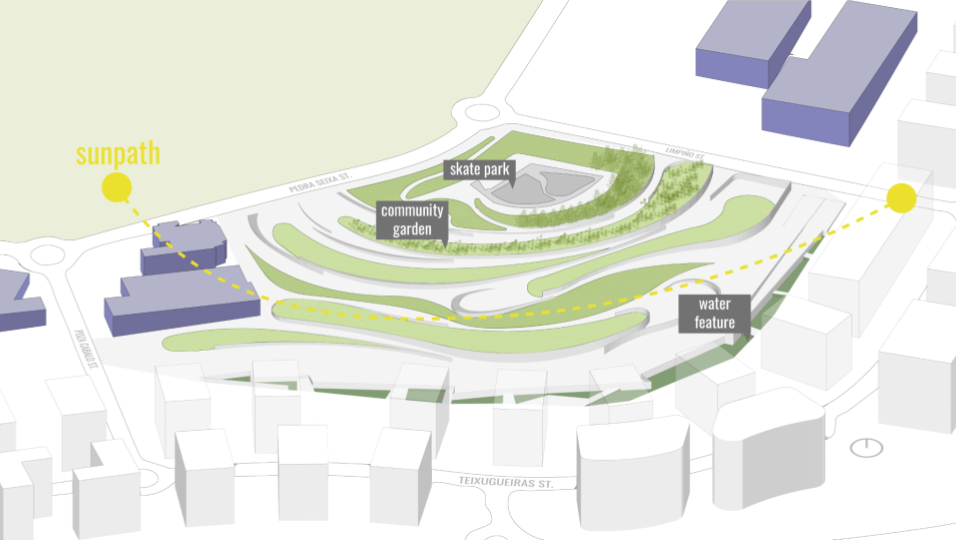
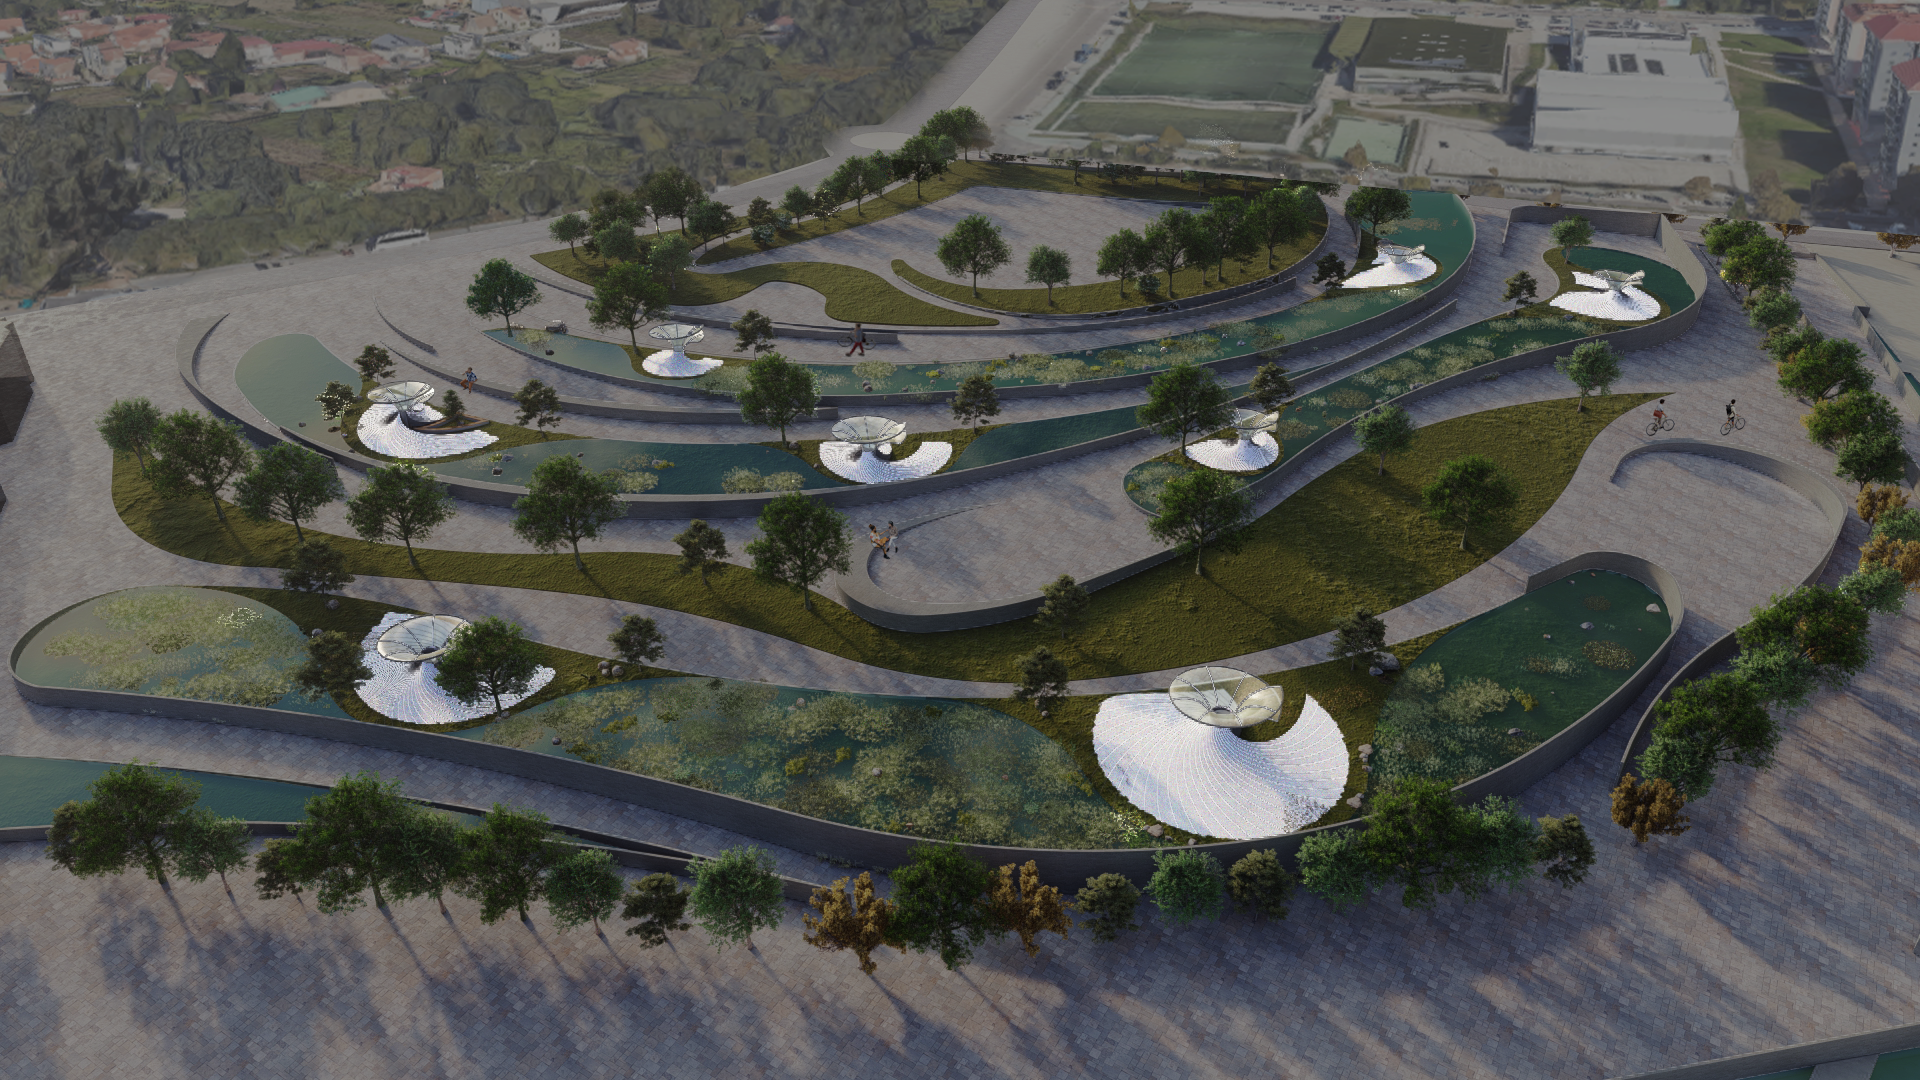
DESIGN INTERVENTION


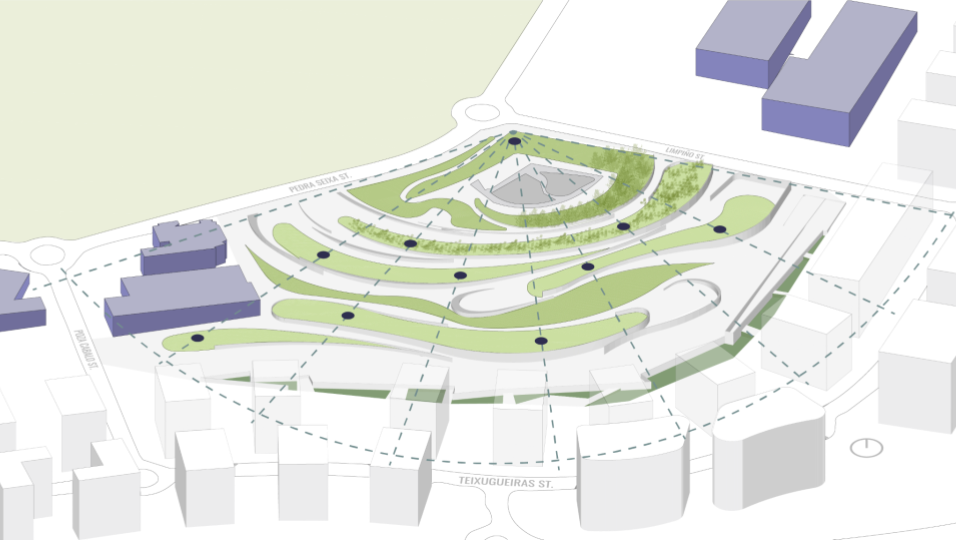

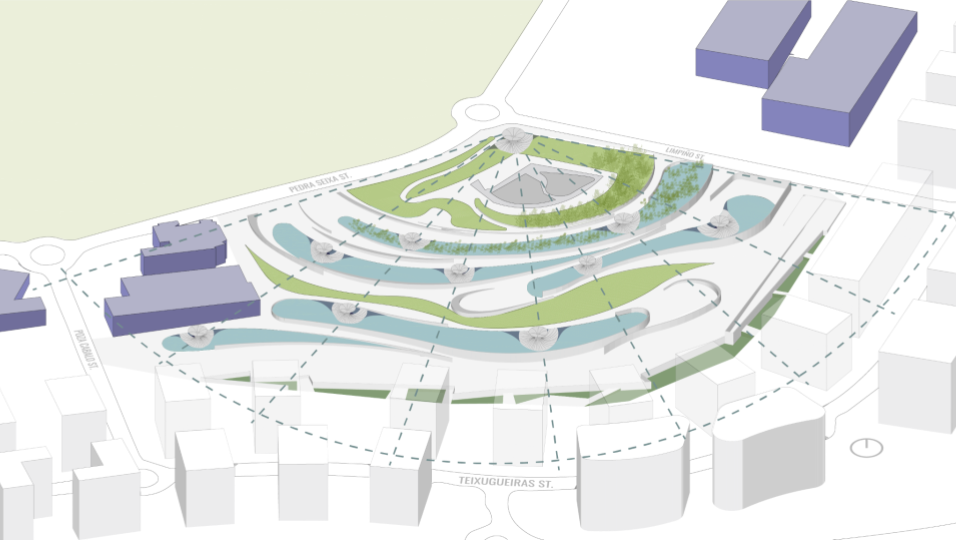

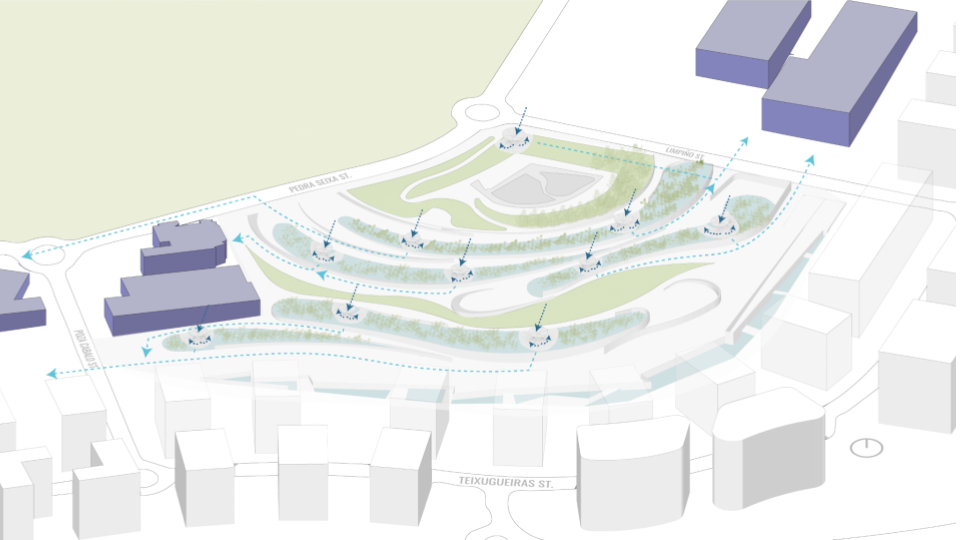


WATER SIMULATION ON CANOPY
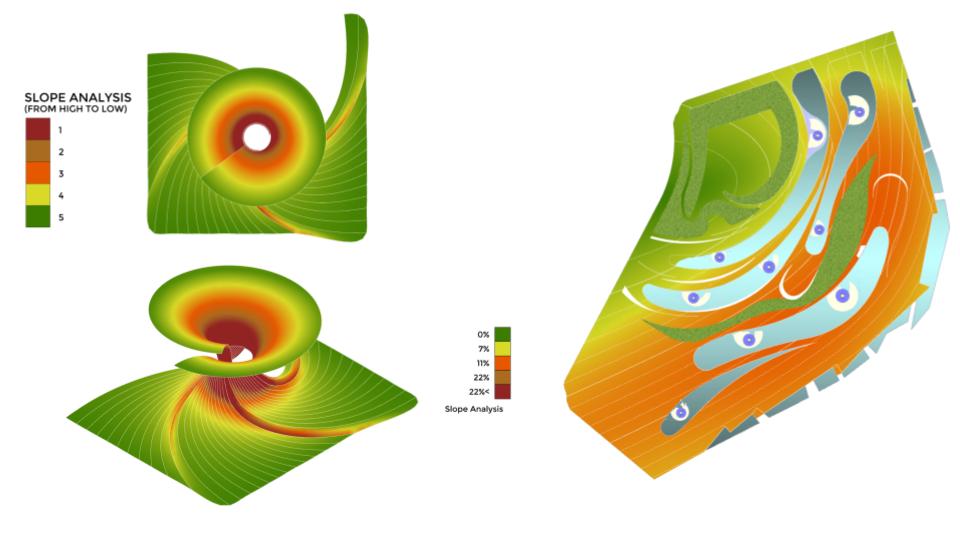
SLOPE ANALYSIS FOR CANOPY AND SITE