

View some of the collected data here: Street Types and Property Information
Genius Loci was inspired by the work the of Sarah Williams in her book ‘Data action – Using data for public good’. In today’s data-driven world, the use of data has become increasingly pervasive, shaping various aspects of our lives from policymaking to urban planning. However, as Sarah Williams argues in the book, the creation, collection, and analysis of data can both empower and marginalise communities, depending on how it is wielded. Against this backdrop, the city of Manchester stands at a crossroads, poised to harness the potential of open data while navigating the complex legal and ethical considerations that accompany it.
Williams emphasises the need for an ethical and transparent approach to data collection and sharing, one that prioritises fairness and respects the individuals represented in the data. In the context of Manchester, this means recognising that data cannot be divorced from the ideologies of those who control its use. Central to Williams’ approach is the concept of data democracy – the idea that communities should have a say in how their data is collected, processed, and shared. This requires meaningful collaboration with a diverse range of stakeholders, including policymakers, designers, data scientists, and local scholars. Most importantly, it necessitates the direct involvement of the communities represented in the data, ensuring that their voices are not marginalised and that biases are mitigated.
The aim of the app was to negotiate these challenges, processing data from various open repositories and aggregating the result to deliver local communities and stakeholders with meaningful insight to better inform decision making.
Data Layers

The task first required the collection and processing of data from various sources as shown in the diagram above. Data came in a range of formats such as shapefiles and CSV files. The range of sources required different techniques in order to collect and then format the data into useful information. QGIS was used as a repository through which the data was cleaned, re-projected (Mercator WGS 84) and then exported ready to be used in grasshopper. This tool also allowed the creation of point based shapefiles from lat-long information in the CSV files.
Grasshopper Definition

The definition utilises Urbano to process both the shape files and the open street maps data. Metadata is then extracted from the files to provide features which can be compared with the postcode polygon boundaries from the Ordnance survey code-point data set , providing a distance and a binary score based on a tunable hyper-parameter. User input is then used as a multiplier for each features which then returns an updated score which are then sorted and used to rank the postcodes based on the result. The app the displays geometry relating to the top 5 performing postcodes and their respective metadata.
Metadata

Data sets were downloaded from both the U.K governments price paid database and the Energy Performance of Buildings Data. These datasets include information relating to the whole of the U.K and include information outside the scope of this study. Custom python files were developed in order to process the CSV files, cleaning the file and performing the required calculations and then returning the result in the form of a new file. The results of these were then appended together using the postcode to provide the metadata file for the app.
User Interface
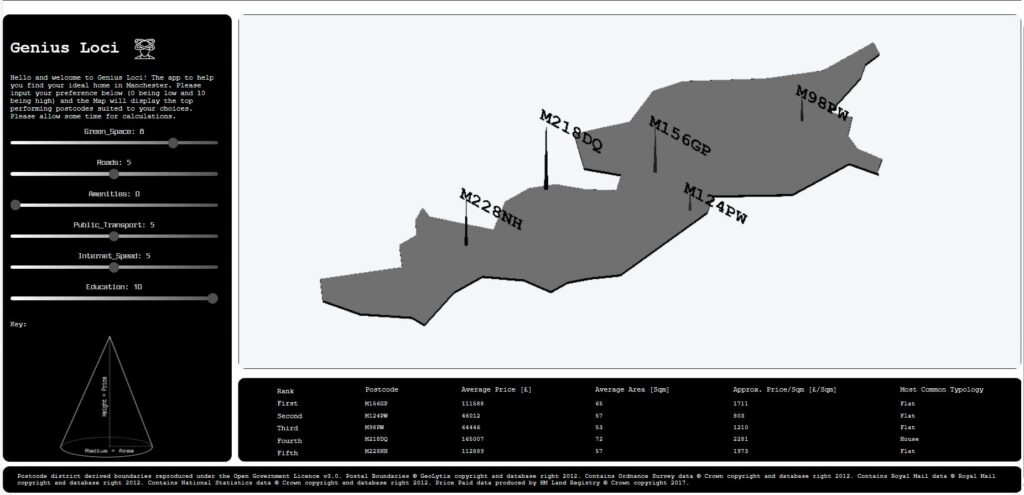
The app’s user interface was crafted utilising a blend of programming tools including HTML, CSS, and Vue.js to exhibit the 3D geometry. Connecting to a Rhino.compute server, the app facilitates geometric transformations independently of direct program connectivity. The interface itself is simplistic, featuring user inputs and descriptions positioned on the left-hand side, the central display of geometry, and metadata results neatly printed at the bottom. The showcased geometry displays the outline of Manchester, where each cone symbolises one of the highest-ranked postcodes, with height denoting the average price and radius representing the average area. Copyright acknowledgements for the included data are printed in a dedicated bar below.
