
Introduction
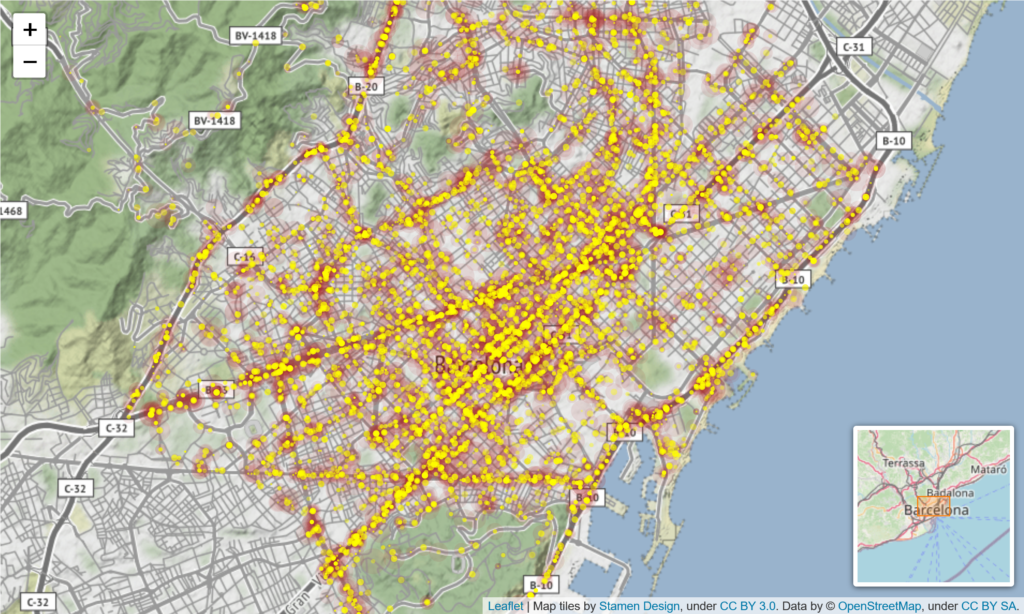
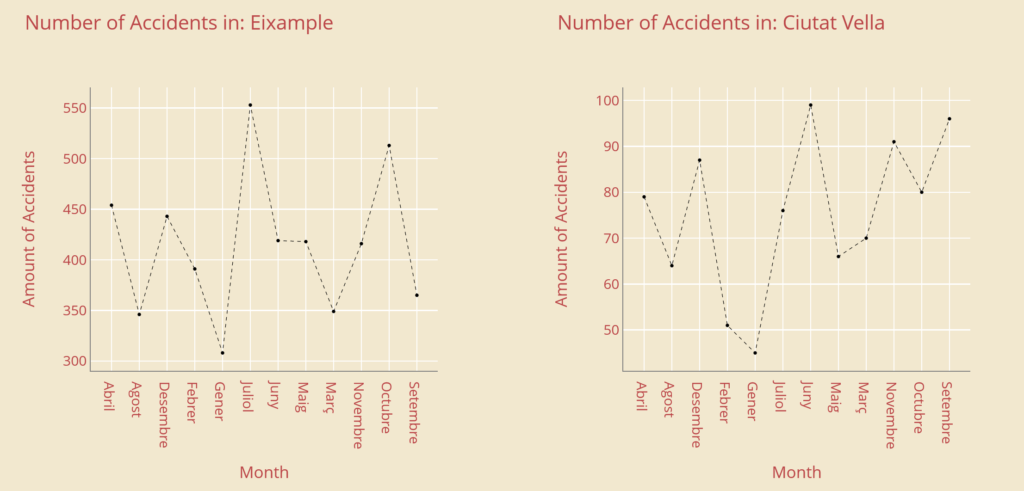
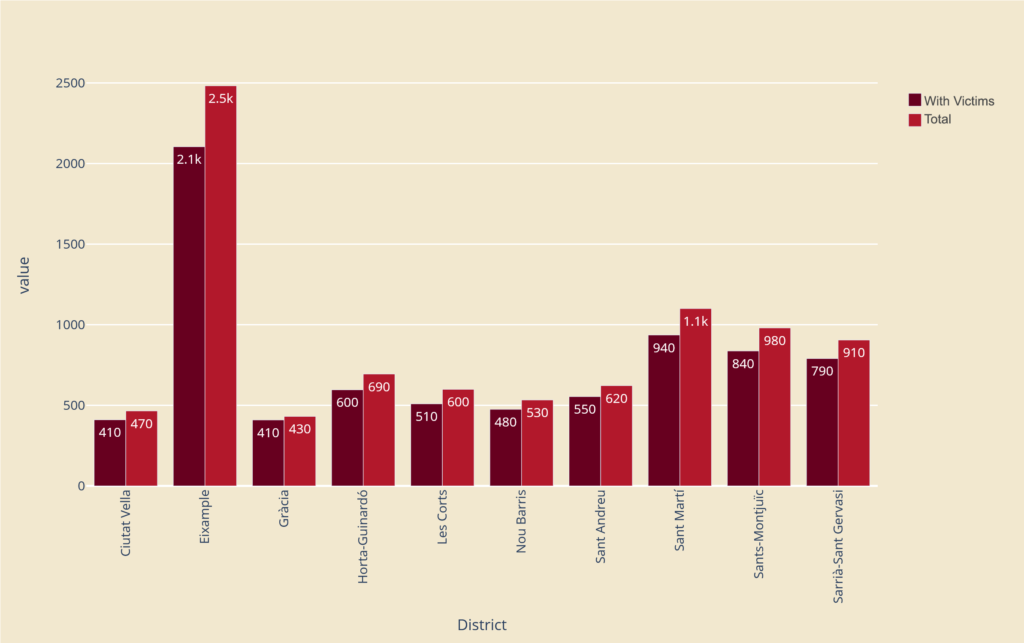
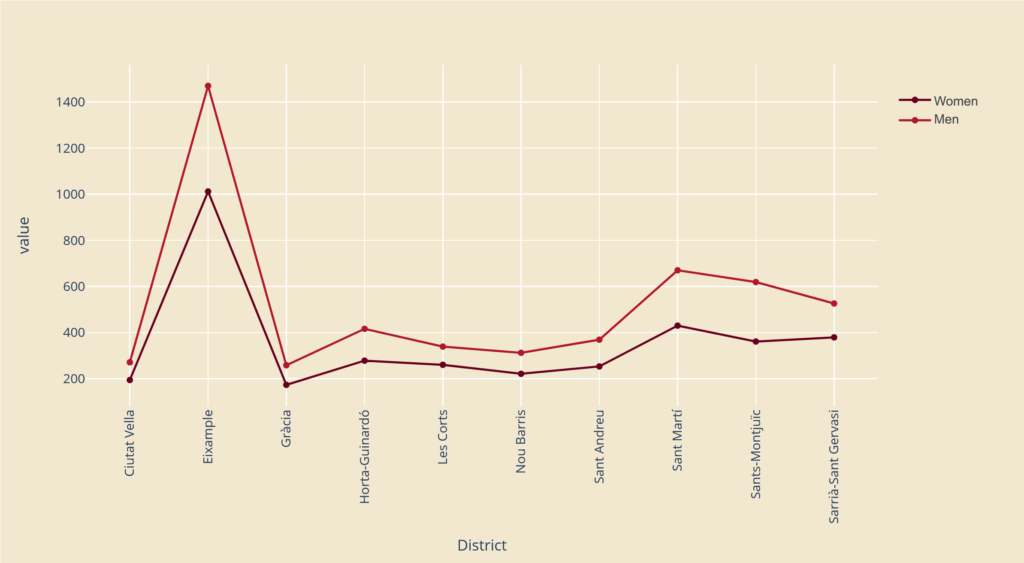
As of 2021, the city of Barcelona has around 3.8 million vehicles (from cars to buses, cars, vans, etc.) circulating on its streets. Despite the efforts of the city council to better balance the motor urban mobility with the pedestrian flow throughout an urbanism model that puts people at the center, street accidents continue to rise year after year. The main causes that contribute to accidents are mainly related to the drivers’ behaviour, ranging from over speeding to drunken driving, red light jumping, or avoiding safety gears, among others. On the other hand, other factors such as pedestrian and passenger behaviour, vehicles’ status, and road conditions have great impact on the traffic safety. The following study aims to analyse and visualise Barcelona’s datasets of road accidents in 2021 to inform and help insurance companies, car companies, the Municipality, public entities and urban planners design a safer city for everyone.
Source:
BCN Road Accidents (Vehicle 2021): https://opendata-ajuntament.barcelona.cat/
BCN Road Accidents (People 2021): https://opendata-ajuntament.barcelona.cat/
