Considering the imminent demolition and in-situ rehabilitation of highly dense slum settlements, how might the application of generative algorithms facilitate the maximization and optimization of housing units within the existing spatial constraints?
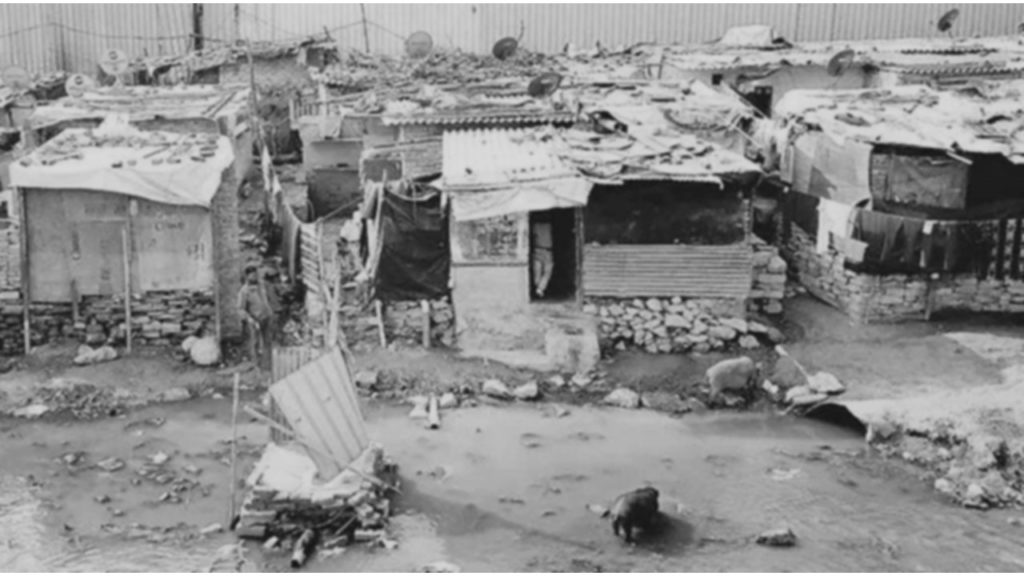
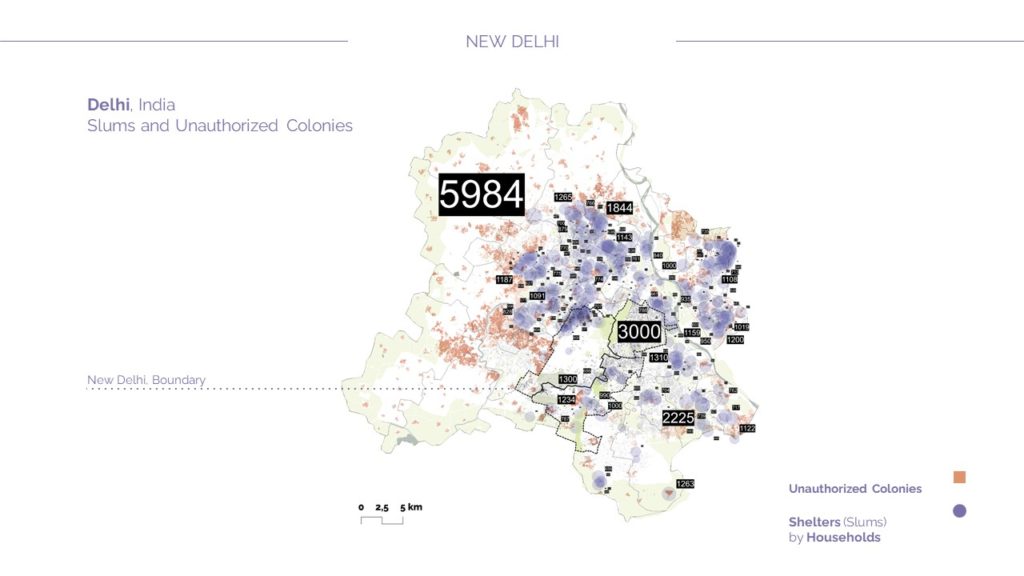
The slums and the unauthorized colonies are located across Delhi to identify which zones needs in-situ slum rehabilitation, there are over 700 slum clusters. According to the Masterplan 2041, the policy highlights that if that slum cluster is below 2000 sqm, the inhabitants will be relocated and if the slum cluster is above 2000sqm, there will be in-situ slum rehabilitation. The study focuses on identifying a slum cluster within the city of New Delhi which is below 2000sqm and a nearby zone to rehabilitate.
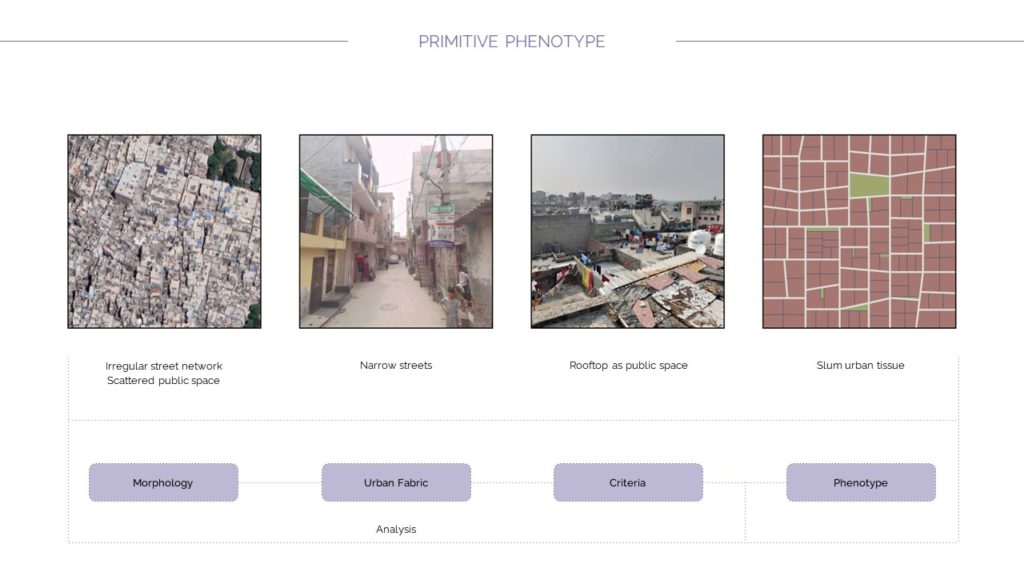
The identified phenotypes to intervene would be the morphology of the urban fabric which has an irregular street network and scattered public space. Another aspect of the urban fabric considered as the phenotype the narrow streets, the third use of rooftops for creating public spaces, and the last one is the slum as an urban tissue.

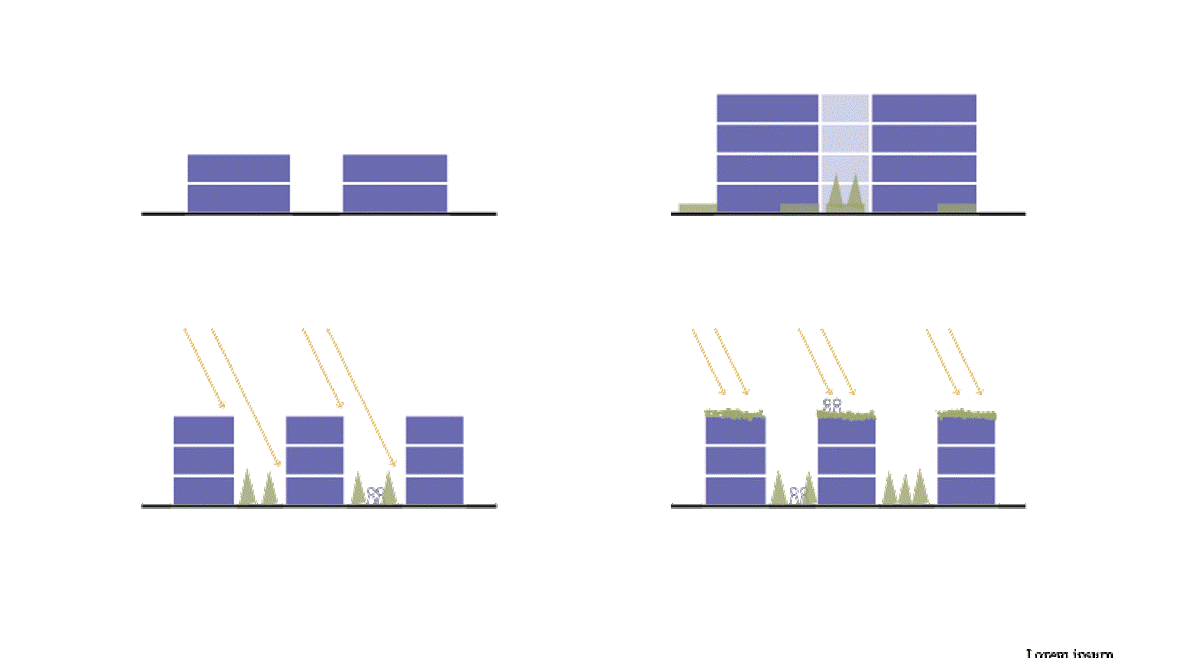
- Maximum Housing Volume
- Maximizing Built & Green Area
- Minimizing Ground Floor Solar Radiation
- Optimizing Rooftop Use Solar Radiation
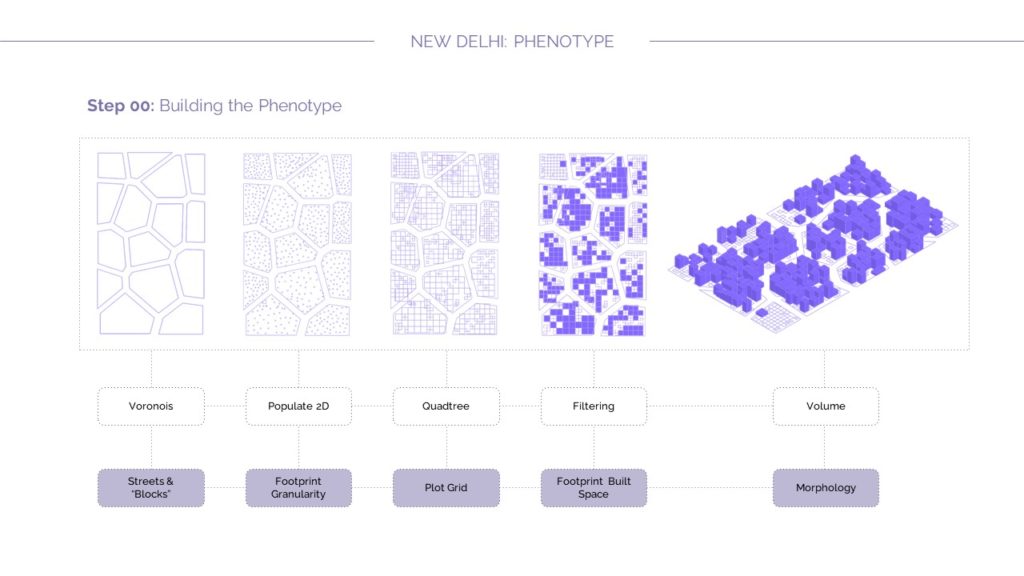
The approach to build on the phenotype is starting with creating a voronoi which could be associated with the streets and blocks, the next step is to populate the geometry with points to be used as the centroids of the building footprint. The quadtree method is used to filter out the grid pattern based on the areas on the plot to create zones of built and unbuilt. The final volume of the built is obtained from the built zones.
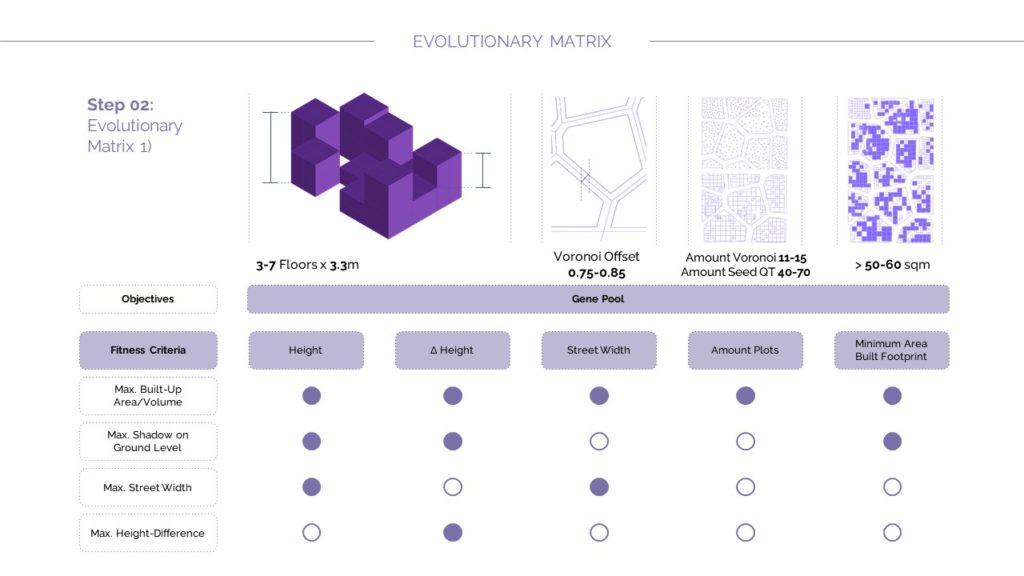
The next step in creating the evolutionary matrix is by using the objectives to create a gene pool for various genes which are- the heights, height differences between floors, street widths, amount plots, minimum footprint area for the buildings. For the heights of the buildings whose dwellings could vary from having 3 to 7 floors of 3.3m each floor. The voronoi offset of which varies between 0.75-0.85m is given which creates the roads based on the other conflicting factors. The amount of divisions of plots varies between 11-15 and 40-70 as the seed values for iterations. Building footprint areas varies between 50-60sqm to have minimum built area.
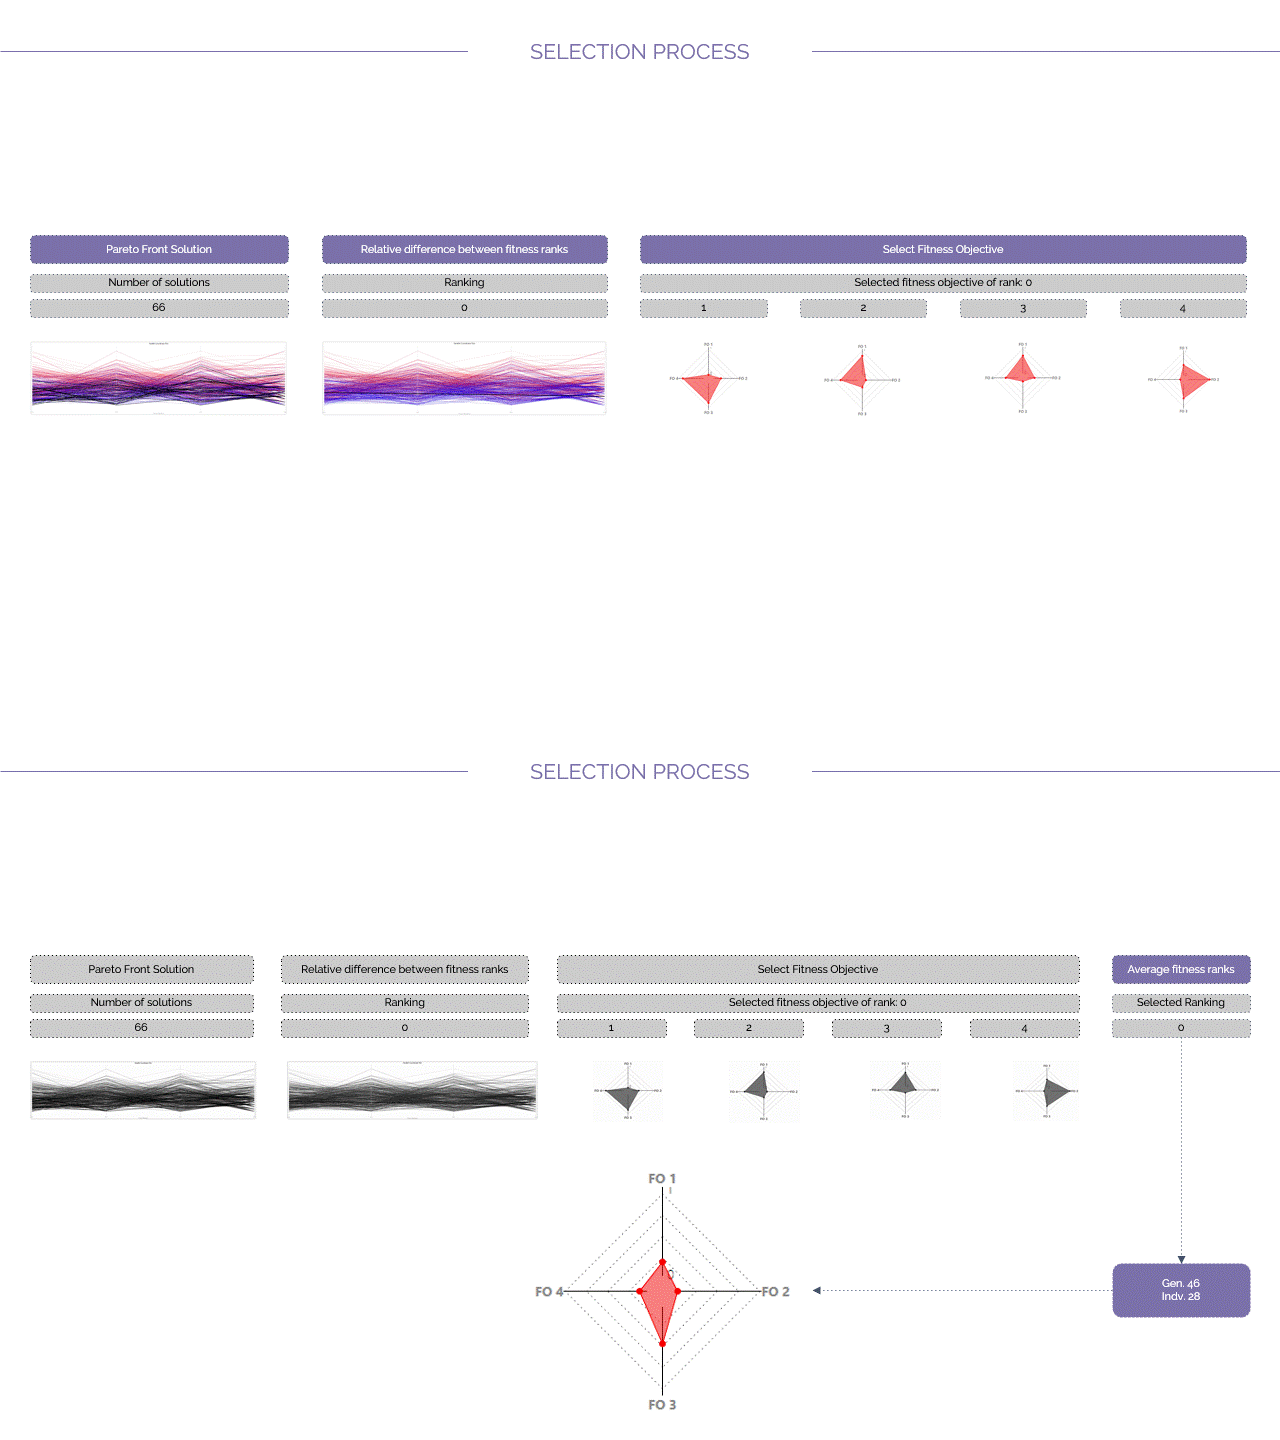
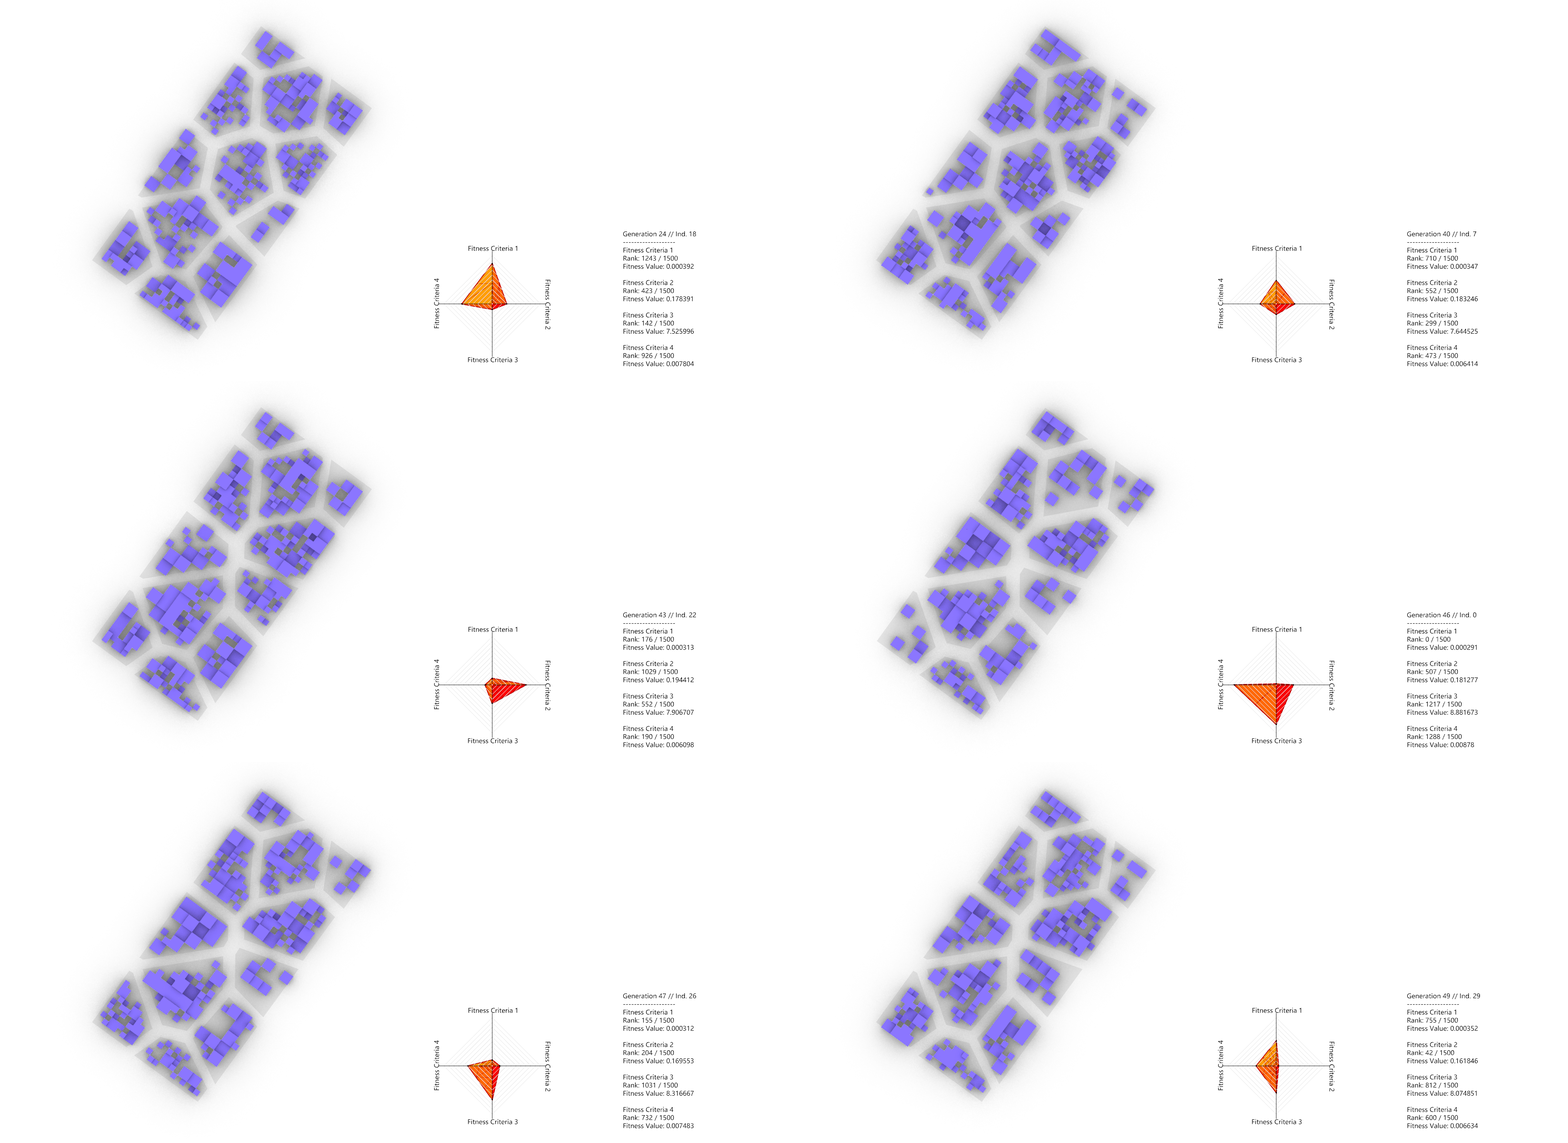
The selection process of the generated algorithms starts with selecting the “pareto fronts” which are 66 in number which represent optimal solutions based on multiple criteria which help with understanding the output based on different design objectives provided and how they are interacting with each other. The next selection method is obtained from the relative difference between fitness ranks, the best ranking in this selection is the ranking 0 solution which is the non-dominated front. The next set of solutions extracted is from the fitness objectives. The fitness objectives of rank 0 is chosen from all the fitness objectives considered to analyze which other objectives are working well for one of the objectives being the dominated one. The last selection process of an optimal front is chosen from the average fitness ranks which refers to the average ranking of each solution in terms of its fitness across multiple objectives. Generation 46 and Individual 28 seems to seems to be the best solution in this case if all objected are considered as equally important and this front has all the objectives equally dominating all the objectives and hence considered one of the best solutions.
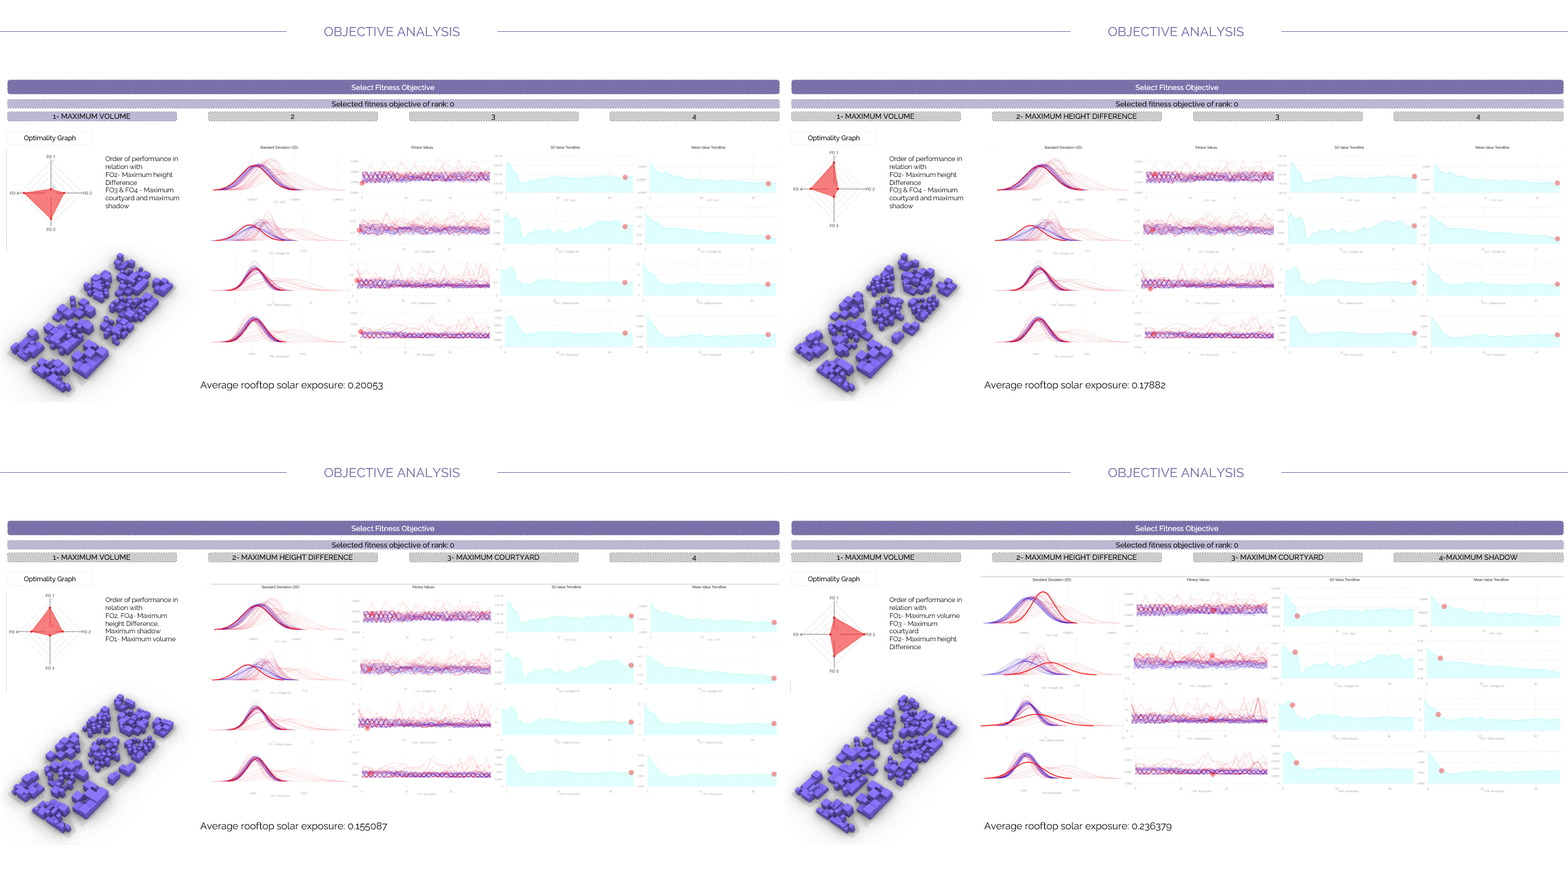
Objective 1(Maximum Volume): The conclusions from the objective is that the order of performance for the second objective (maximum height difference) is working well in relation with the first one, followed by the other objectives (maximum courtyard and maximum shadow).
Objective 2(Maximum Height Difference): The conclusions from the objective is that the order of performance for the second objective (maximum height difference) is working well in relation, followed by the other objectives (maximum courtyard and maximum shadow).
Objective 3(Maximum courtyard): The conclusions from the objective is that the order of performance for the second objective (maximum height difference) and the fourth objective (Maximum shadow) is working well in relation, followed by the first objective (maximum Height Difference).
Objective 4(Maximum Shadow): The conclusions from this objective is that the order of performance for the first objective (maximum volume) is working well in relation, followed by the other objectives (maximum courtyard and maximum difference).


The above parallel coordinate plot shows the 66 pareto front solutions which are highlighted in black lines. These lines are seen at the bottom of the parallel plot which indicates that the best trade offs between the different objectives assigned which could be helpful in making an informed design decision in selection of an optimal solution suitable for the proposal.
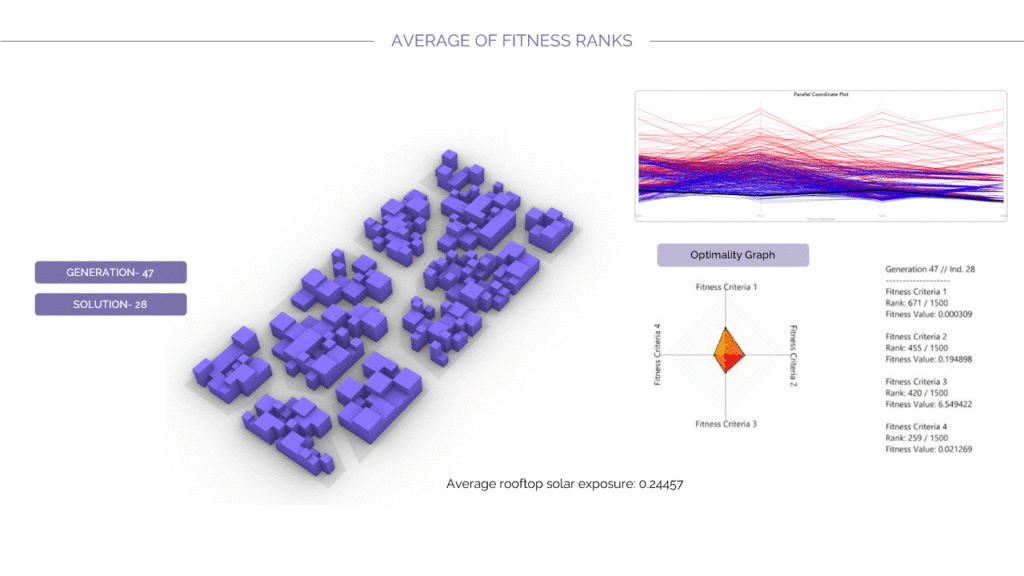
Average fitness rank solution is the one chosen as an optimal solution for the design proposal based on the objectives assigned to the phenotypes and the genes. This model has an adequate iteration of the open spaces to the built and height differences between floors, and they have optimized minimized ground floor radiation and optimized solar radiation in the rooftops. The average ranking of the solution refers to the average fitness across multiple objectives, which is clearly seen in the diamond graph where the points are in equidistant from the center.
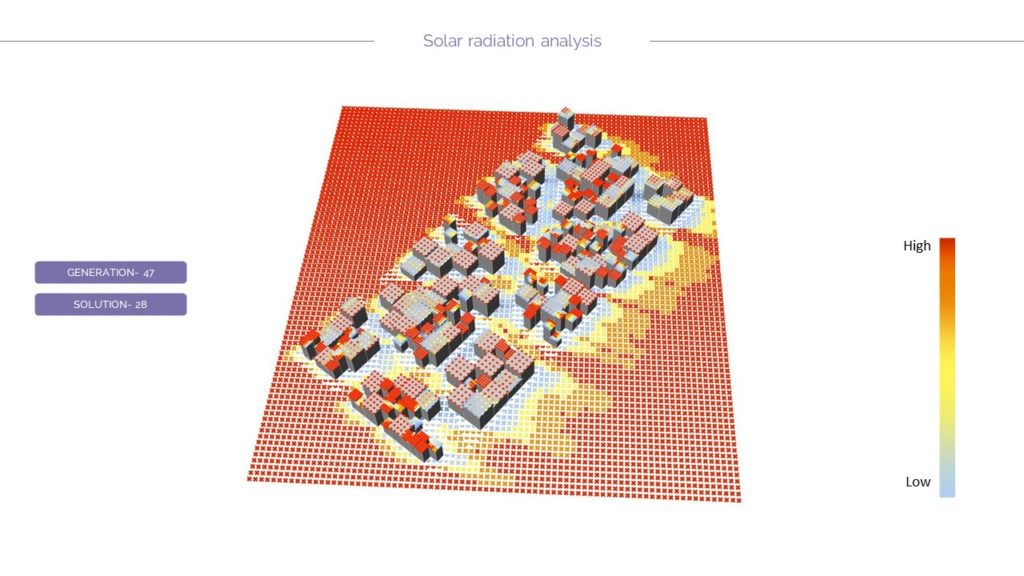
The above diagram shows the optimization of the selected solution in terms of the solar analysis to maximize the shadows and minimize the sun radiation as the climate in Delhi has extreme hot temperatures. The optimization also involves maximization of solar radiation on rooftops which could be later used for rooftop greening.

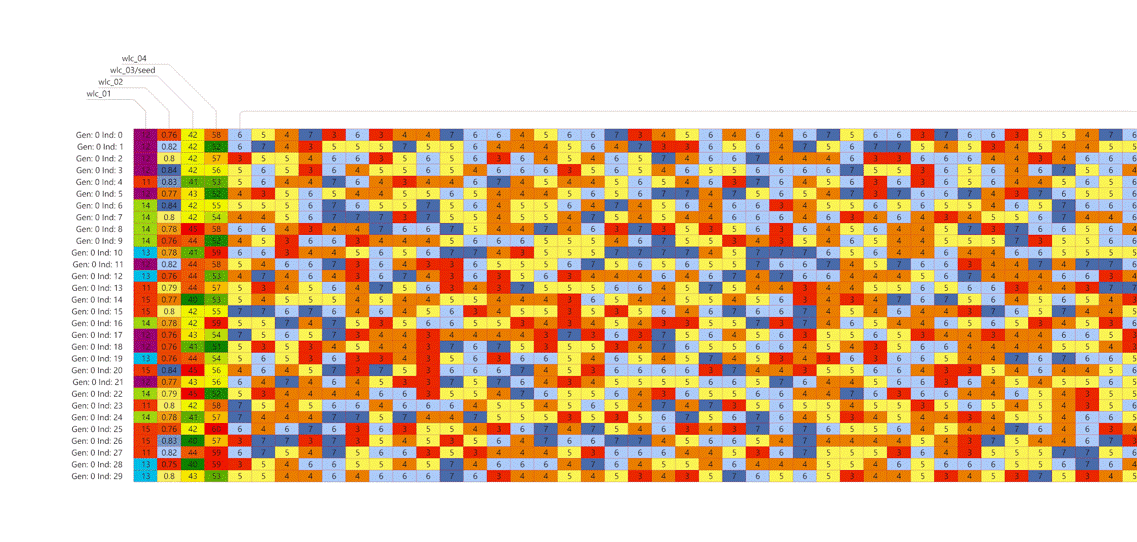
The genomic sequencing allows for deep diving into the genetic mechanisms behind their evolutionary simulations. It equips with decoding the genomes to understand the DNA as it provides stronger understanding of stronger evolutionary outputs. As we scroll through the sequence, we notice the convergence of the genes to a particular numeric value.

The above image shows the chromosomes of the best chosen solution generation 46 and its respective individuals

