A Balance of living in a Hyper scale
Concept
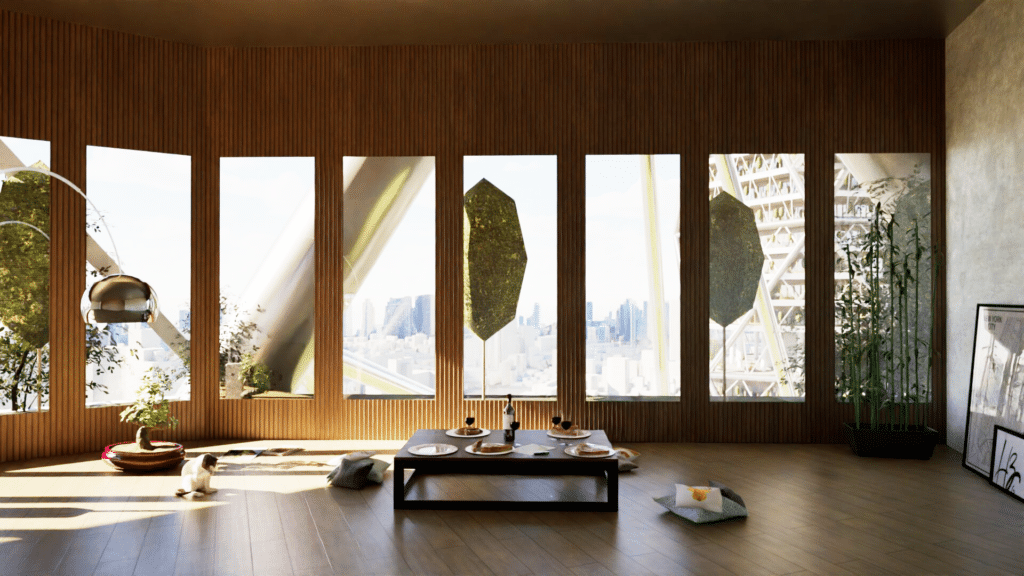
Hyper-Buildings Have become a symbol of Dark and Dystopian living, where residences are in low living standards & disconnected from the world. Residential living in a hyper-building must balance high-density living with comfort, health, and amenities that can support and sustain inhabitants. The Residential Team aims to put the residence health and comfort at the center of every decision taken using data driven design alongside Hyper-b team to ensure the ecosystem within the hyper-building is met with satisfaction rather than desolation.
Data Generation – Global Optimization
Optimum Positioning of Tower Masses within The Site Boundaries
A global optimization process is implemented to systematically assessing and strategically positioning tower masses within the site’s boundaries. This approach ensures an optimal balance between natural sunlight and unobstructed sightlines. With it comes a process involving close collaboration with the Data team to integrate a comprehensive data-driven analysis. This collaboration facilitates the development of a globally revised sum of multiple programs within the tower and Bridges connections floorplates. With urban context responsiveness, we leveraged computational analysis and multi-criteria evaluation, the project refines massing decisions to achieve a well-balanced and performance-driven architectural outcome.


Data Generation – Sun Hour Daylight Simulation
Providing Natural Daylight Deep into the Floor Plate
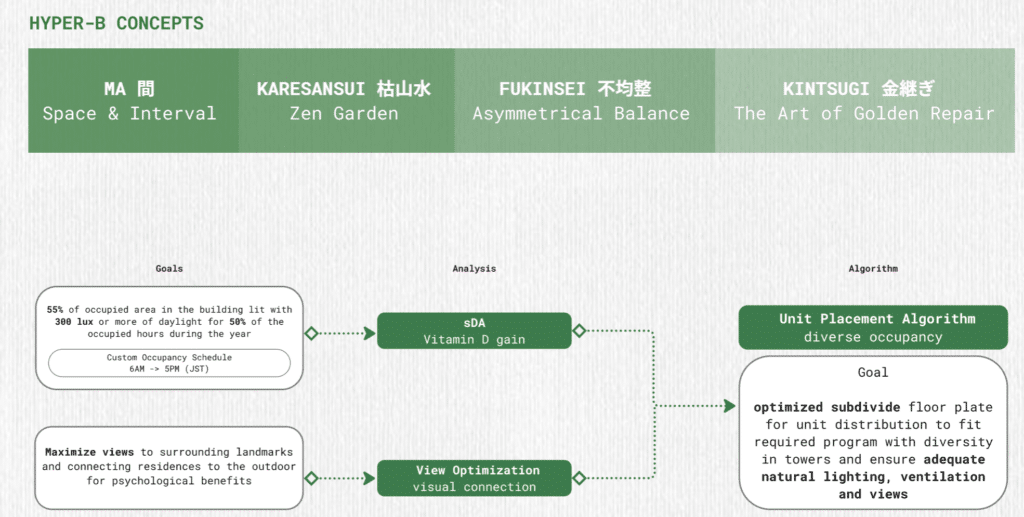
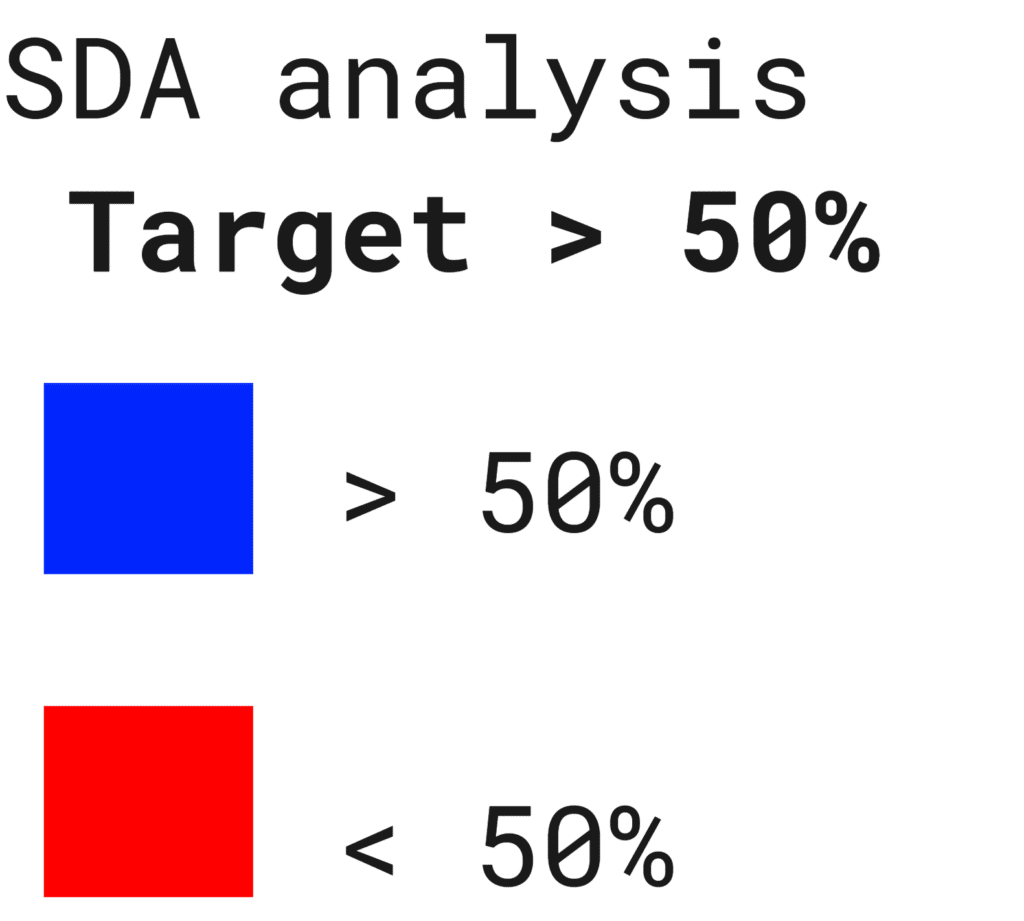
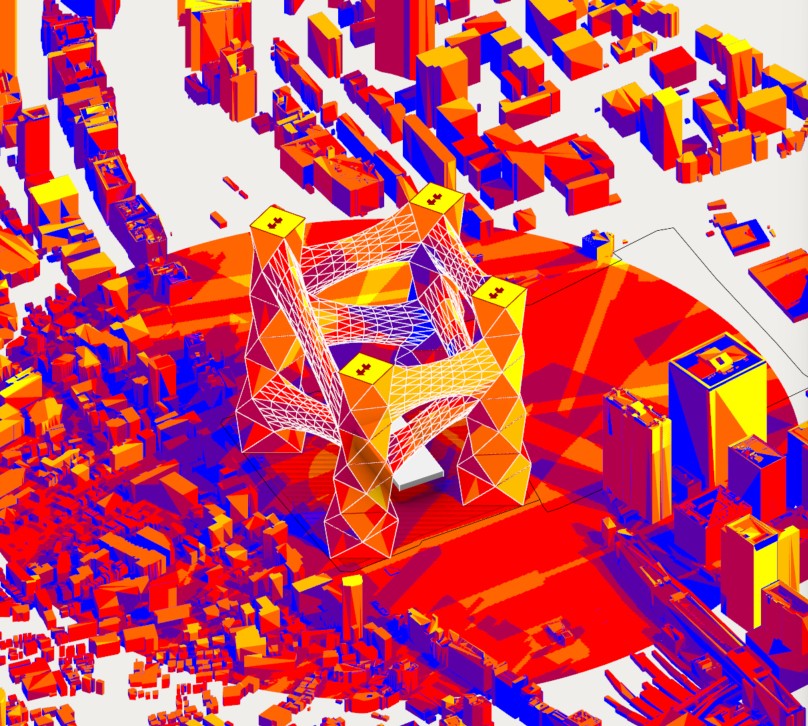
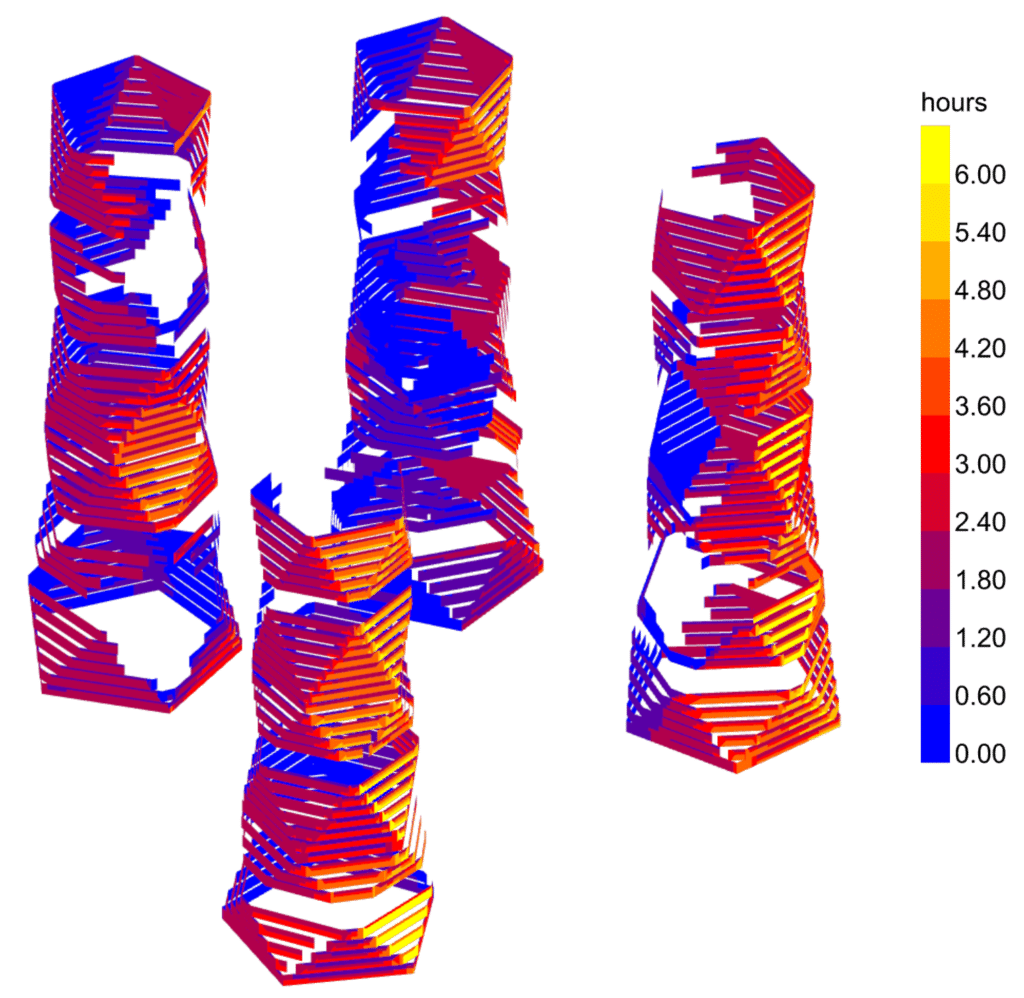
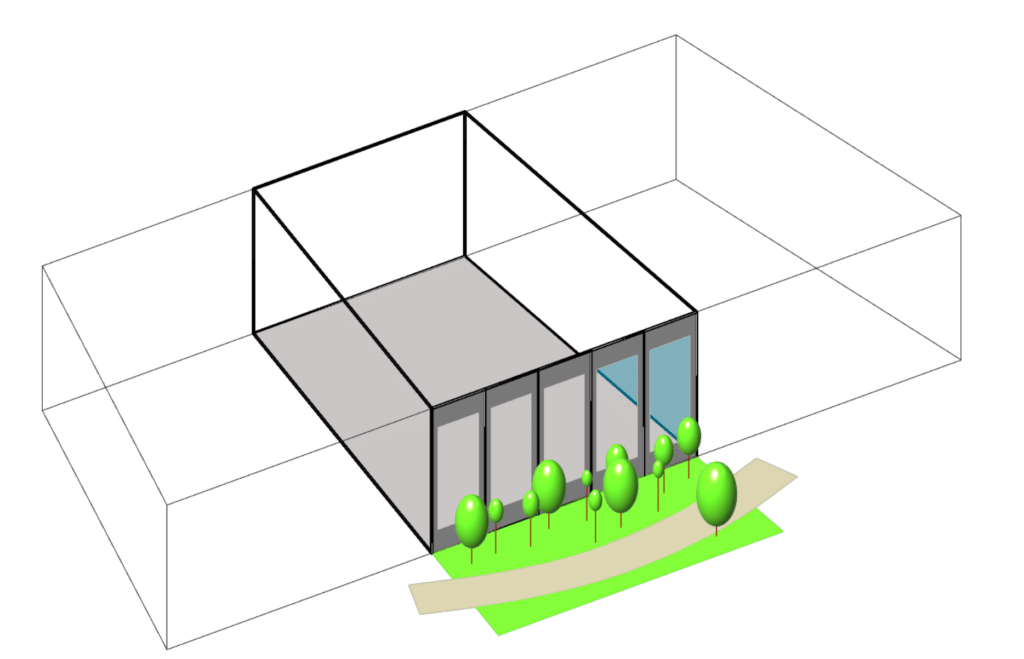
Aiming to provide sustainable solutions to the residences for healthier and nature connected living, the global optimization seeks to position towers within the site to allow sunlight to go deep into the floor plates and units achieving a Daylight Autonomy of more than 50% of the time Not only improving indoor environmental quality but also reduces the reliance on artificial lighting, leading to significant energy savings and improved occupant well-being. Spatial Daylight Autonomy (sDA): Ensure a high percentage of spaces meet daylighting thresholds to reduce reliance on artificial lighting. sDA300/50% (LEED) ≥ 55% of total floor area / Achieving this ensures at least 55% of floor area gets adequate daylight for 50% of occupied hours.
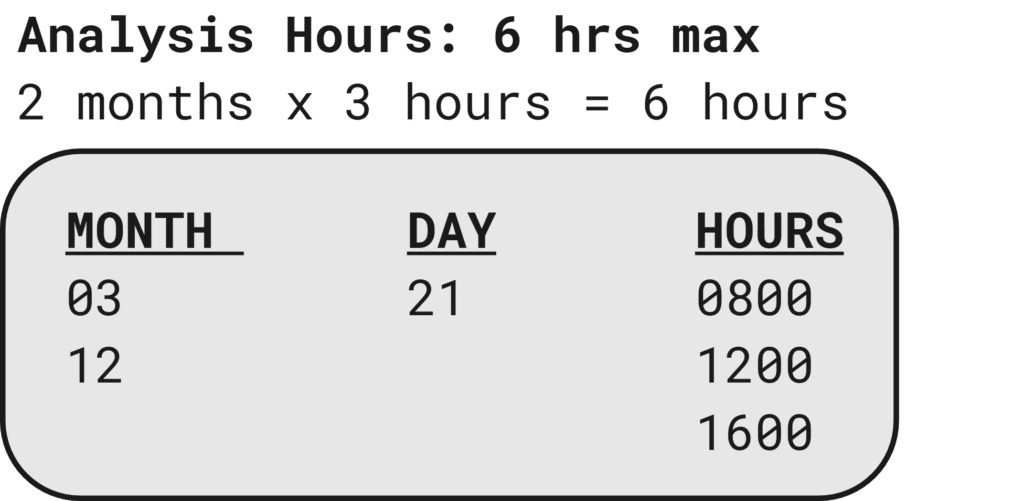
In addition to the daylight simulation we can also calculate for each unit the Sunlight daylight hours. This allows us to understand how much direct sun can be expected at certain times of the year at each unit’s facade. The benefits of this promotes natural daylight use and in winter months allows for passive heating inside units.
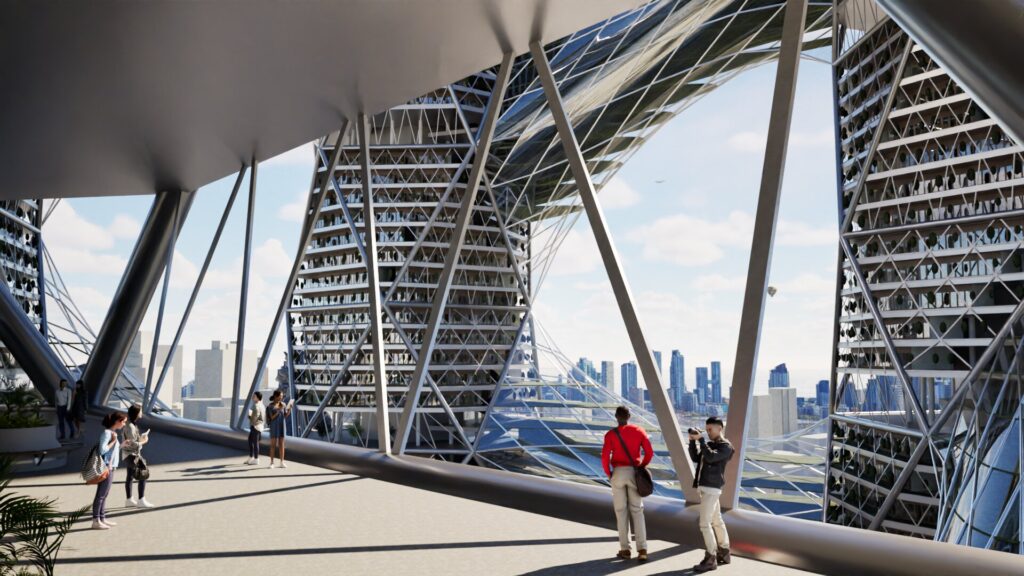
Data Generation – View Optimization
Orientation Toward Preferred Views
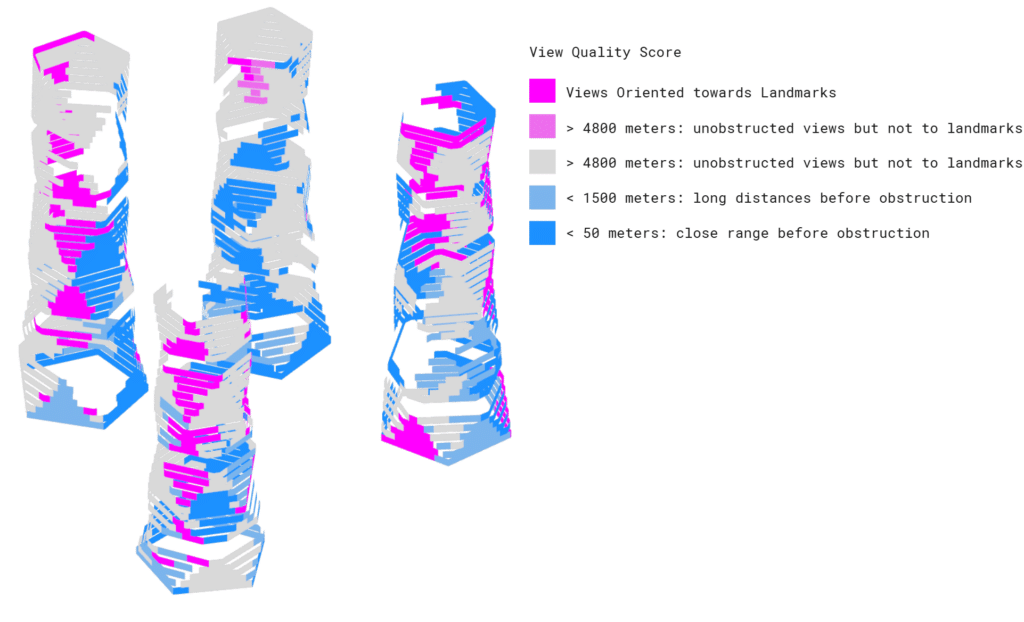
By experimenting with different building configurations and orientation, our goal is to achieve an optimal tower position with unobstructed views and extended sightlines as far as possible. his process not only enhances visual connectivity with the surrounding environment but also contributes to the overall aesthetic and experiential quality of the development. Additionally, we are specifically targeting key natural and urban landmarks to establish a strong connection between the towers and Tokyo’s most iconic sights like Tokyo Bay (SE 123°) | Mountain Fuji (SW 243°) | Tokyo Tower (NW 350°) | Tokyo Sky tree (N 40°)
By manipulating a View Gard at these locations, we are rewarding orientations that look toward the landmarks, thus an optimizer understands orienting toward them will yield higher results leading toward views that look toward them.

.png")
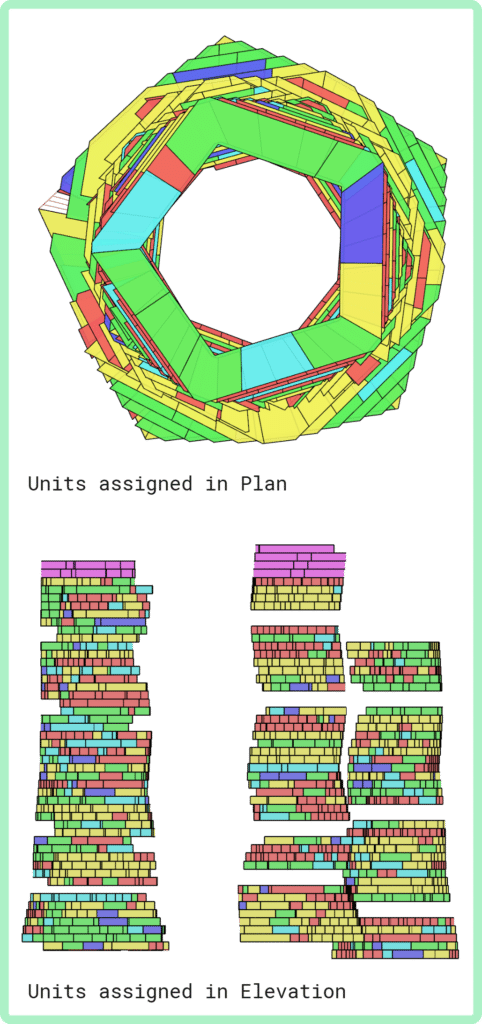
Data Generation – Unit Distribution
Exploration of the program – Unit Placement and Distribution
By experimenting with different unit configurations, our goal is to create a diverse floor plate mix that enhances spatial variety and fosters interconnected community. A holistic unit strategy approach is applied to generate a desired unit arrangement. This is achieved by integrating comprehensive global design strategies with a structured, top-down subdivision methodology. By systematically breaking down the building mass, we ensure a well-balanced distribution of units, maximize access to natural light, and curate a rich spatial experience that responds to both urban and environmental contexts.
Spatial Requirements
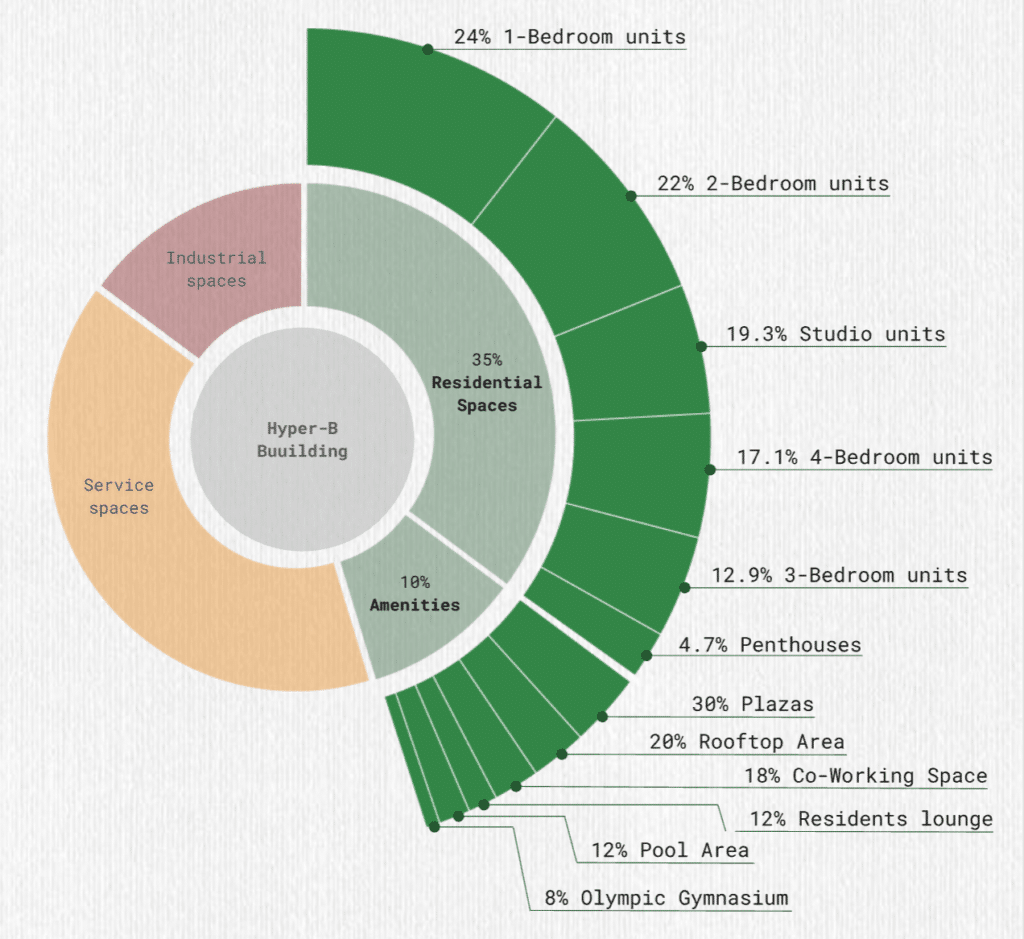
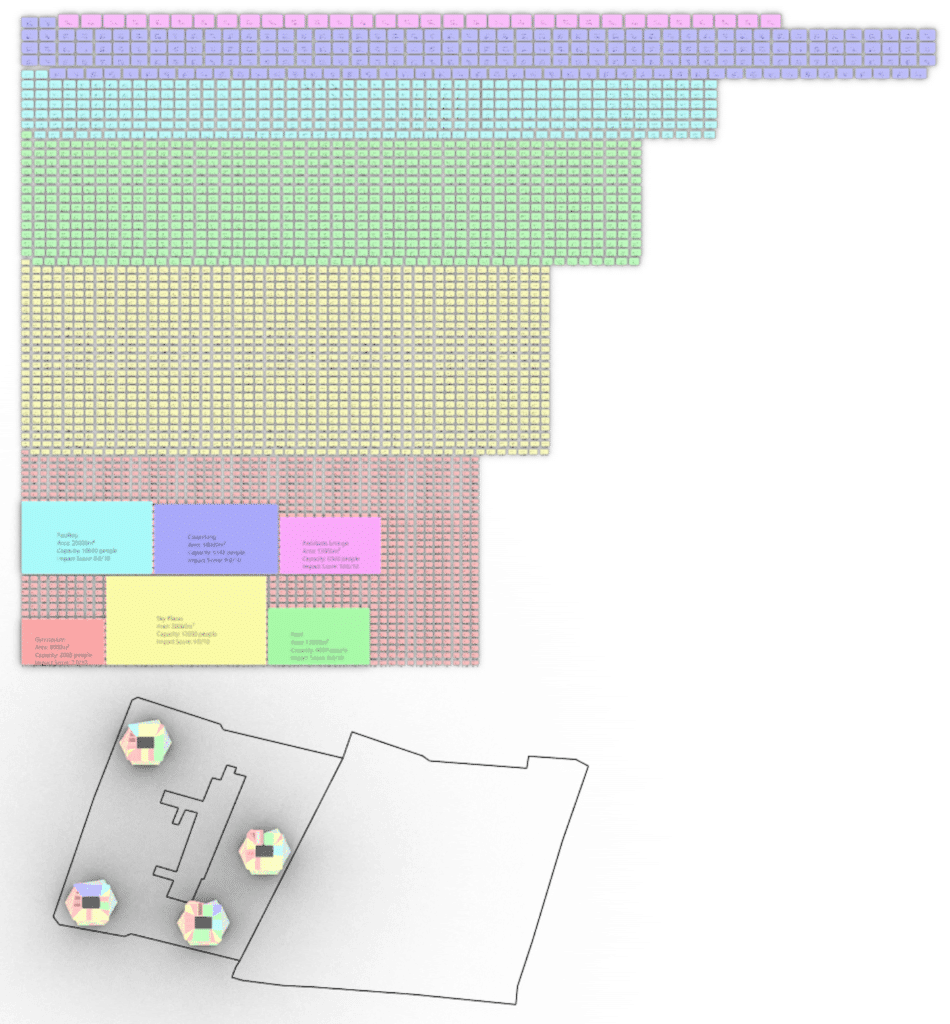
The program is analyzed based on spatial requirements and constraints by the required need for living. Based on this we establish a set of proportions and areas for a program that contains a target area of 350,000 meters square for living. In the adjacent diagram, the units are organized by their area and here we can see visually the proportions of the spaces that need to be placed in 4 towers.
Unit strategy placement based on metrics analysis
For direct sunlight hours
1- Units that are in shade will be the smaller units like studio and 1-bed
2- For sun lit units it will be the 2 to 4 bedrooms.
3- Penthouses have priority over the highest floors in all the towers
For views – levels of views
5 – views to landmarks Mount Fuji, Tokyo Bay, Tokyo tower, Tokyo Skytree
4 – > 4828 m unobstructed views but not to landmarks
3 – < 1500 m long distances before obstruction
2 – < 500 m medium distances
1 – < 50 m close range before obstruction
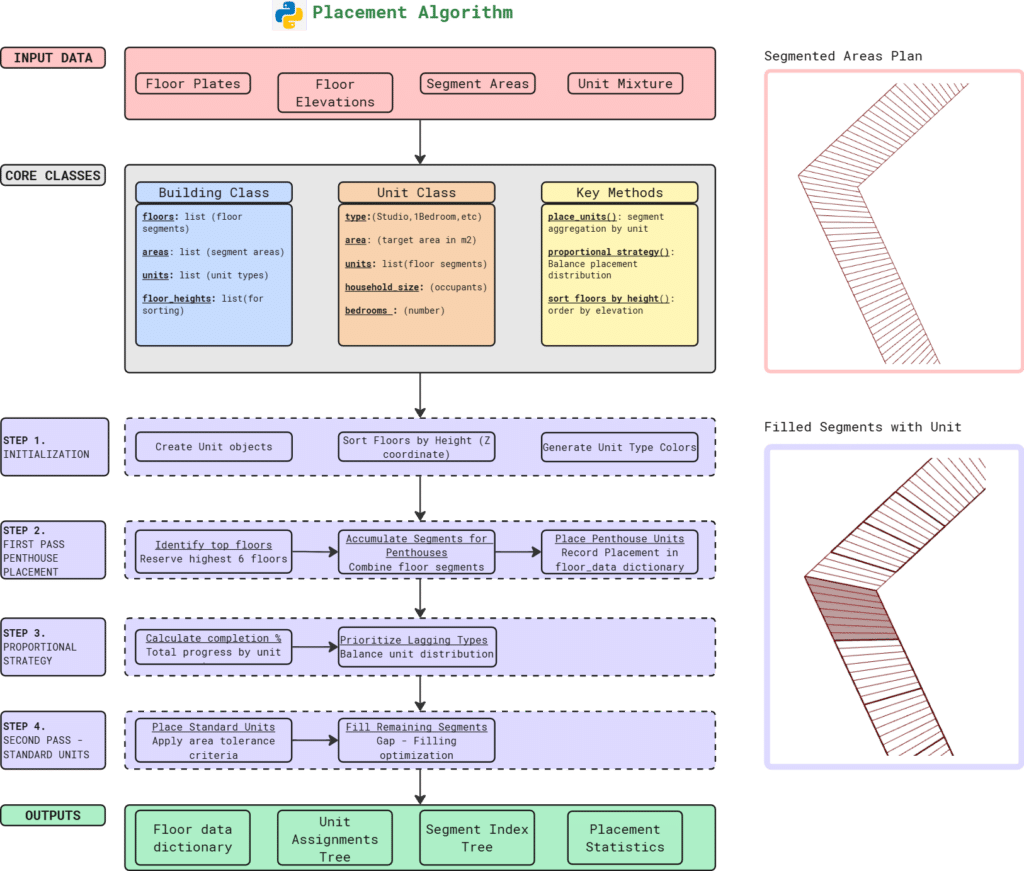
Placement Algorithm
An algorithm was developed using python that will attempt to maximize the placement of units to achieve their target counts while following a set of constraints and priorities. It is inspired by the Knapsack algorithm, that attempts to fill a Knapsack with elements of unique sizes until it is full. So in the case of the unit placement, the algorithm knows the area of the floor plate which is analogous to the knapsack and the area of the unit with is the unique element. The iterative process steps through each floor placing the unique elements until the floorplate area is filled or there is no longer space adequate for any unit. This allows automation of variety per floor yet following the unique constraints guided by the overall concept and priorities of the projects goal.
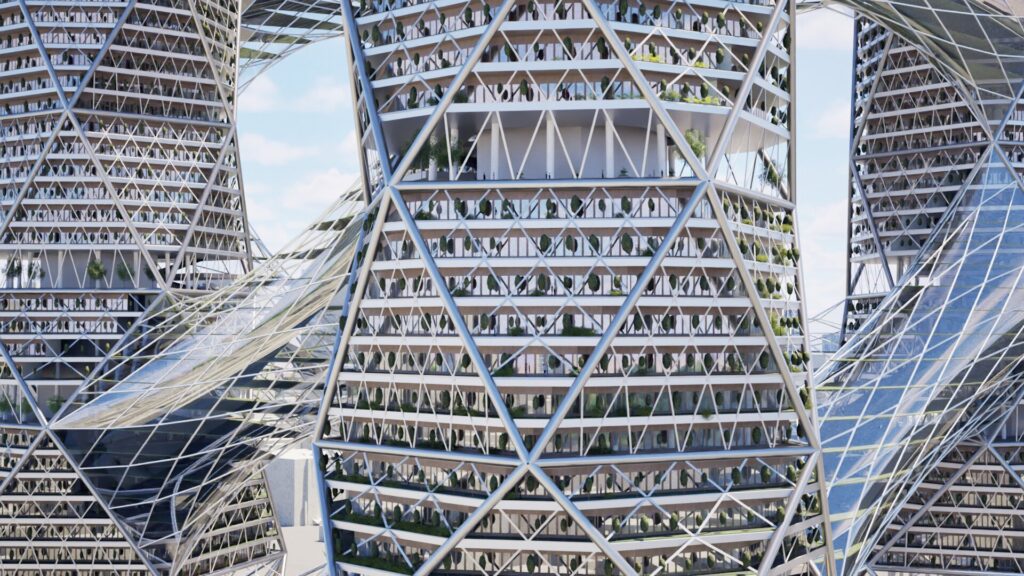
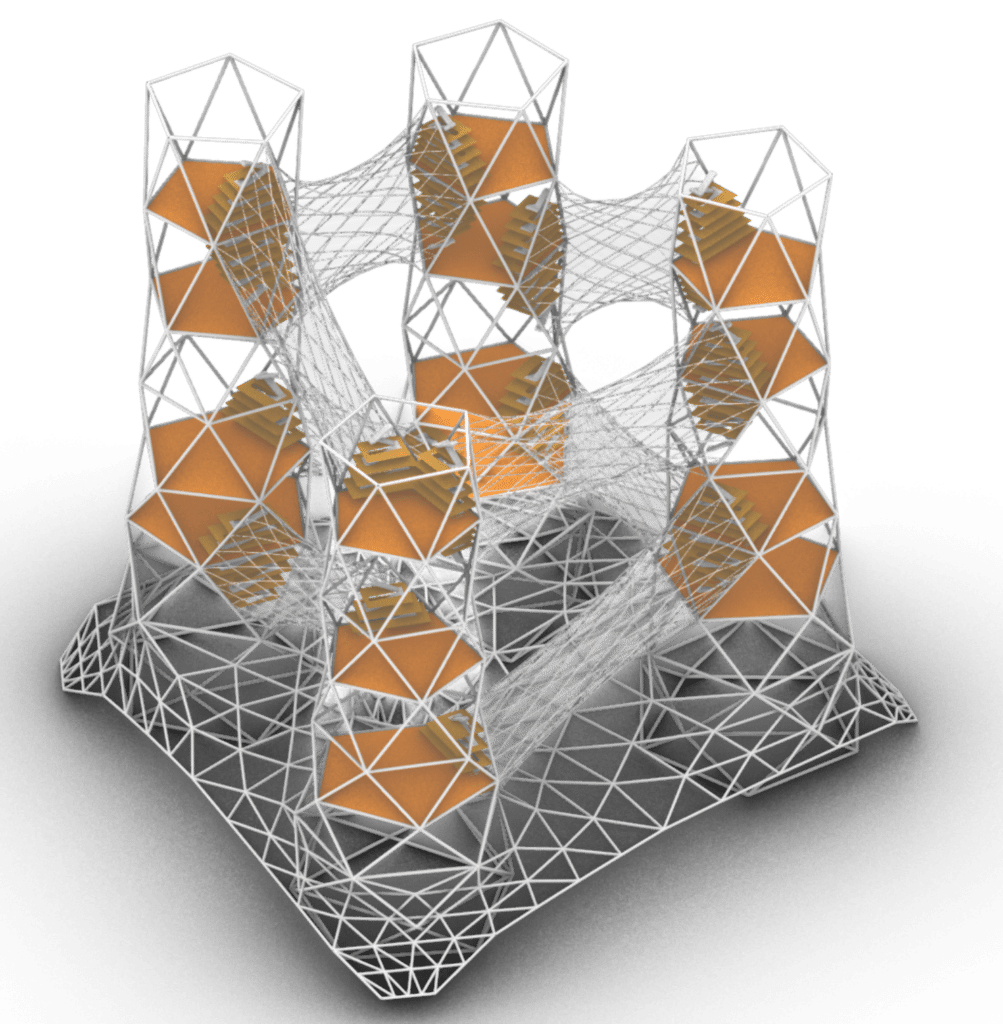
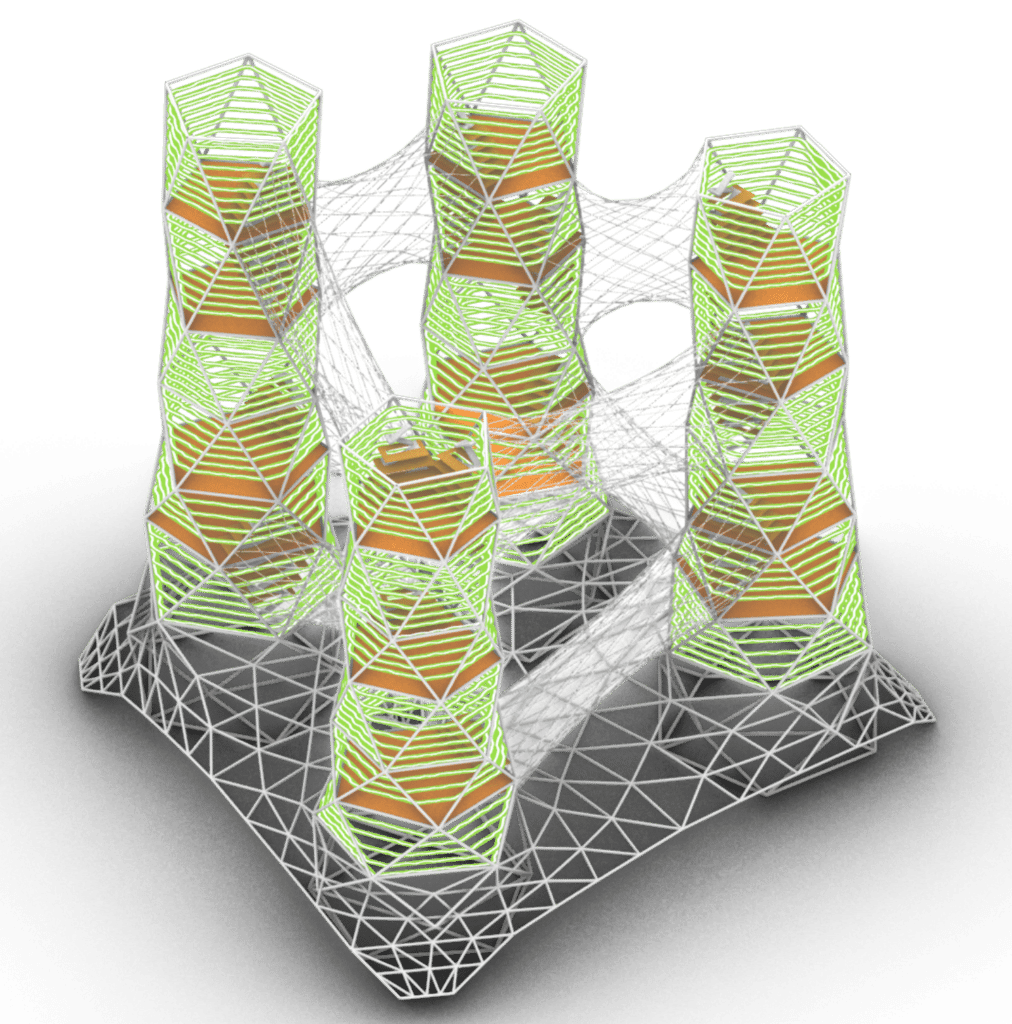
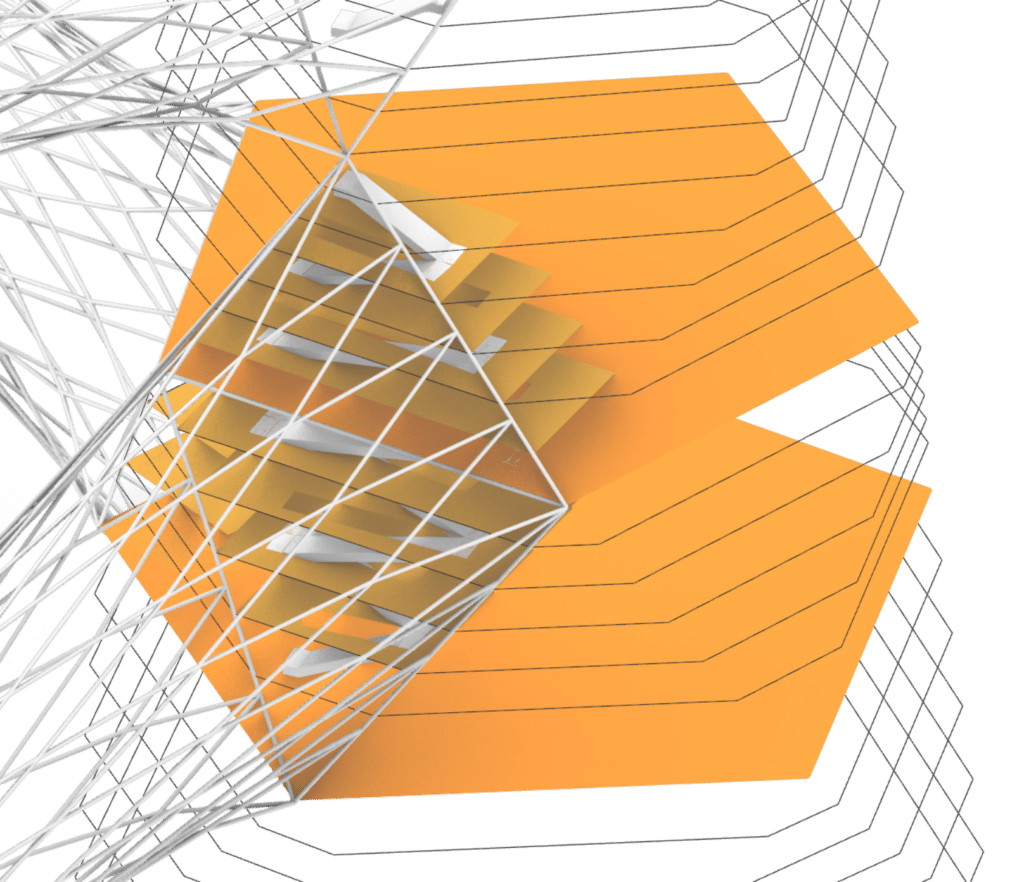
Data Curation – Evolved Tower Forms
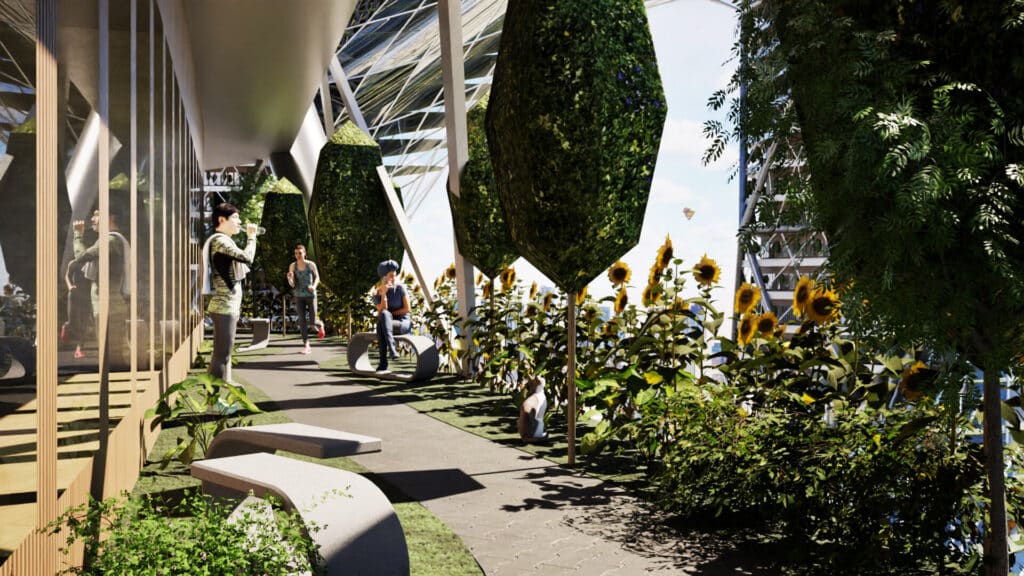
Once the data and units were generated, the next step was to curate the geometry and information to bring the design to life. This process included removing units located along the connection paths between bridges and towers and replacing them with vertical circulation cores. Spaces were allocated for amenities, garden walkways were introduced along the edges of each floorplate, and windows were added to improve unit livability.
These refinements collectively enhanced the efficiency, livability, and sustainability of the hyper-building environment. By optimizing circulation, integrating natural elements, and implementing daylighting strategies, the project elevated its architectural performance and fostered a more holistic, user-centered urban habitat.
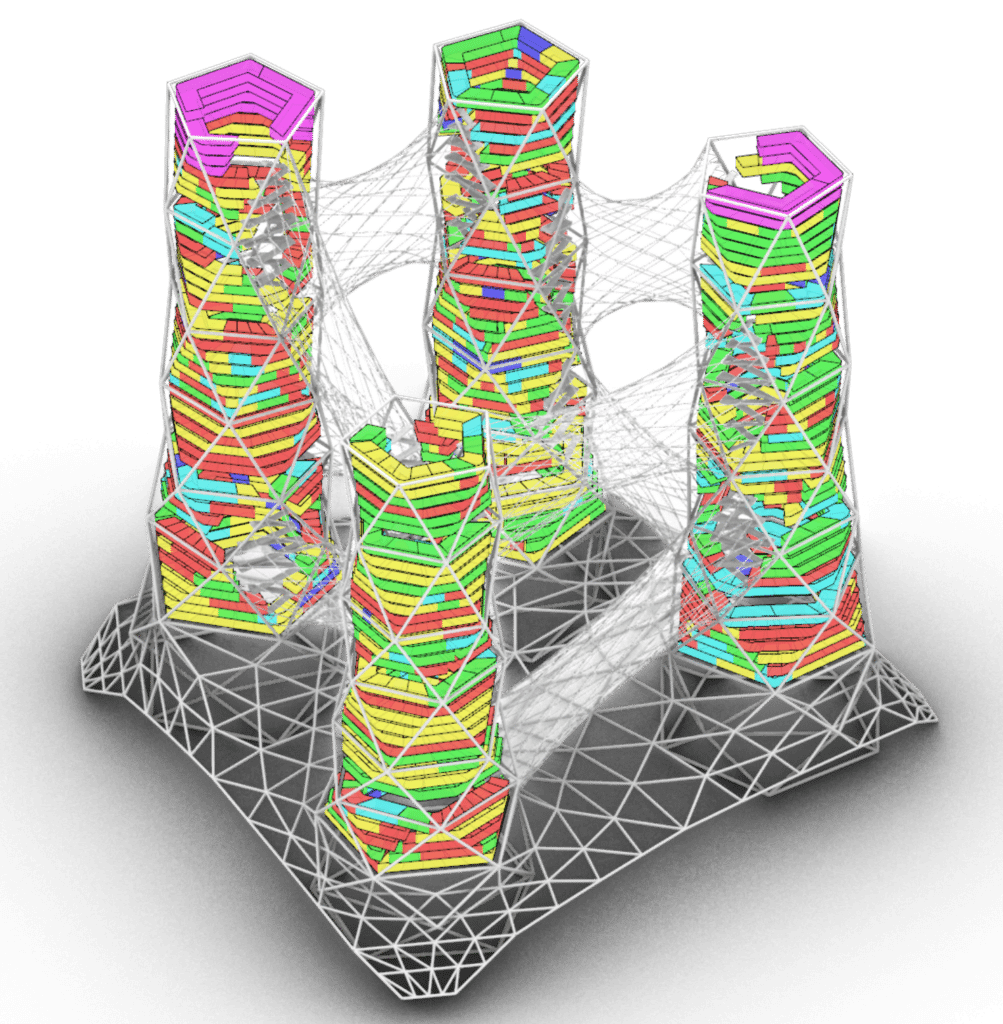
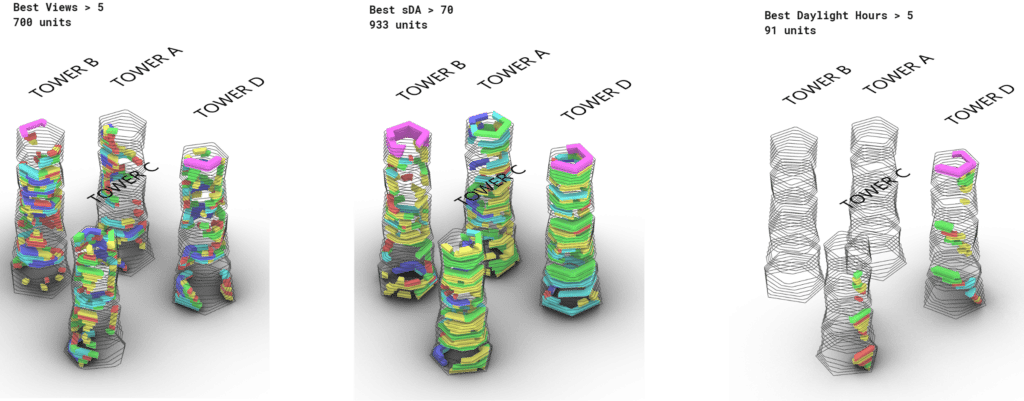
Data Curation – Best Apartments by Type \ Metrics
Metrics-Based Analysis and Identification of Optimal Apartment Units
The Data Curation process plays a crucial role in evaluating the performance of the building at a unit-by-unit level. By leveraging computational analysis and structured data organization, we can systematically assess each unit’s overall metric performance. This approach allows us to curate and categorize apartments based on (KPIs), helping to identify and highlight the best units according to specific criteria. By integrating data-driven insights into the design process, we can prioritize and refine unit configurations to optimize comfort, sustainability, and desirability. This methodology not only enhances the overall residential experience but also ensures that each apartment is tailored to meet specific user needs and environmental goals.