Brazil Vulnerability Cartography
Brazil, a vast and vibrant country, is renowned for its breathtaking landscapes from rolling highlands to expansive savannas. It’s known for iconic beaches and bustling urban centers where a dynamic blend of cultures and ethnicities come together. Its cities hum with energy, music, and art. Together, these diverse landscapes and rich social fabrics create a country of remarkable beauty, complexity, and cultural depth. Yet, amidst these vibrant landscapes and rich social fabrics, a stark contrast emerges: Brazil’s vulnerable communities.
Vulnerability in Brazil has manifested into communities known as “Favelas” and “Palafitas.” To better understand what conditions define these vulnerable communities; we interview 5 Brazilian locals, forming the base to our research:
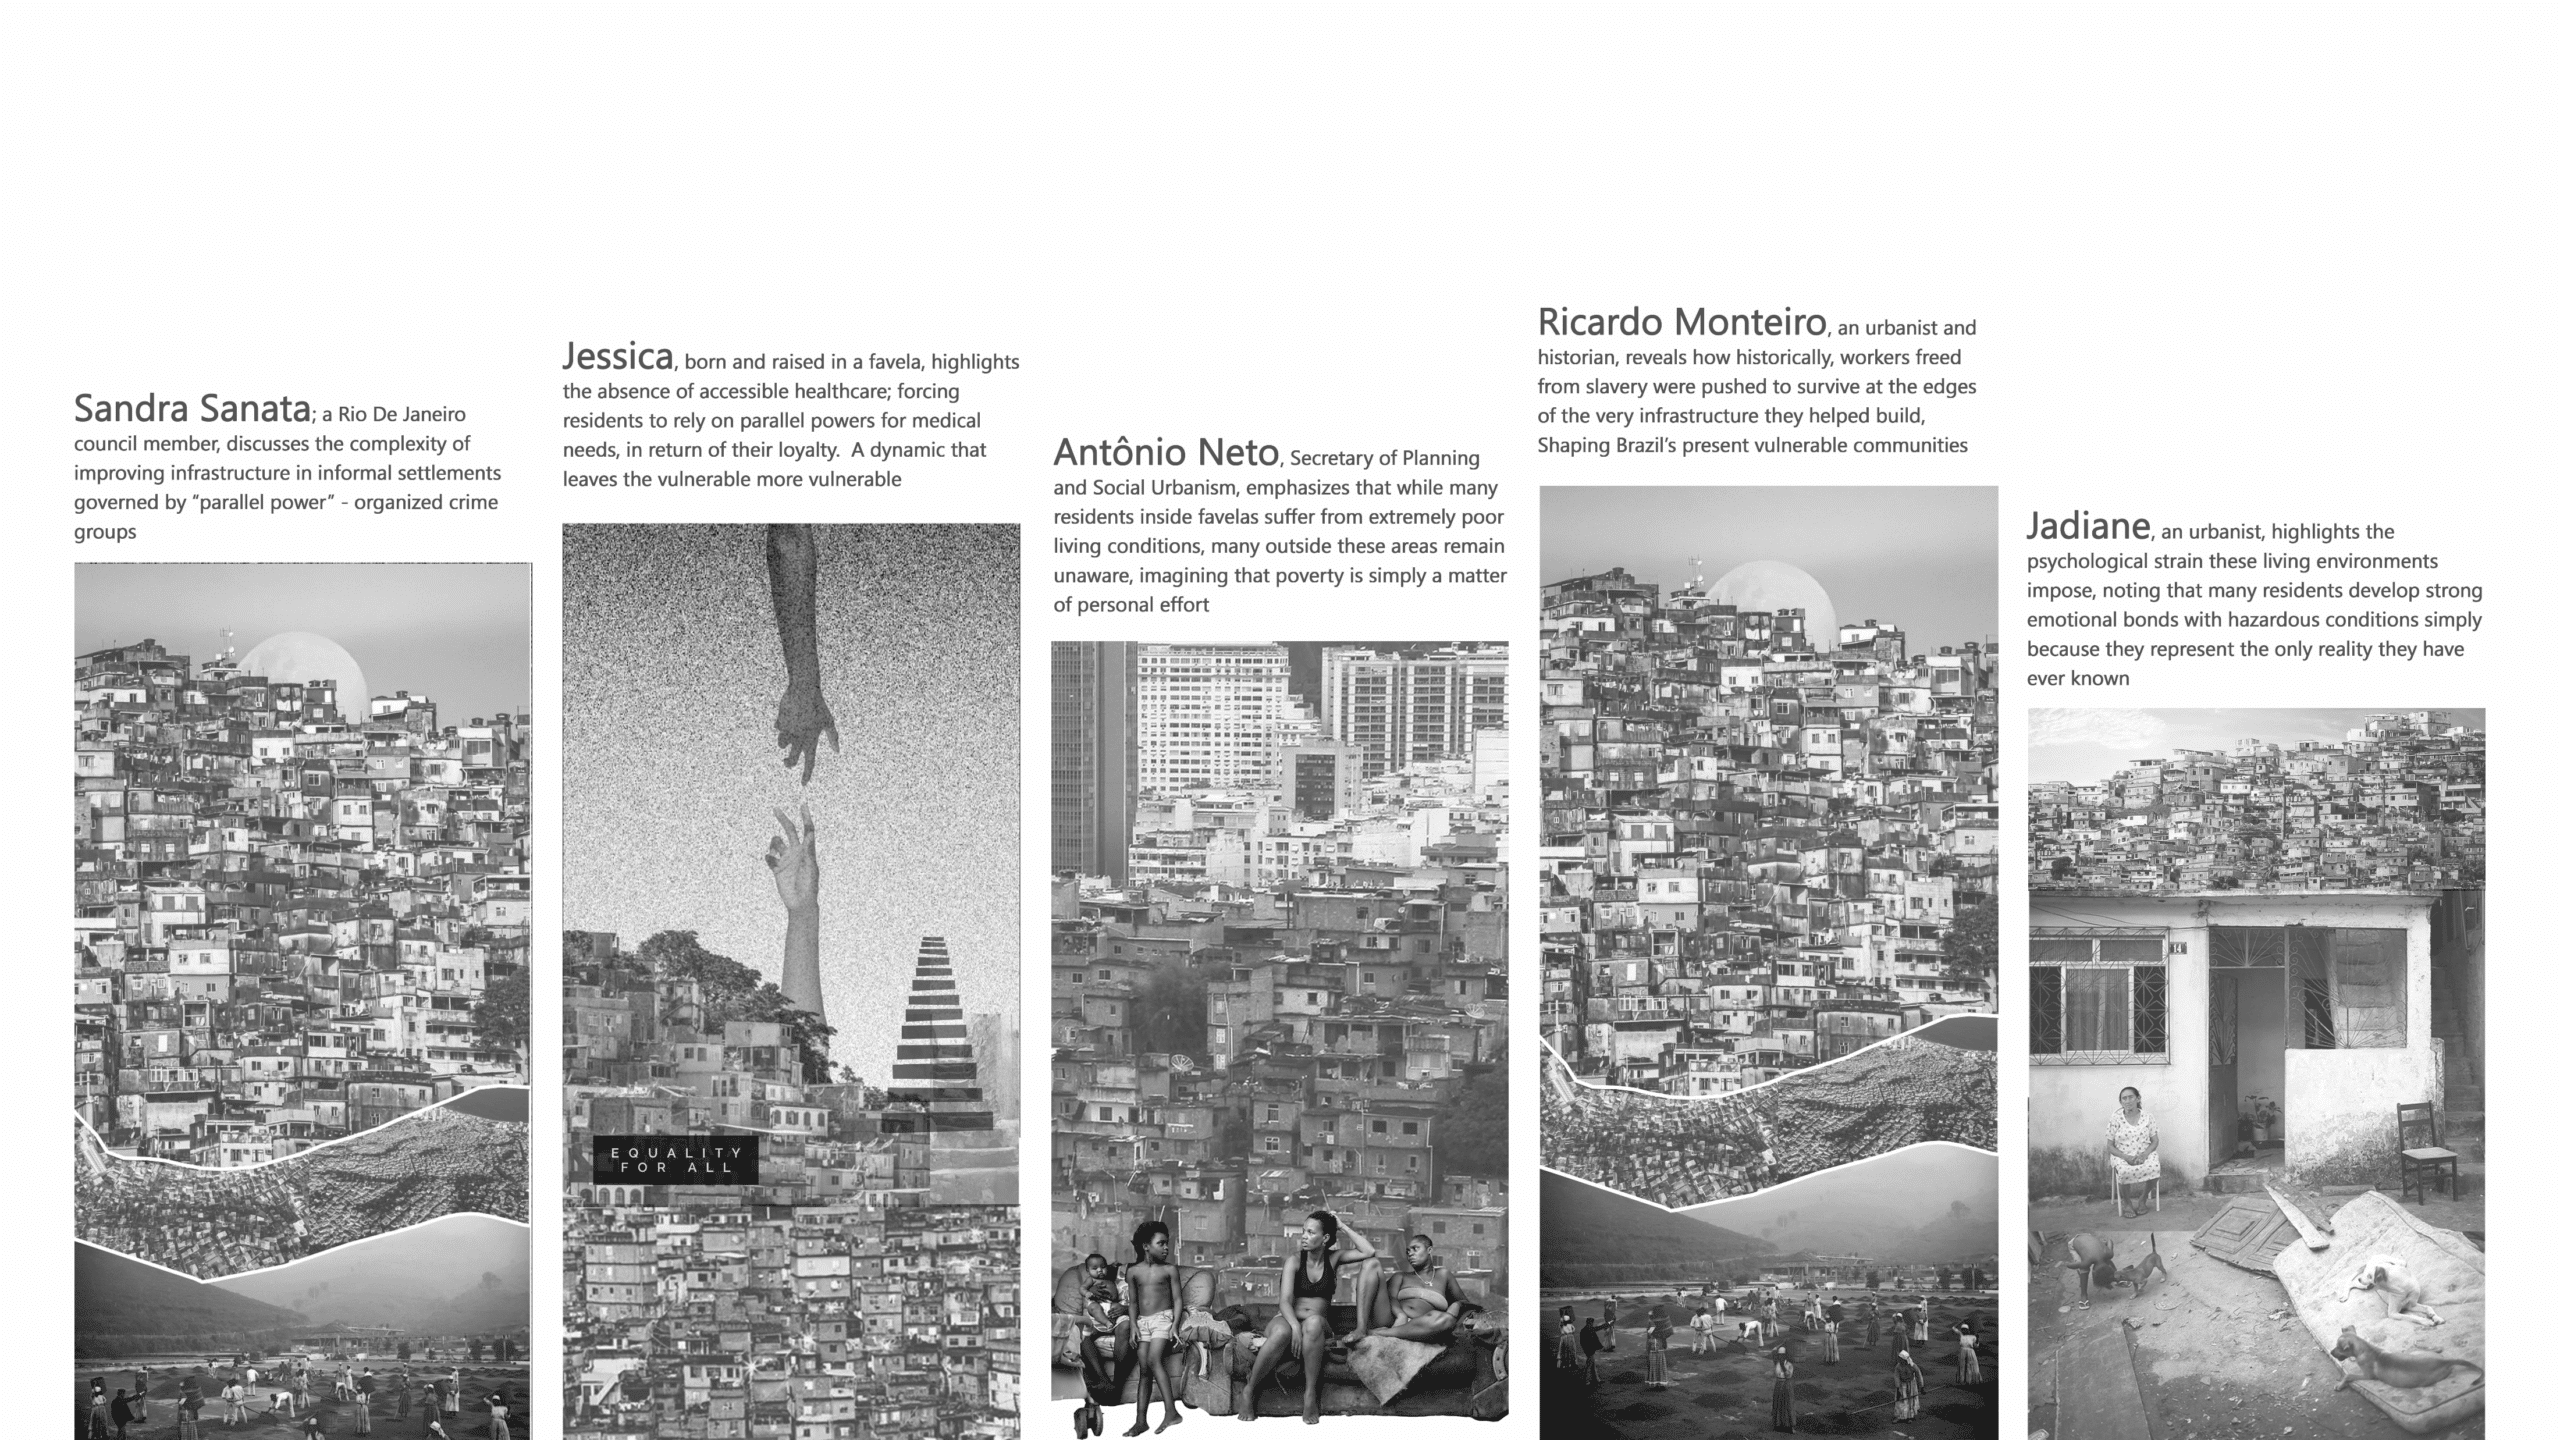
Mapping out keywords and topics of interest from these interviews, we see patterns and connections;
These patterns and connections all refer back to the same idea.

Vulnerable Groups are Marginalized?
These communities are disproportionately affected by social, economic, and spatial inequality. But when did this all start?

Before the first settlers and the beginning of society, a bare landscape with varying topography existed.
Flat landsform the majority of the coaston the eastern side, next to the Pacific Ocean. From there topography rises into steep mountains and hills. Moving west, these highlands flatten out again, acting as the base to the amazon forest.
Topography also shaped environment, giving life to Brazil’s 6 different Biomes. Mainly Amazon Biome, characterized by flat wetlands next to the Amazon River, and Mata Atlantica Biome, characterized by steep hillside rainforests, shape what would later become vulnerable areas, each with their own set of weaknesses.
The first division of Brazil; formed by the first settlers, shaped where slavery began and how vulnerability evolved from there.
In Phase 01, enslaved populations were concentrated along the narrow flatlands next to the Pacific, where trade was at an all-time high. The enslaved lived on their owner’s land, entirely controlled, while surrounding hills remained empty.
In Phase 02, after abolition, freed people were left without land, income, or support, forcing them to settle on the peripheries of cities and along steep mountainsides where land was unclaimed, neglected, or unwanted, as previously mentioned by Ricardo. They marked the beginning of Brazil’s first vulnerable communities. As they expanded uphill, deforestation of Mata Atlântica increased. Known as “Favelas”, these communities are now at high risk of catastrophic landslidesdue to the deforestation, and as Jessica has said, leaving the vulnerable more vulnerable.
In Phase 03, these informal settlements expanded further upward into the mountains, across Brazil and into low low lands next to the Amazon Rivers. Known as the “Palafitas”, this new typology is at risk of catastrophic floods, once again making the vulnerable more vulnerable.
When the State is Absent, Vulnerability Grows?
What informal settlements reveal about Brazil?
Over the last decades, Brazil has seen a fast expansion of informal settlements, from favelas to palafitas, the stilt houses built over water. This is often discussed as a housing or planning issue, but it also reveals something bigger: what happens when the state is not present.
When people do not have access to proper housing, infrastructure, services, or safety, they still need to survive. They build their own solutions. But the absence of the state also creates space for other forces to step in. In many territories, parallel powers emerge and start shaping everyday life.
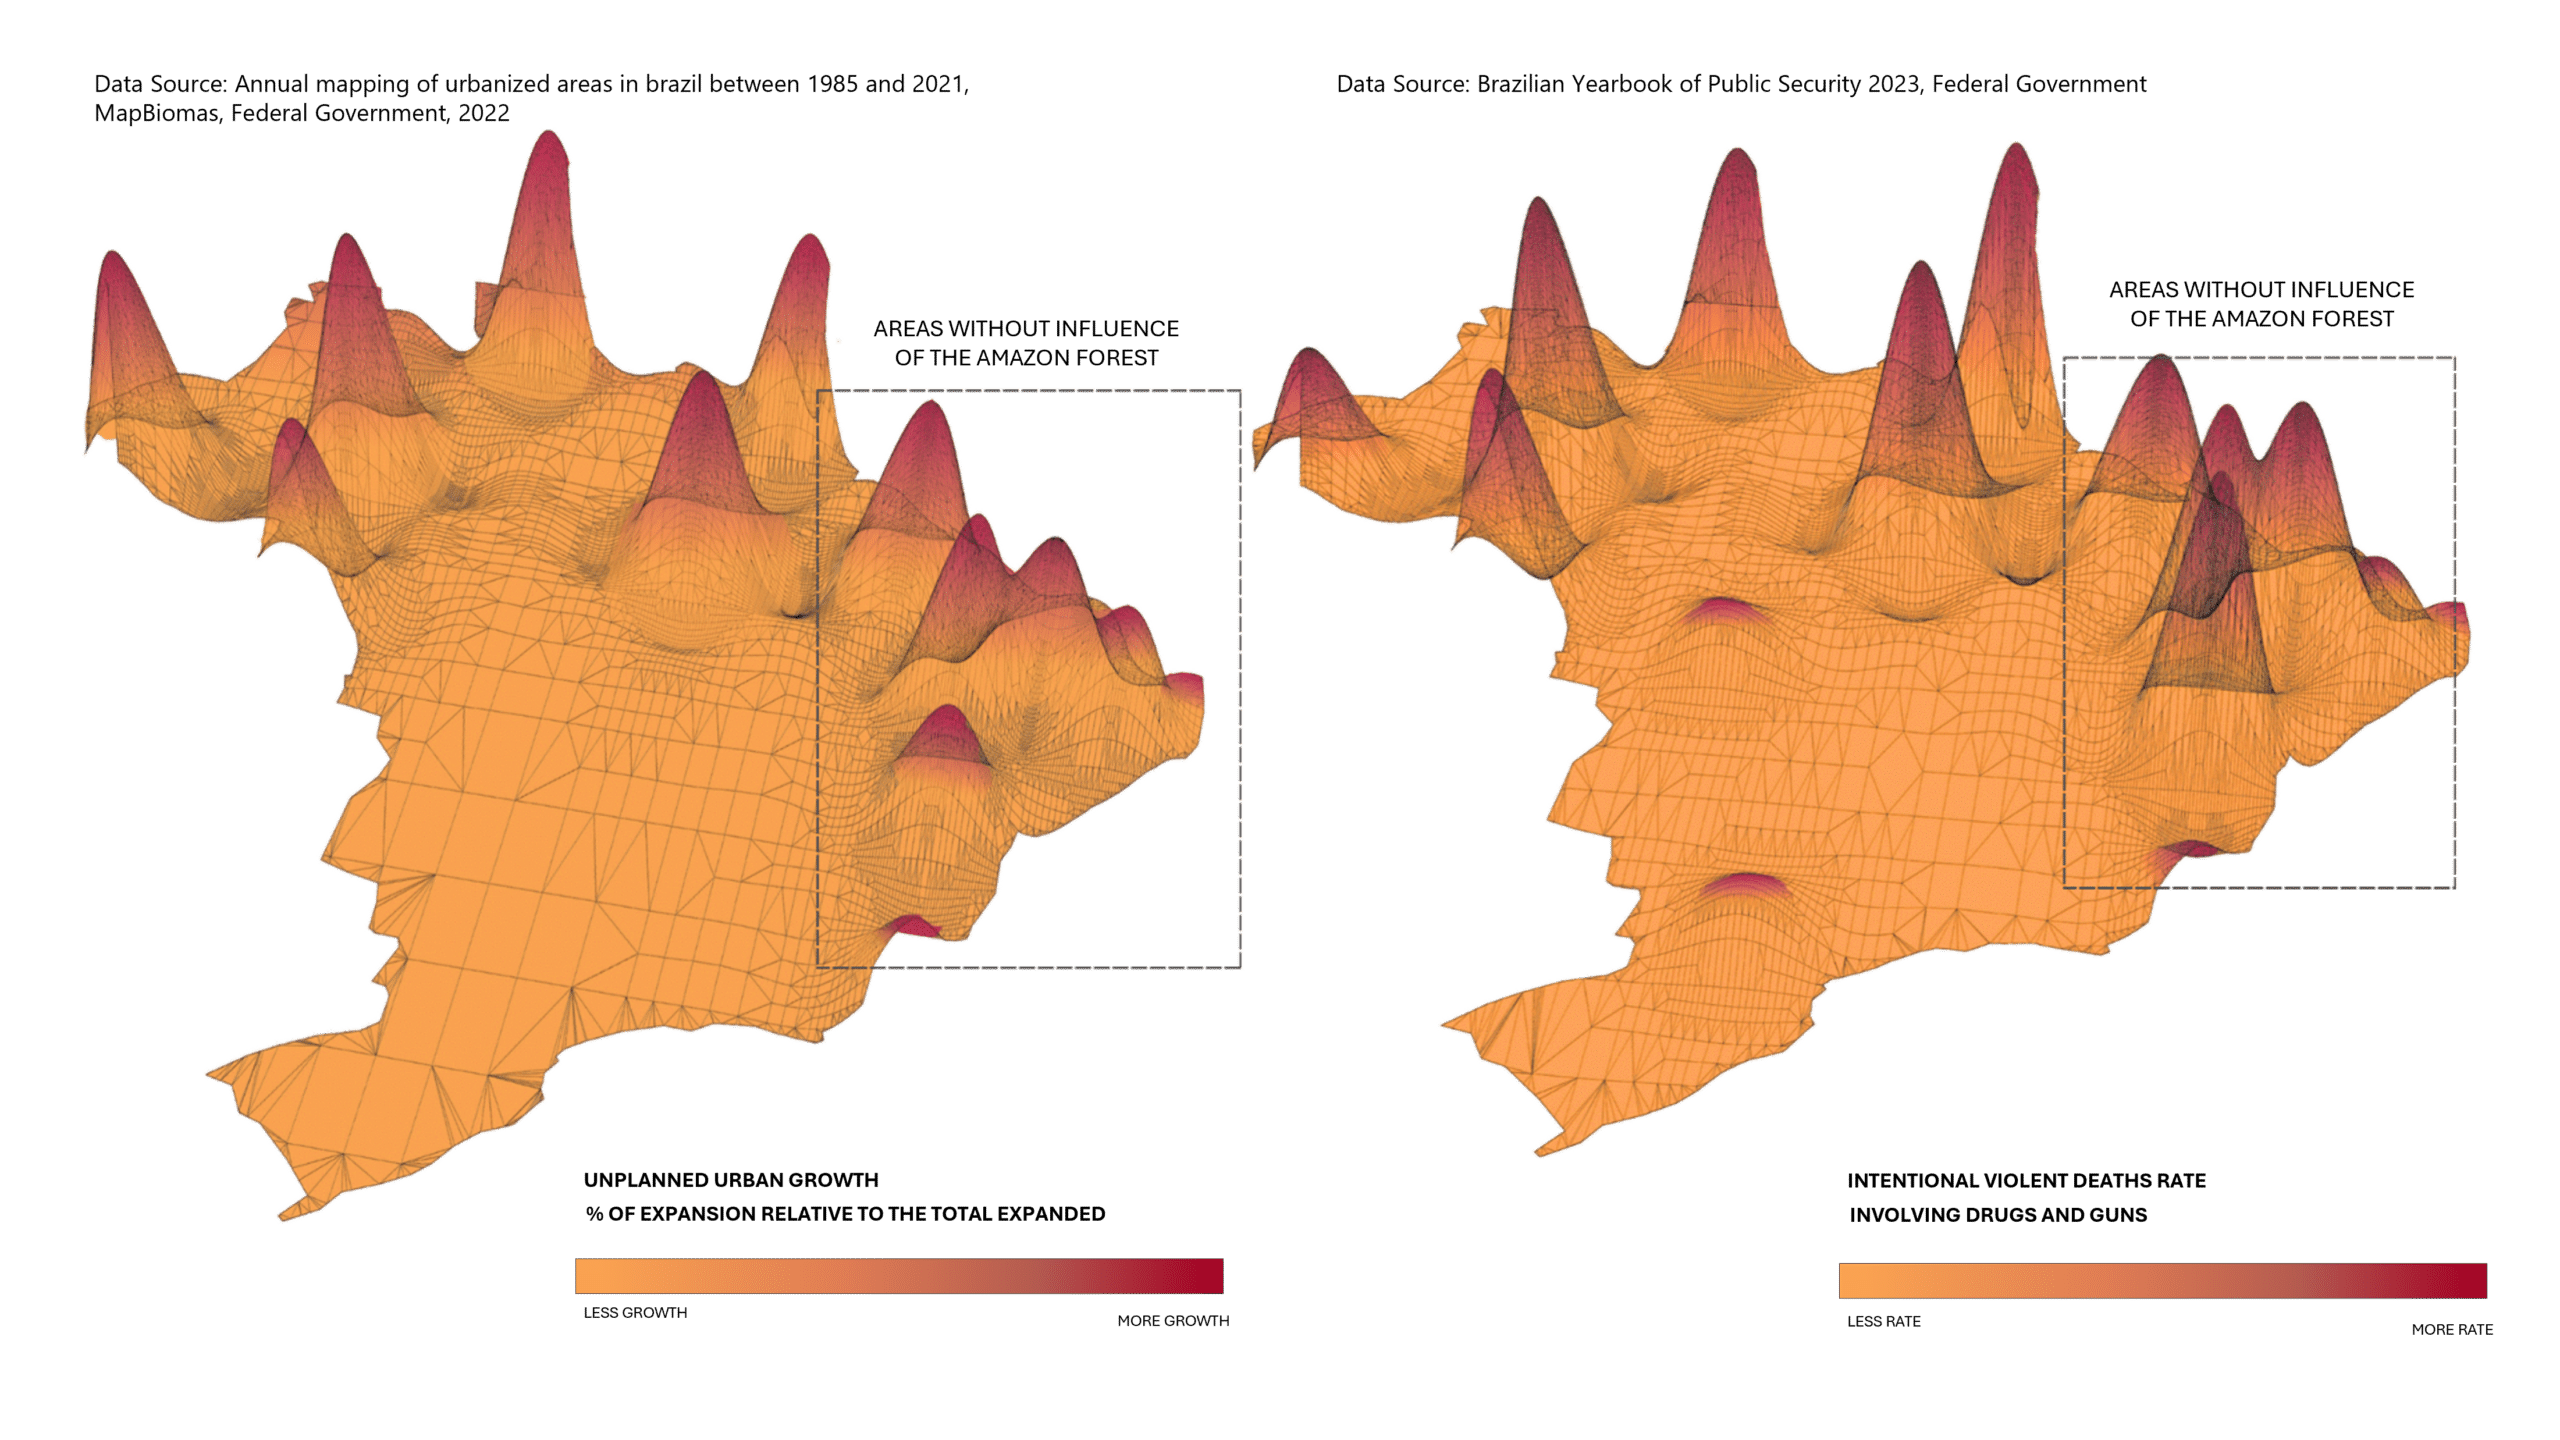
We analyzed a map that compares two trends: the expansion of irregular occupations and the concentration of firearm-related homicides. What we found was striking. Areas where irregular settlements expand the most often overlap with areas that show higher homicide rates.
This does not mean one causes the other automatically. But it suggests that organized criminal groups may be growing in the same places where vulnerability is increasing, especially in neighborhoods where public protection and public services are weak.
It raises an important question:
How much of urban insecurity is actually linked to vulnerability and to the gaps left by the state?
Brazil has a Vulnerability Atlas, but …
To be fair, the Brazilian federal government does recognize that social vulnerability is increasing across the country. That is why it created a Federal Vulnerability Atlas. It is an important initiative, but it also has limitations that make it difficult to use for local decision-making. The atlas looks at municipalities, but not inside cities.
The atlas only classifies vulnerability at the level of states and municipalities. But cities are not uniform. A municipality can look average on paper while still having neighborhoods living under extreme vulnerability. That internal reality is exactly what matters when local governments are trying to design policies that actually work.
Some Cities Not Appear
Another problem is data availability. Many municipalities do not have enough data to be classified at all. As a result, some cities are simply left out. The city where I was born, for example, has no classification in the atlas. It is like the city does not exist in the data.
Indicators Are Complex and Outdated
There is also the issue of time. The indicators used are complex, and many of them rely heavily on older census data. In practice, this means the atlas often does not reflect what is happening now. And in vulnerable territories, things can change very quickly.
Why our Collaborative Research?
We are combining quantitative data analysis with qualitative interviews and local field knowledge. Based on what we have seen so far, we identified seven major groups of factors that can either increase or reduce vulnerability. But what matters most is not only listing factors. It is understanding that vulnerability looks different depending on the context.
Approach: Adapts to Each City
Our proposal is to apply the AHP methodology, Analytic Hierarchy Process, to these seven factors, but with a key improvement. We connect the model to local context and local priorities.
Because vulnerability is not the same everywhere.
In some Brazilian cities, crime and violence may be the main driver. In others, vulnerability may be more connected to environmental risks such as floods, landslides, or topographic challenges. So instead of forcing every city into the same model, we want a system that can adapt and ask a simple question: what matters most in this specific city?
Testing 8 Cities – Prototype
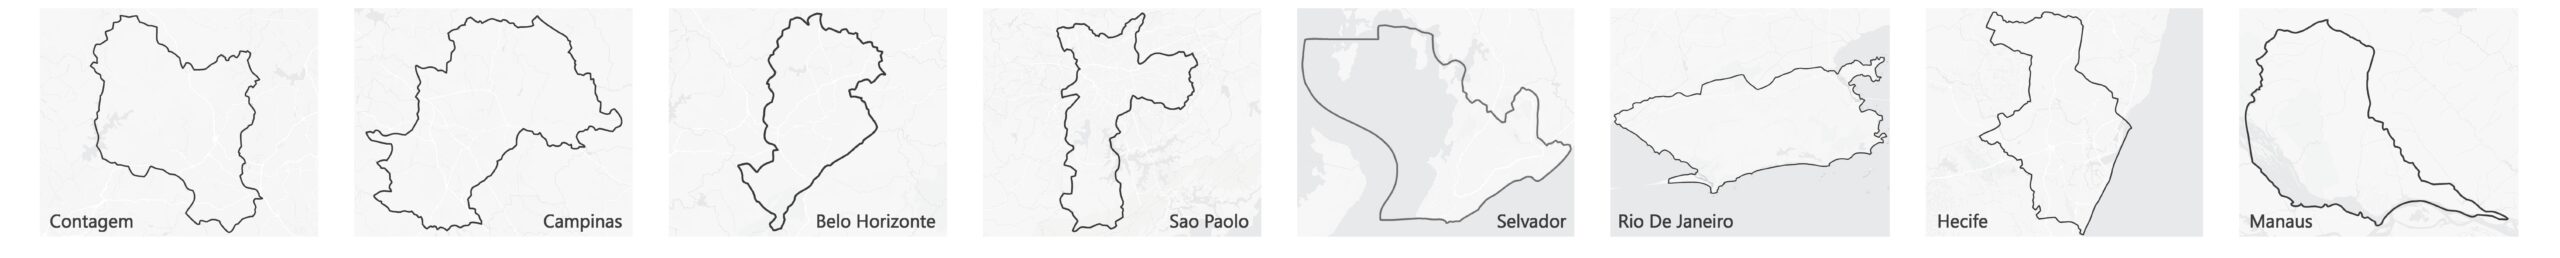
We built a prototype for eight Brazilian cities.
- Contagem , MG
- Campinas, SP
- Belo Horizonte, MG
- São Paulo, SP
- Salvador, BA
- Rio de Janeiro, RJ
- Recife, PE
- Manaus, AM
Six of them are state capitals, but very different ones. We also included one small city and one medium-sized city. The goal was to challenge the model and see if it could capture vulnerability patterns across very different realities.
Two cities, two completely different realities: Rio de Janeiro x Contagem
For this presentation, we chose two cities to explore in more detail because they are almost opposites.
Rio de Janeiro is around six times larger than Contagem. It is one of Brazil’s most important cities for port-related exports, and it is also a former national capital, shaped by a unique political and urban history.
Contagem, on the other hand, is a smaller city with strong links to mining and industrial activity. In recent years, it has also experienced a growth of informal settlements, especially in peripheral areas near mining operations.
These cities are so different, both are experiencing vulnerability, but for different reasons and with different consequences.
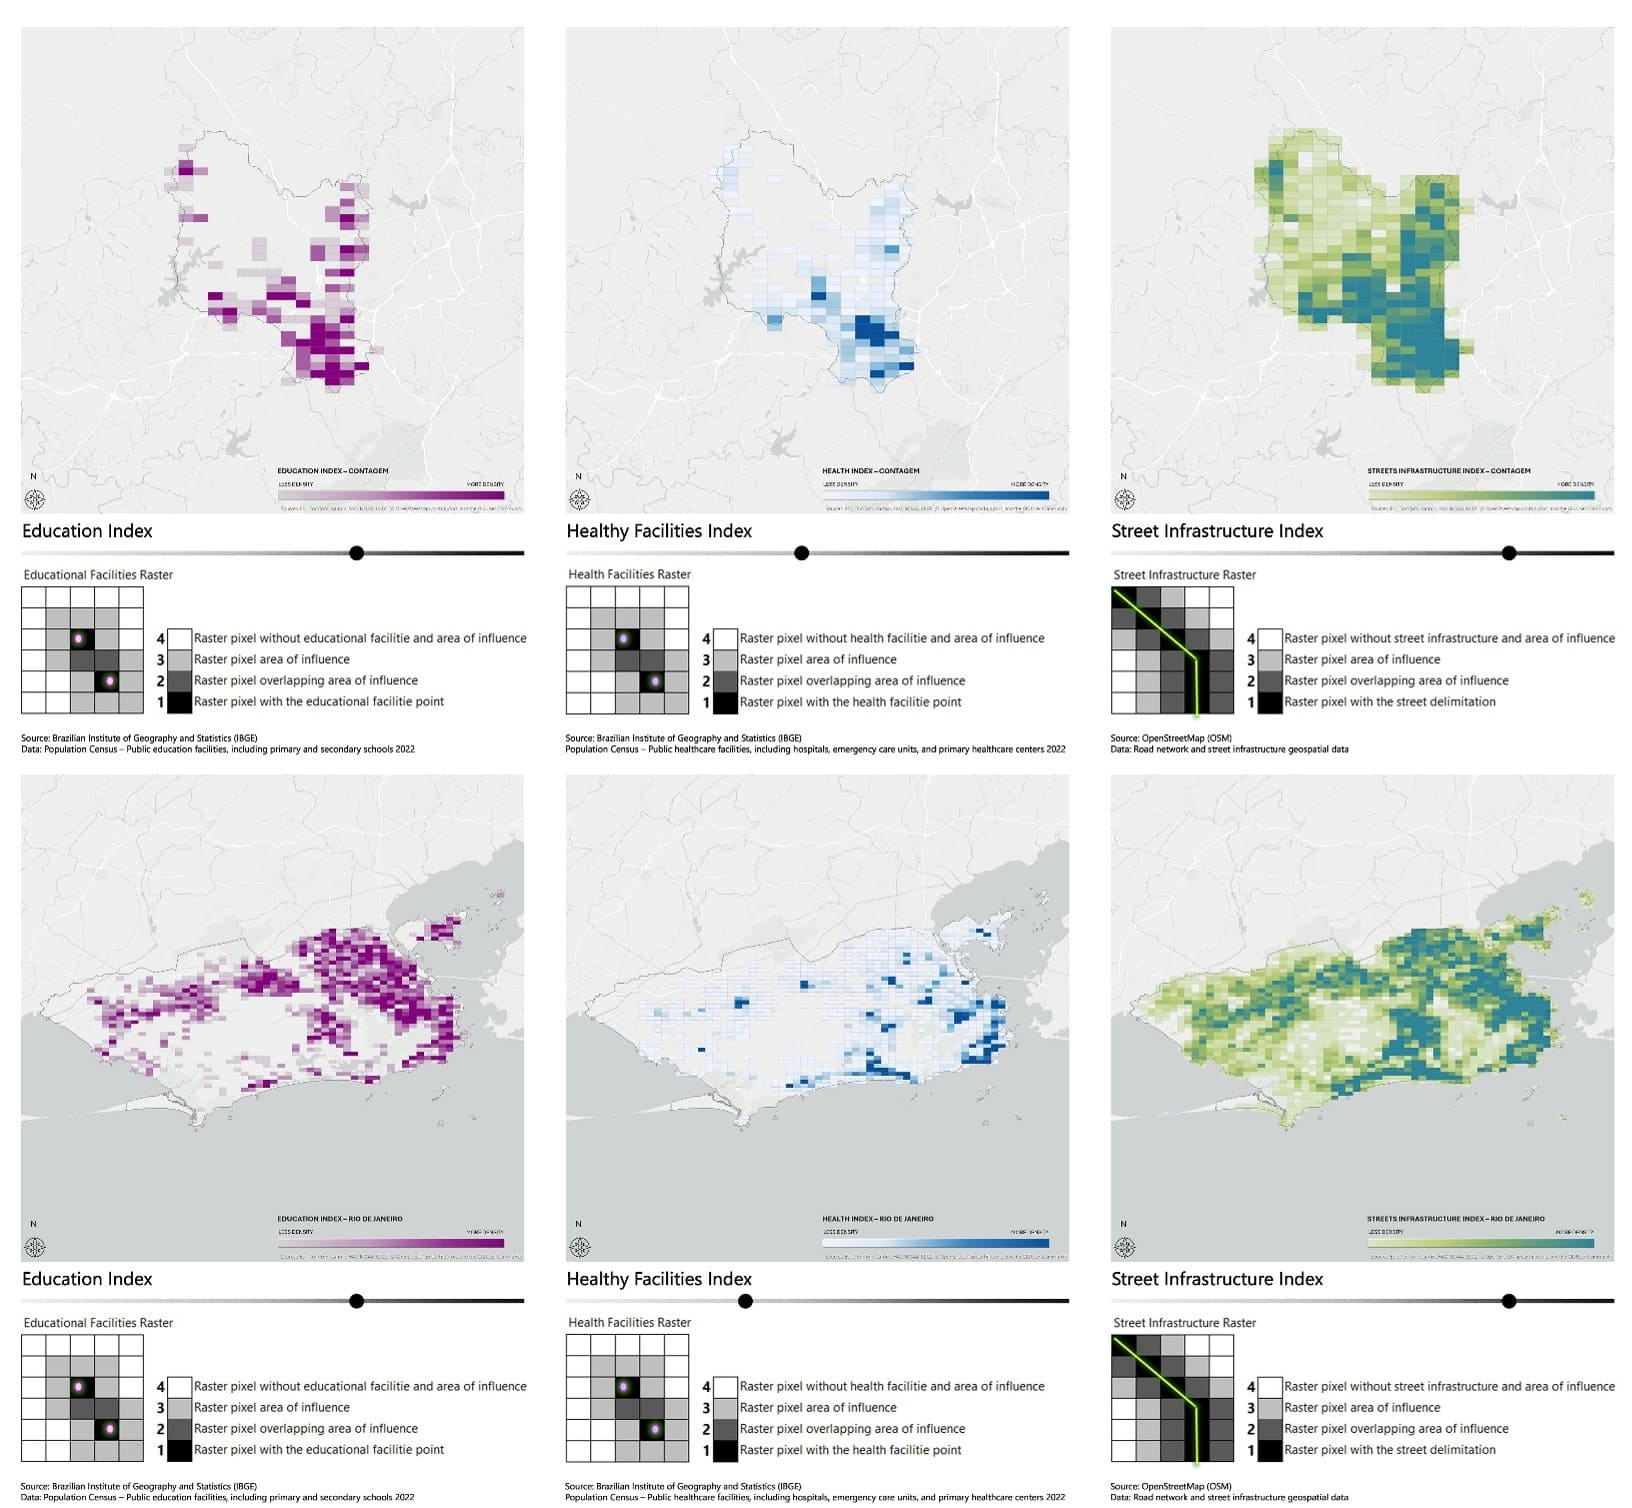
What are the Vulnerability Factors – Index
Based on the interviews and qualitative data analyzed, we conclude that vulnerable cities typically share a set of factors that influence increases or decrease their level of vulnerability, let’s check how they behave differently in Rio de Janeiro and in Contagem.
Positive Factors – Decrease Vulnerability
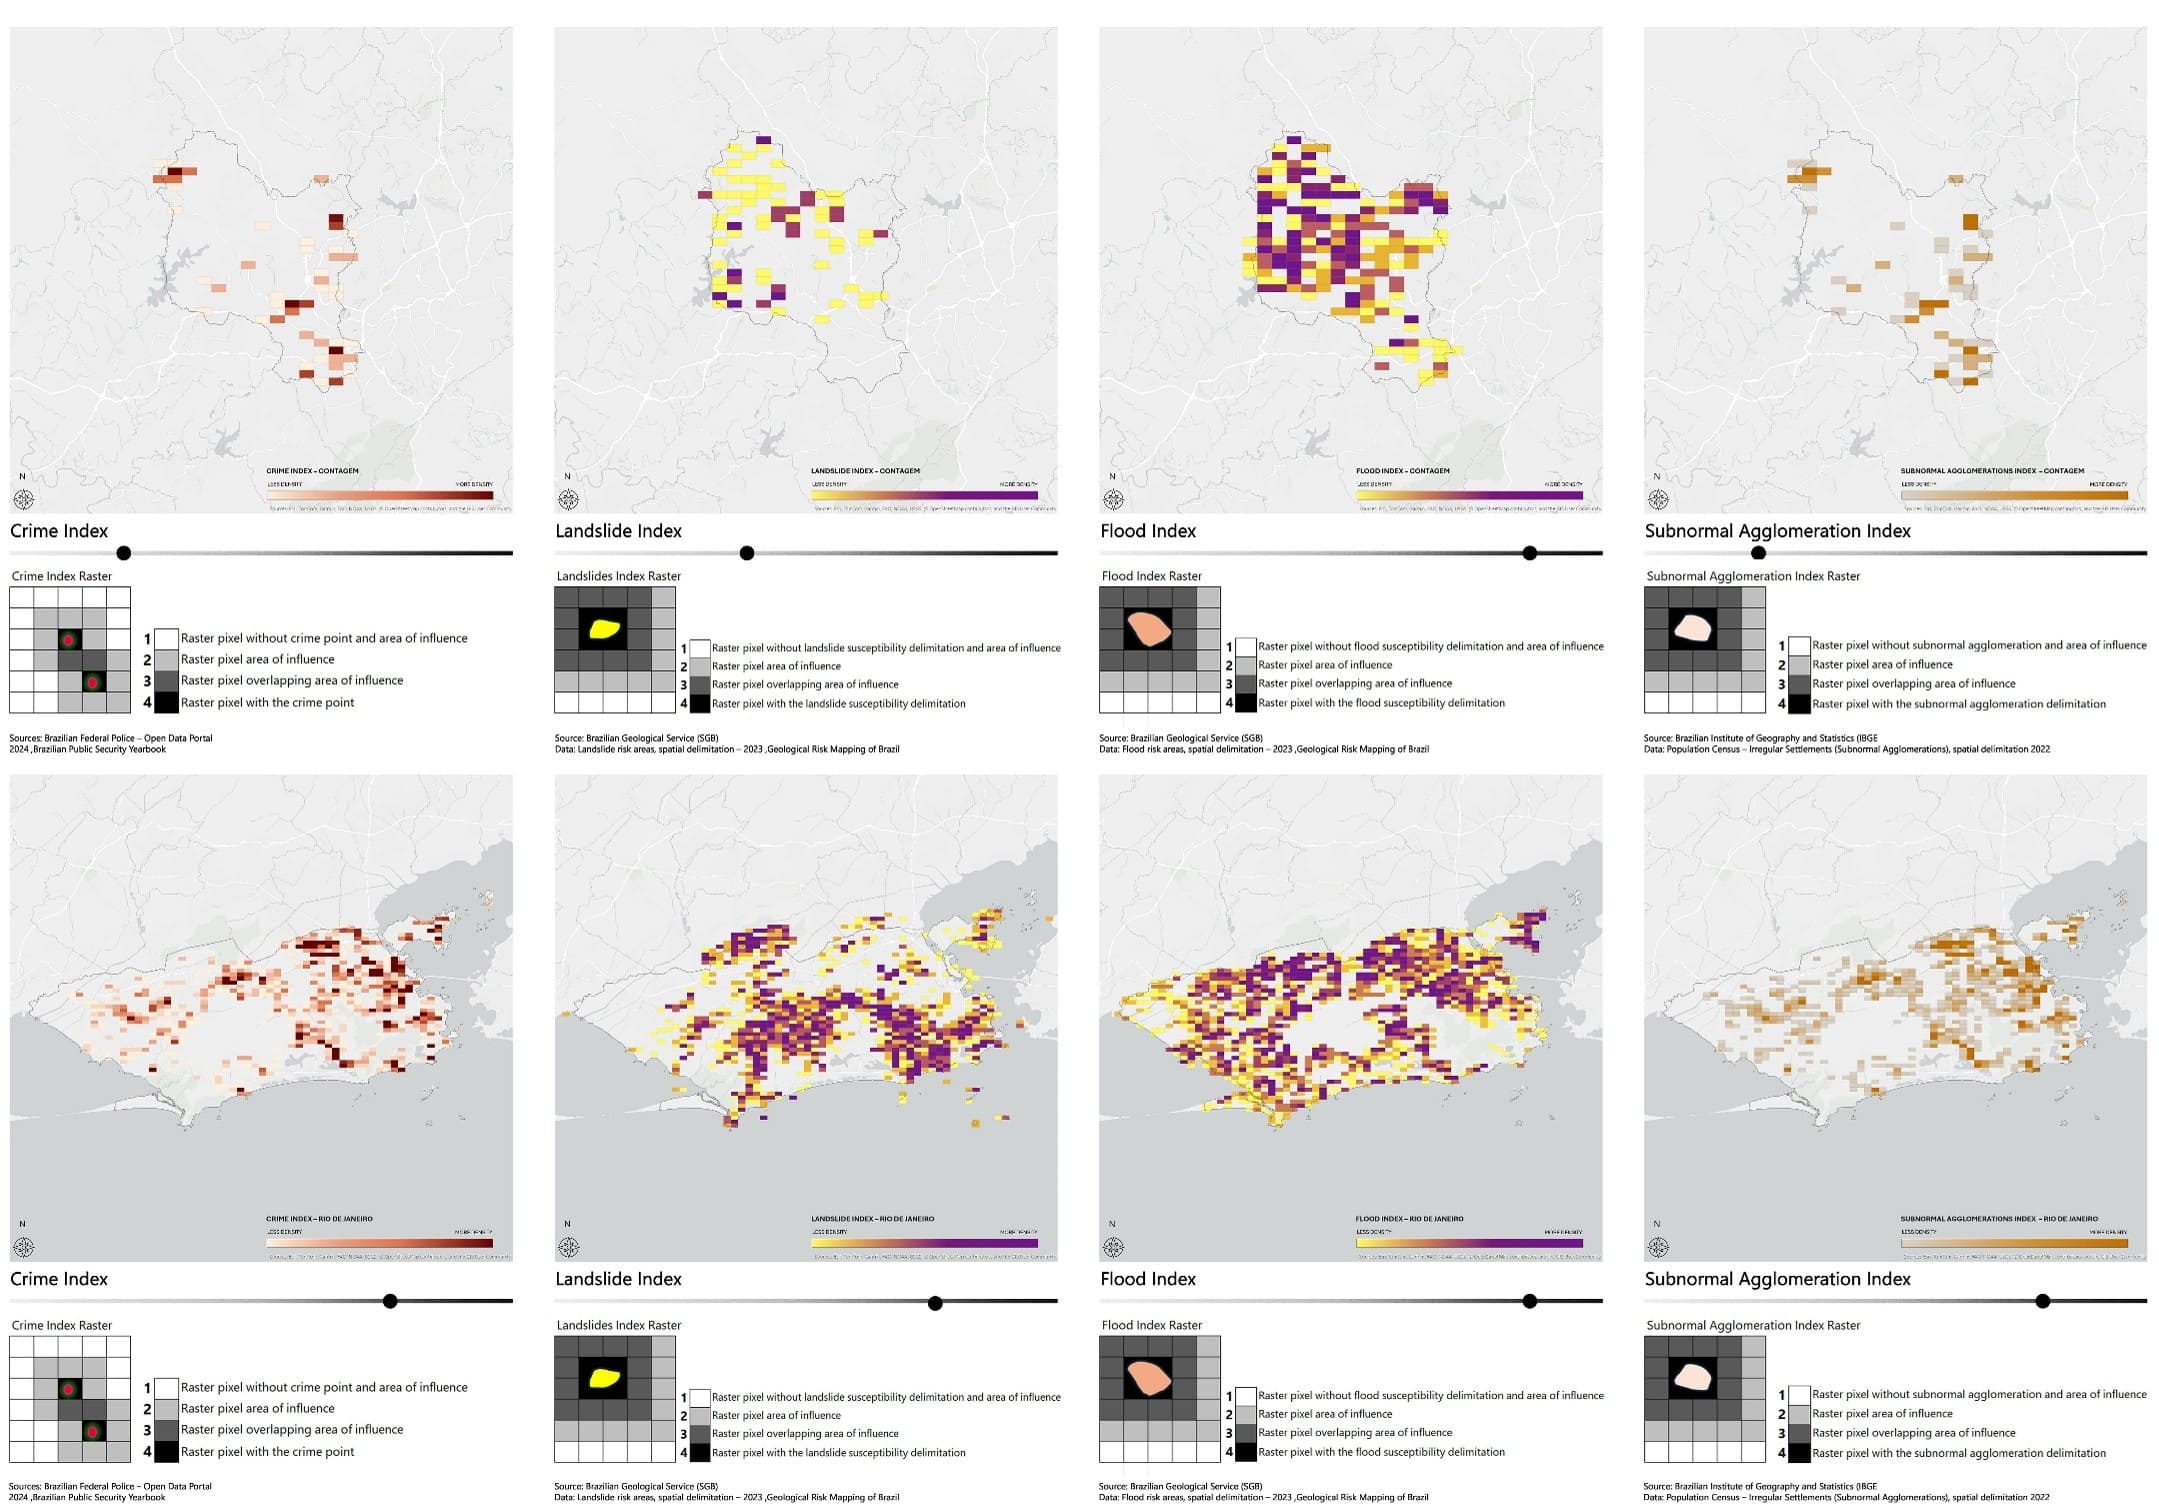
Negative Factors – Increase Vulnerability
AHP in Practice
The multi-criteria decision-making technique known as the Analytic Hierarchy Process (AHP), developed by Thomas L. Saaty in the 1970s, is an approach that involves multiple-criteria analysis to systematically structure the inherent complexity of decision-making.
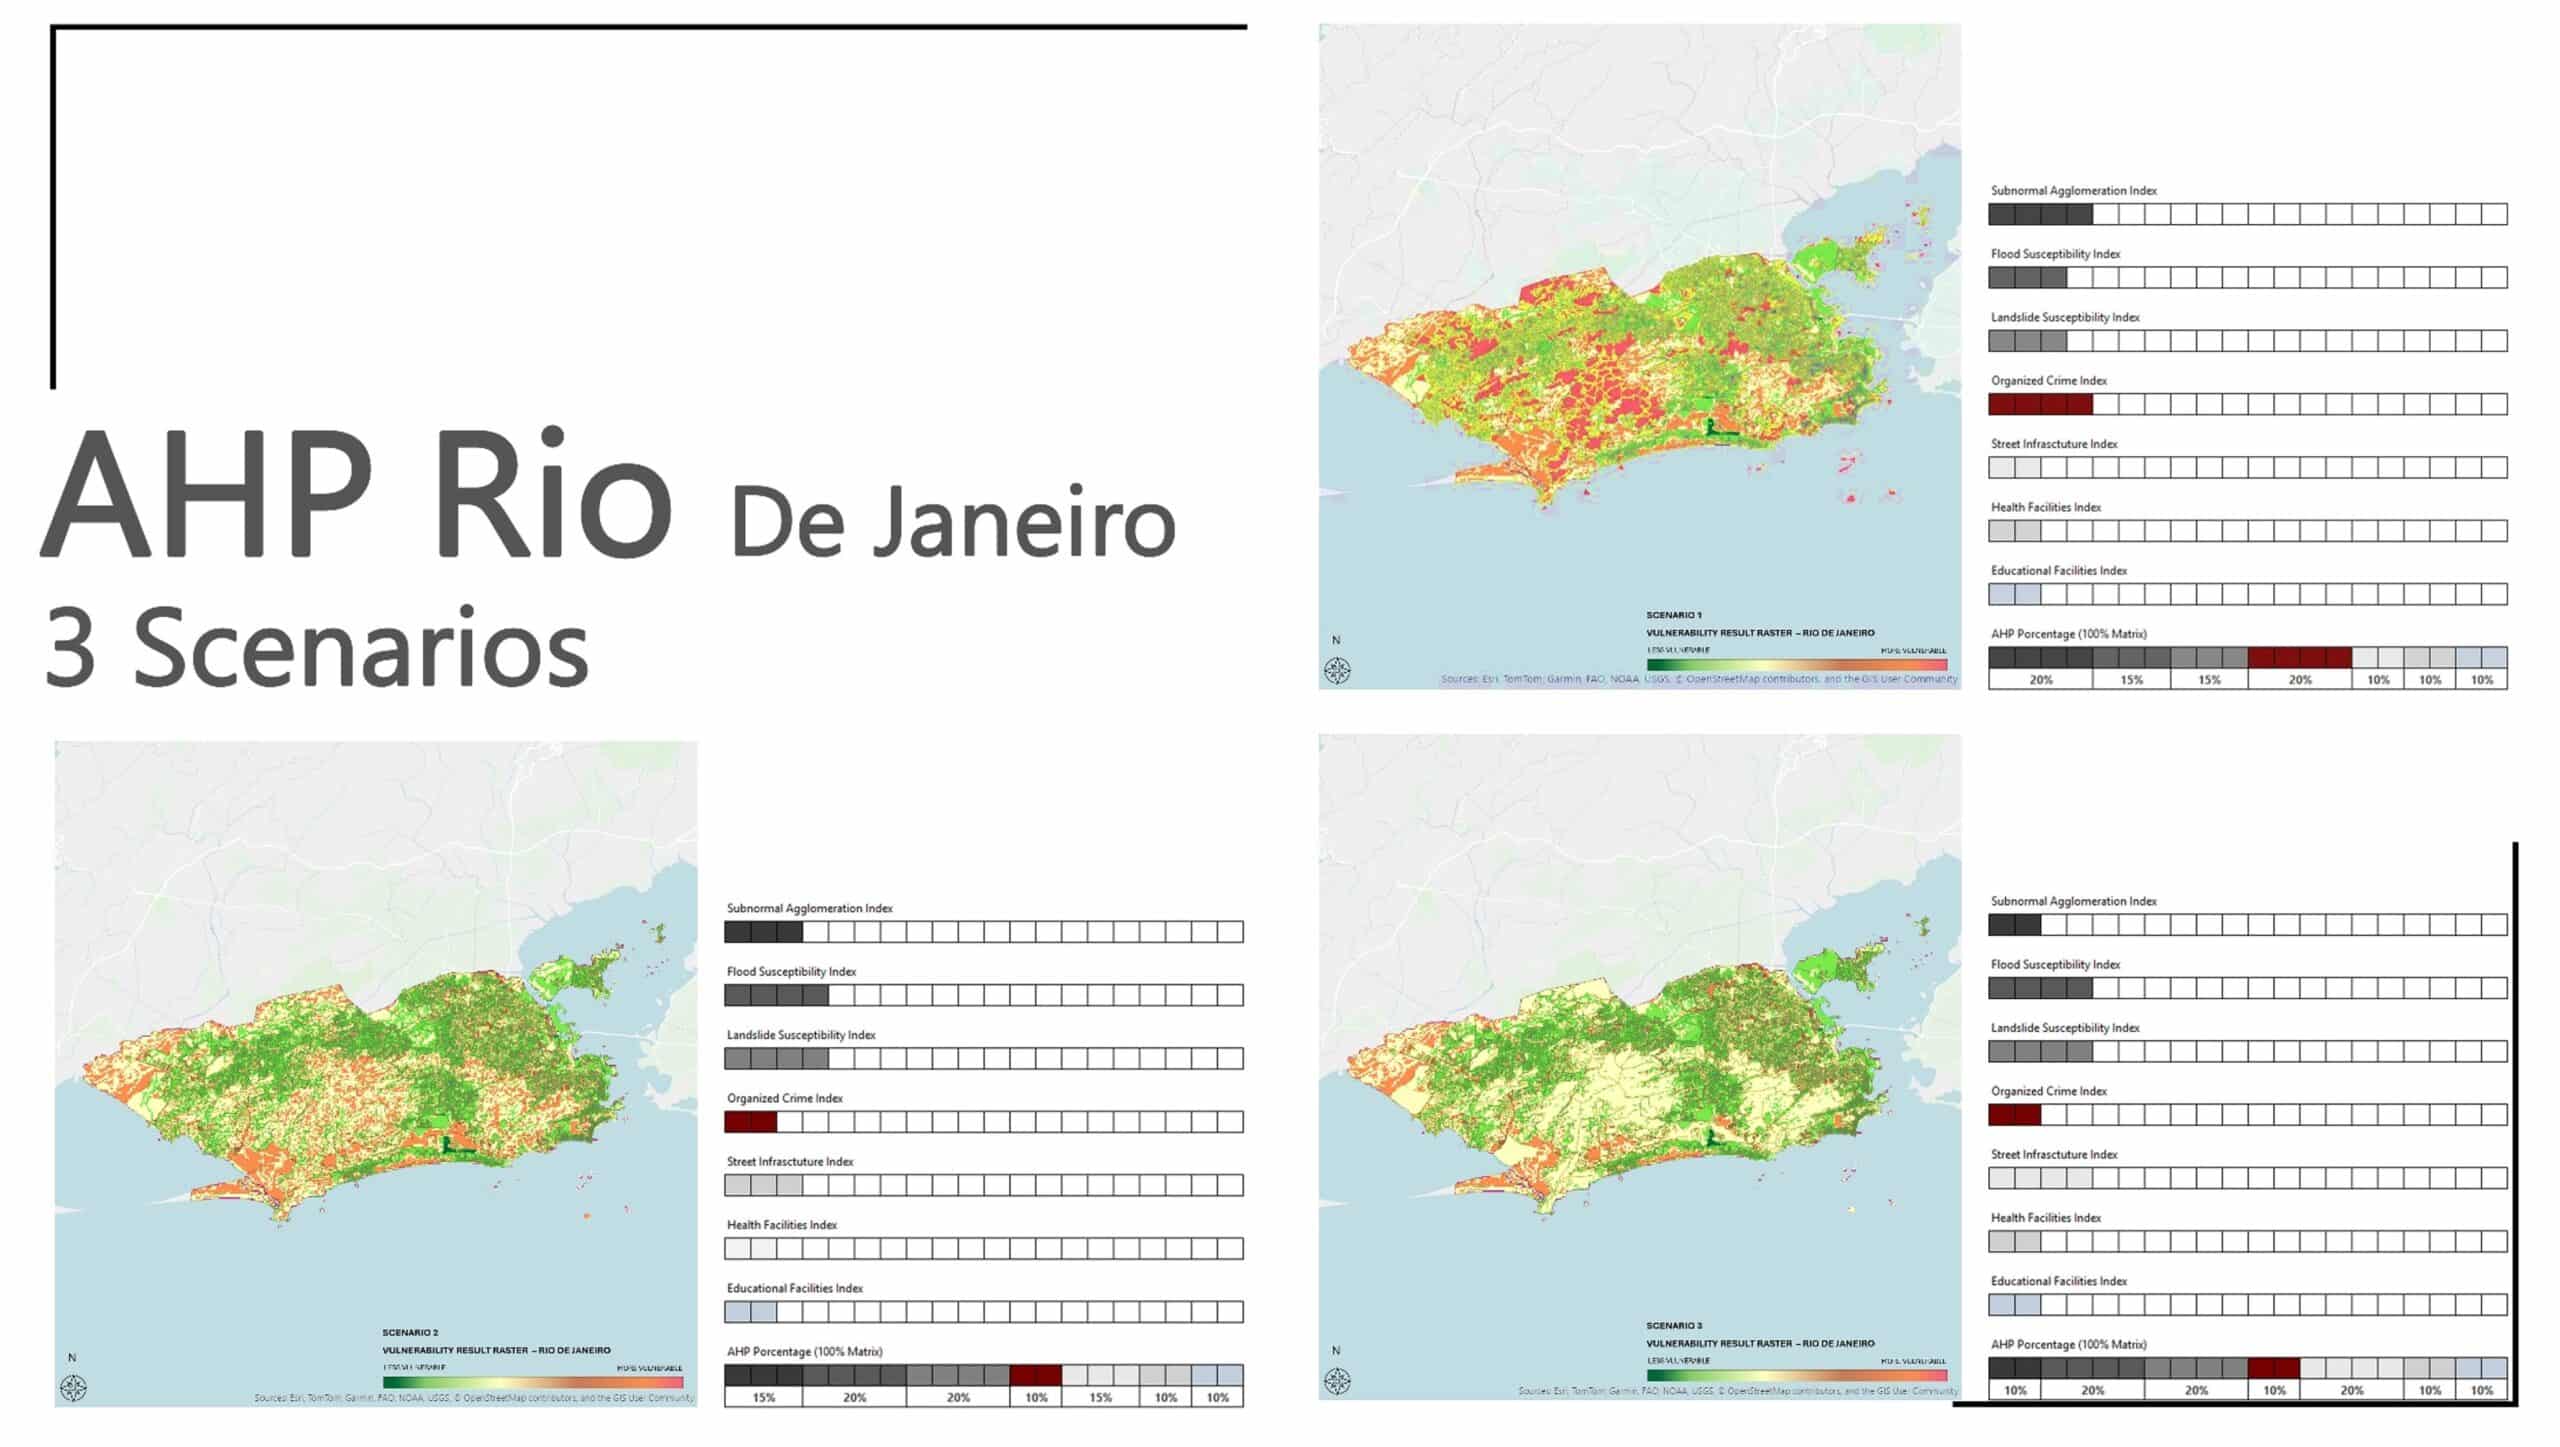
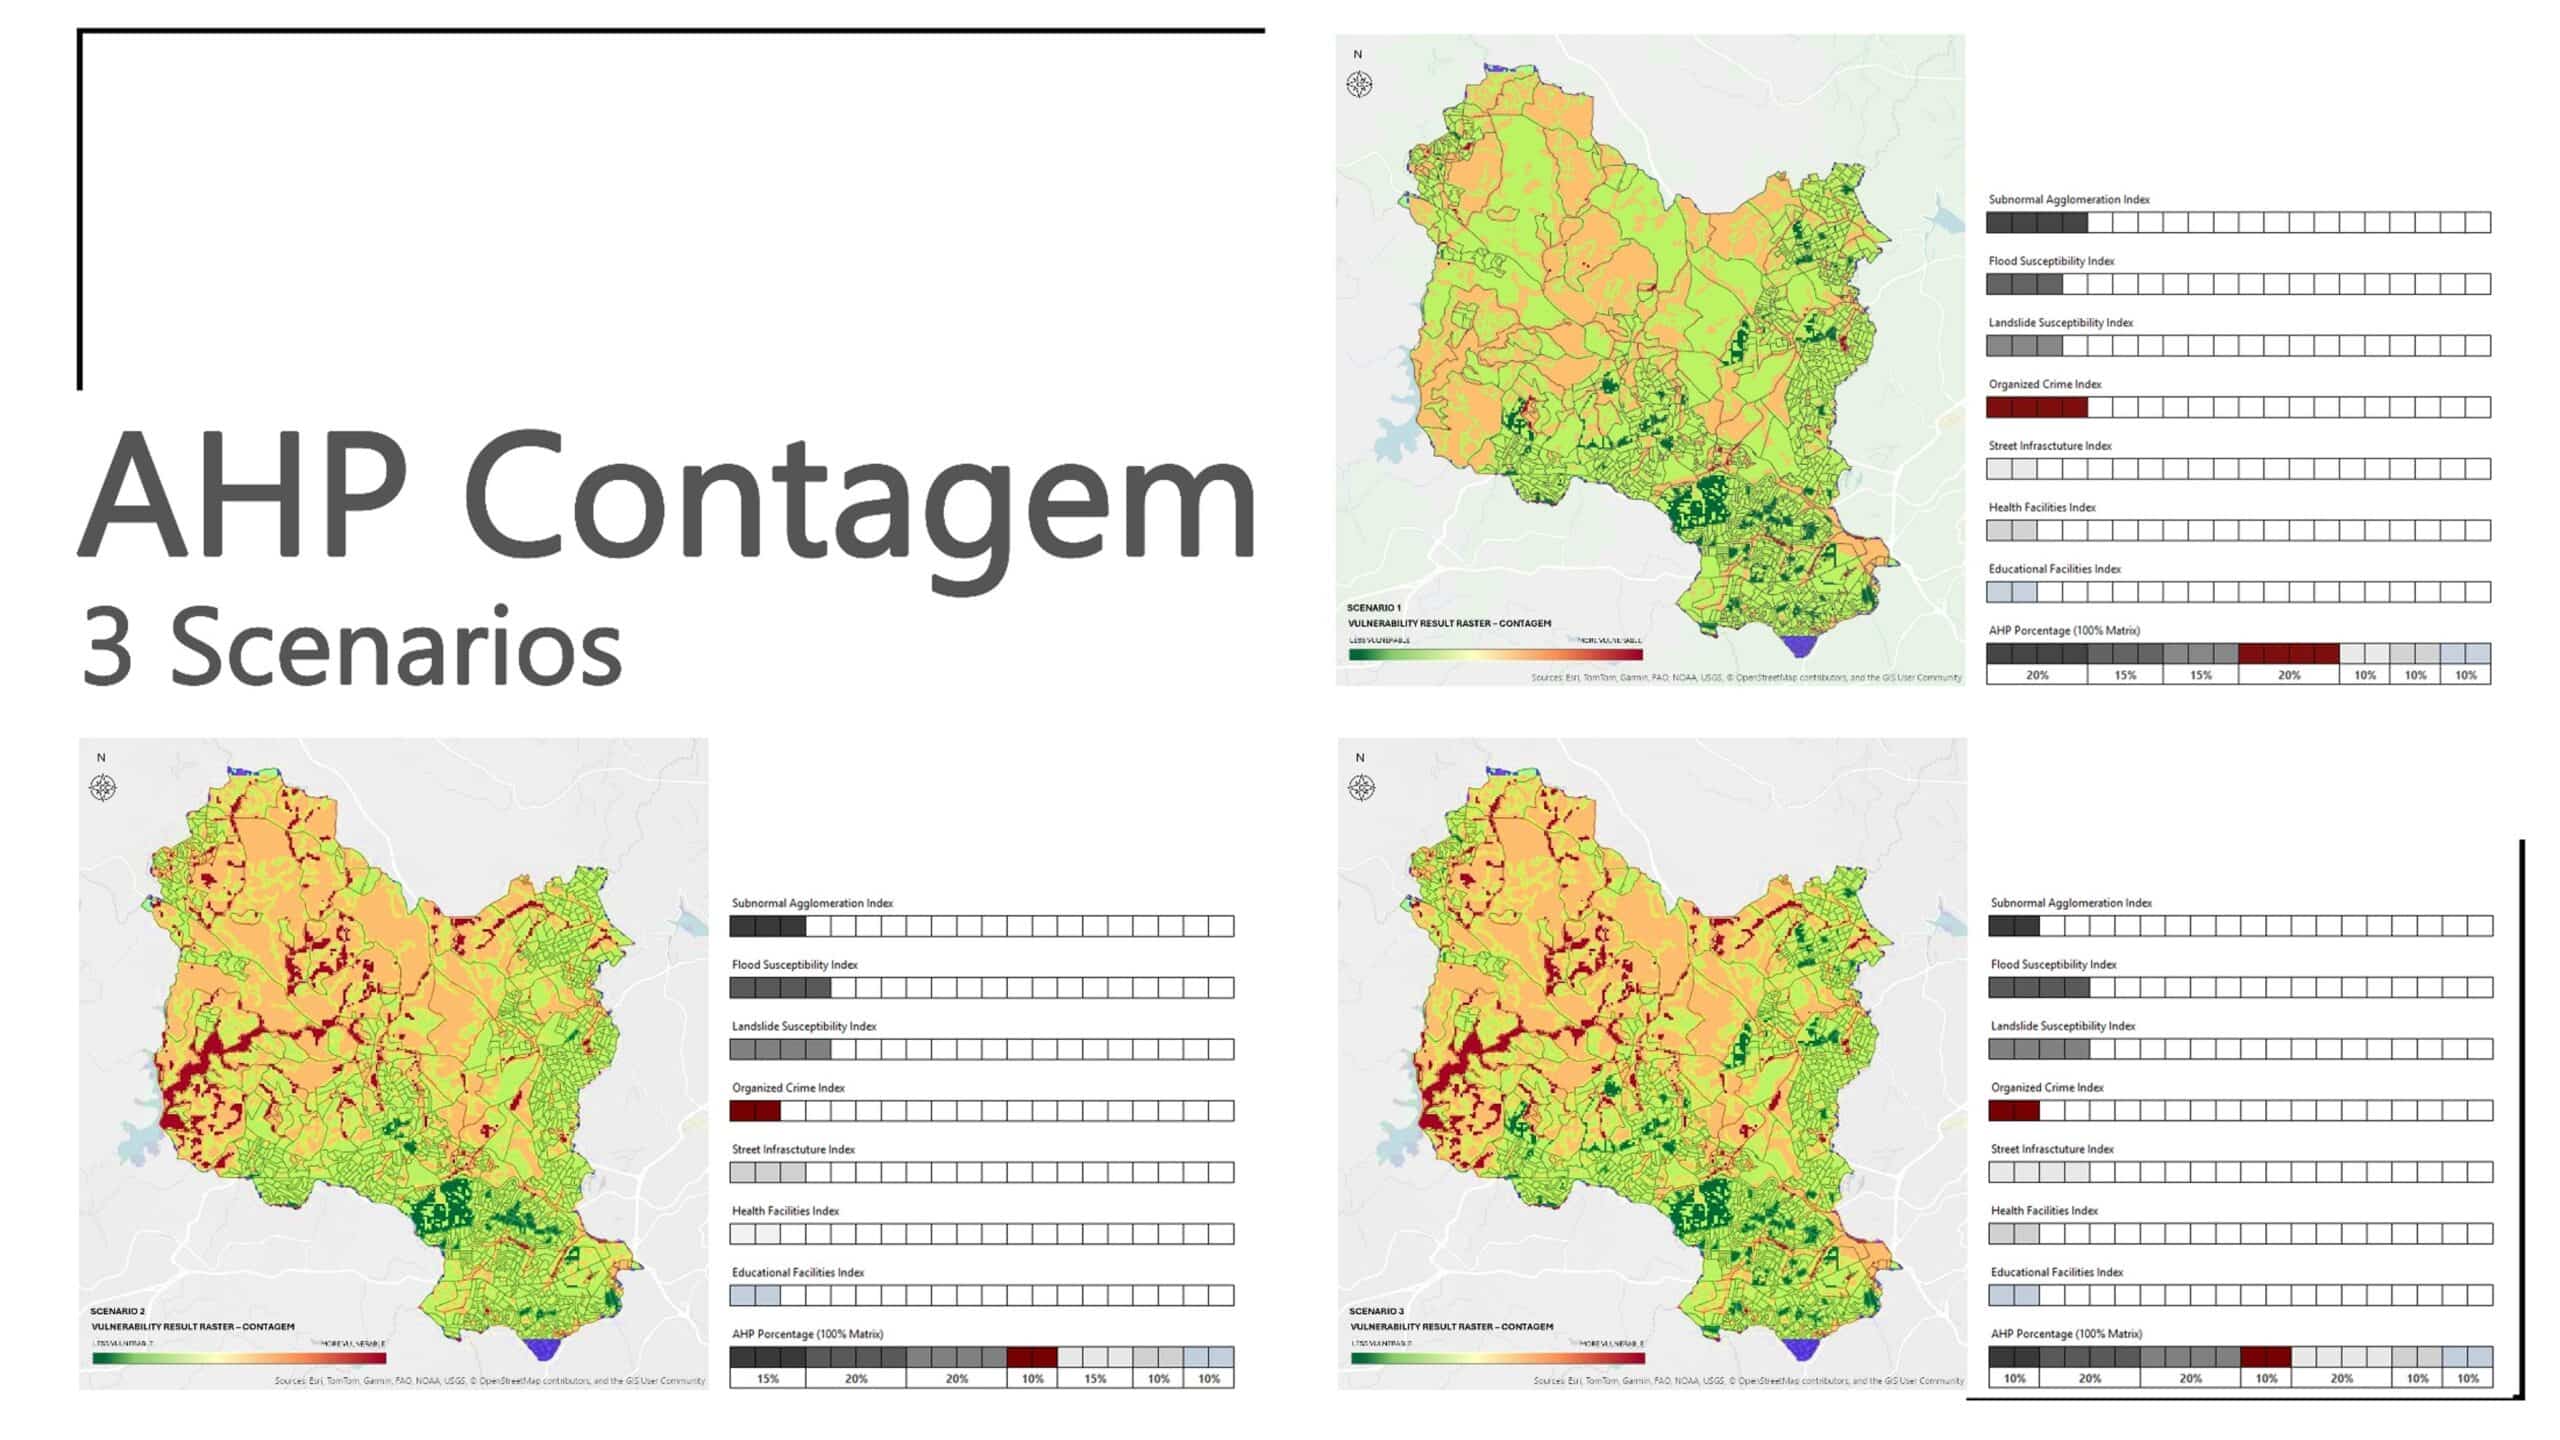
The AHP methodology can be used to map territorial vulnerability according to the factors that are most relevant in each territory. In the maps below, it is possible to observe that Scenarios 1, 2, and 3 produce different results for Rio de Janeiro and Contagem, reflecting the distinct characteristics and challenges of each location.
In Scenario 1, Rio de Janeiro clearly appears with higher levels of vulnerability (represented by red areas), as this scenario assigns greater weight to public security issues and violence associated with organized crime, which are more prominent in this territory.
In contrast, in Scenario 3, Contagem presents higher vulnerability levels, since this scenario emphasizes criteria related to mining activities and environmental risks, such as flooding and landslides. These issues are more strongly linked to the local economic activities in Contagem, making the territory more affected when these criteria are given greater relevance.