
Rethinking Urban Spaces
Parks and green areas are critical in cities as they provide spaces for people to meet, interact, and find a social life. They contribute significantly to the mental and physical well-being of residents, offering a natural respite from the urban hustle.
Project Summary:
According to google reviews, the most important factor for a successful park in Miami Dade county is Maintenance. Generally parks are maintained in higher economic zones than others. The project aims to enhance the quality and success of parks in Miami-Dade County by analyzing various factors influencing their attractiveness, accessibility, and functionality. By leveraging data on park infrastructure, demographics, health indicators, transportation, environmental quality, and safety, the project seeks to identify areas for improvement and implement strategies to enhance park experiences for residents and visitors alike.
Critical Areas of Focus:
- Maintenance and Infrastructure: Assessing the maintenance level of parks, including cleanliness, vegetation management, and the condition of facilities and amenities.
- Public-Private Partnerships (PPP): Exploring opportunities for collaboration between municipalities and local businesses to enhance park amenities and attract investment.
- Restaurant and Business Presence: Evaluating the impact of nearby restaurants and businesses on park usage and attractiveness, potentially leading to the development of a scoring system to assess PPP potential.
- Tree Selection and Greenery: Analyzing the types of trees planted in parks and their impact on shade, aesthetics, biodiversity, and maintenance requirements.
- User Experience and Safety: Addressing issues related to safety concerns, overcrowding, limited amenities, and accessibility barriers identified through user reviews and feedback.
- Data-driven: Utilizing data on park density, population demographics, health outcomes, transportation infrastructure, environmental quality, and safety to inform decision-making and prioritize interventions.
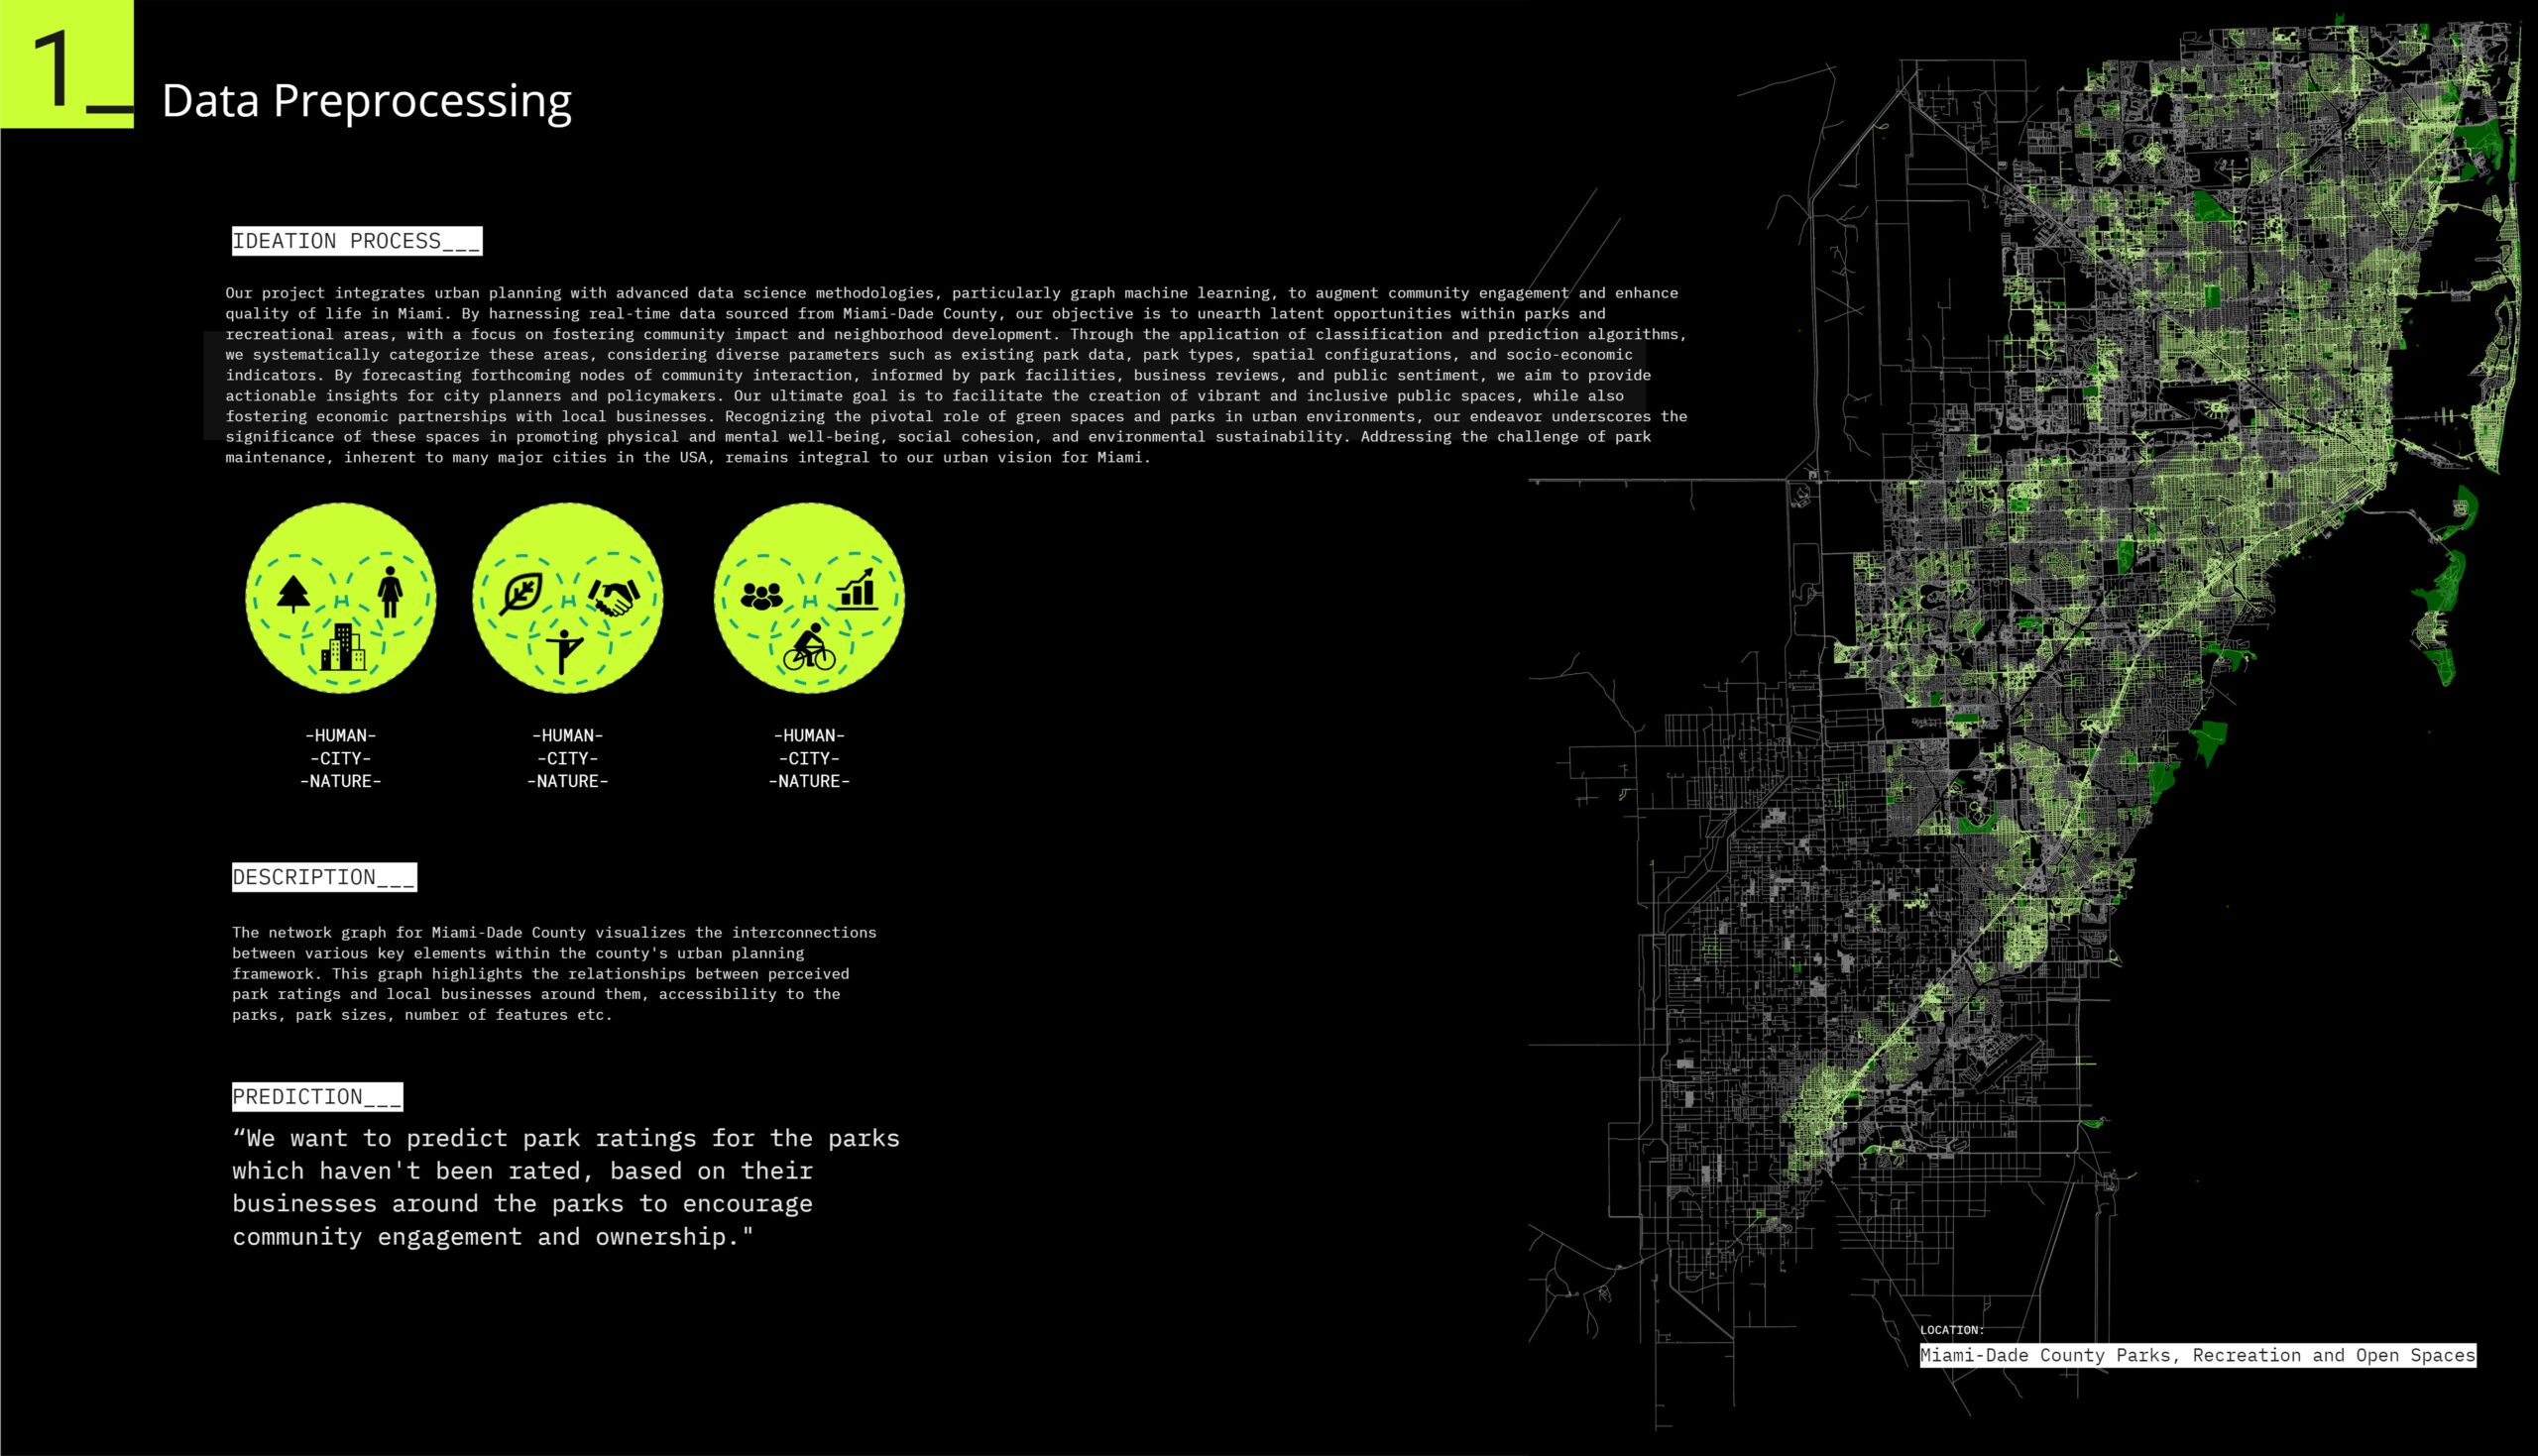
Our project integrates urban planning with advanced data science methodologies, particularly graph machine learning, to augment community engagement and enhance quality of life in Miami. By harnessing real-time data sourced from Miami-Dade County, our objective is to unearth latent opportunities within parks and recreational areas, with a focus on fostering community impact and neighborhood development. Through the application of classification and prediction algorithms, we systematically categorize these areas, considering diverse parameters such as existing park data, park types, spatial configurations, and socio-economic indicators. By forecasting forthcoming nodes of community interaction, informed by park facilities, business reviews, and public sentiment, we aim to provide actionable insights for city planners and policymakers. Our ultimate goal is to facilitate the creation of vibrant and inclusive public spaces, while also fostering economic partnerships with local businesses. Recognizing the pivotal role of green spaces and parks in urban environments, our endeavor underscores the significance of these spaces in promoting physical and mental well-being, social cohesion, and environmental sustainability. Addressing the challenge of park maintenance, inherent to many major cities in the USA, remains integral to our urban vision for Miami.
Methodology:
- Data Collection: Gathering relevant data sets from sources such as Miami-Dade Open Data Hub, parks department websites, GIS mapping applications, and public records.
- Data Analysis: Conducting statistical analysis and spatial mapping to identify patterns, correlations, and areas of concern across different factors and park locations.
- Stakeholder Engagement: Collaborating with park authorities, local businesses, community organizations, and residents to gather insights, solicit feedback, and foster partnerships.
- Strategy Development: Formulating strategies and recommendations based on data analysis and stakeholder input to address maintenance issues, enhance amenities, improve safety, and promote park usage.
- Implementation and Evaluation: Implementing targeted interventions, monitoring their effectiveness, and iterating based on outcomes to continuously improve park quality and success.
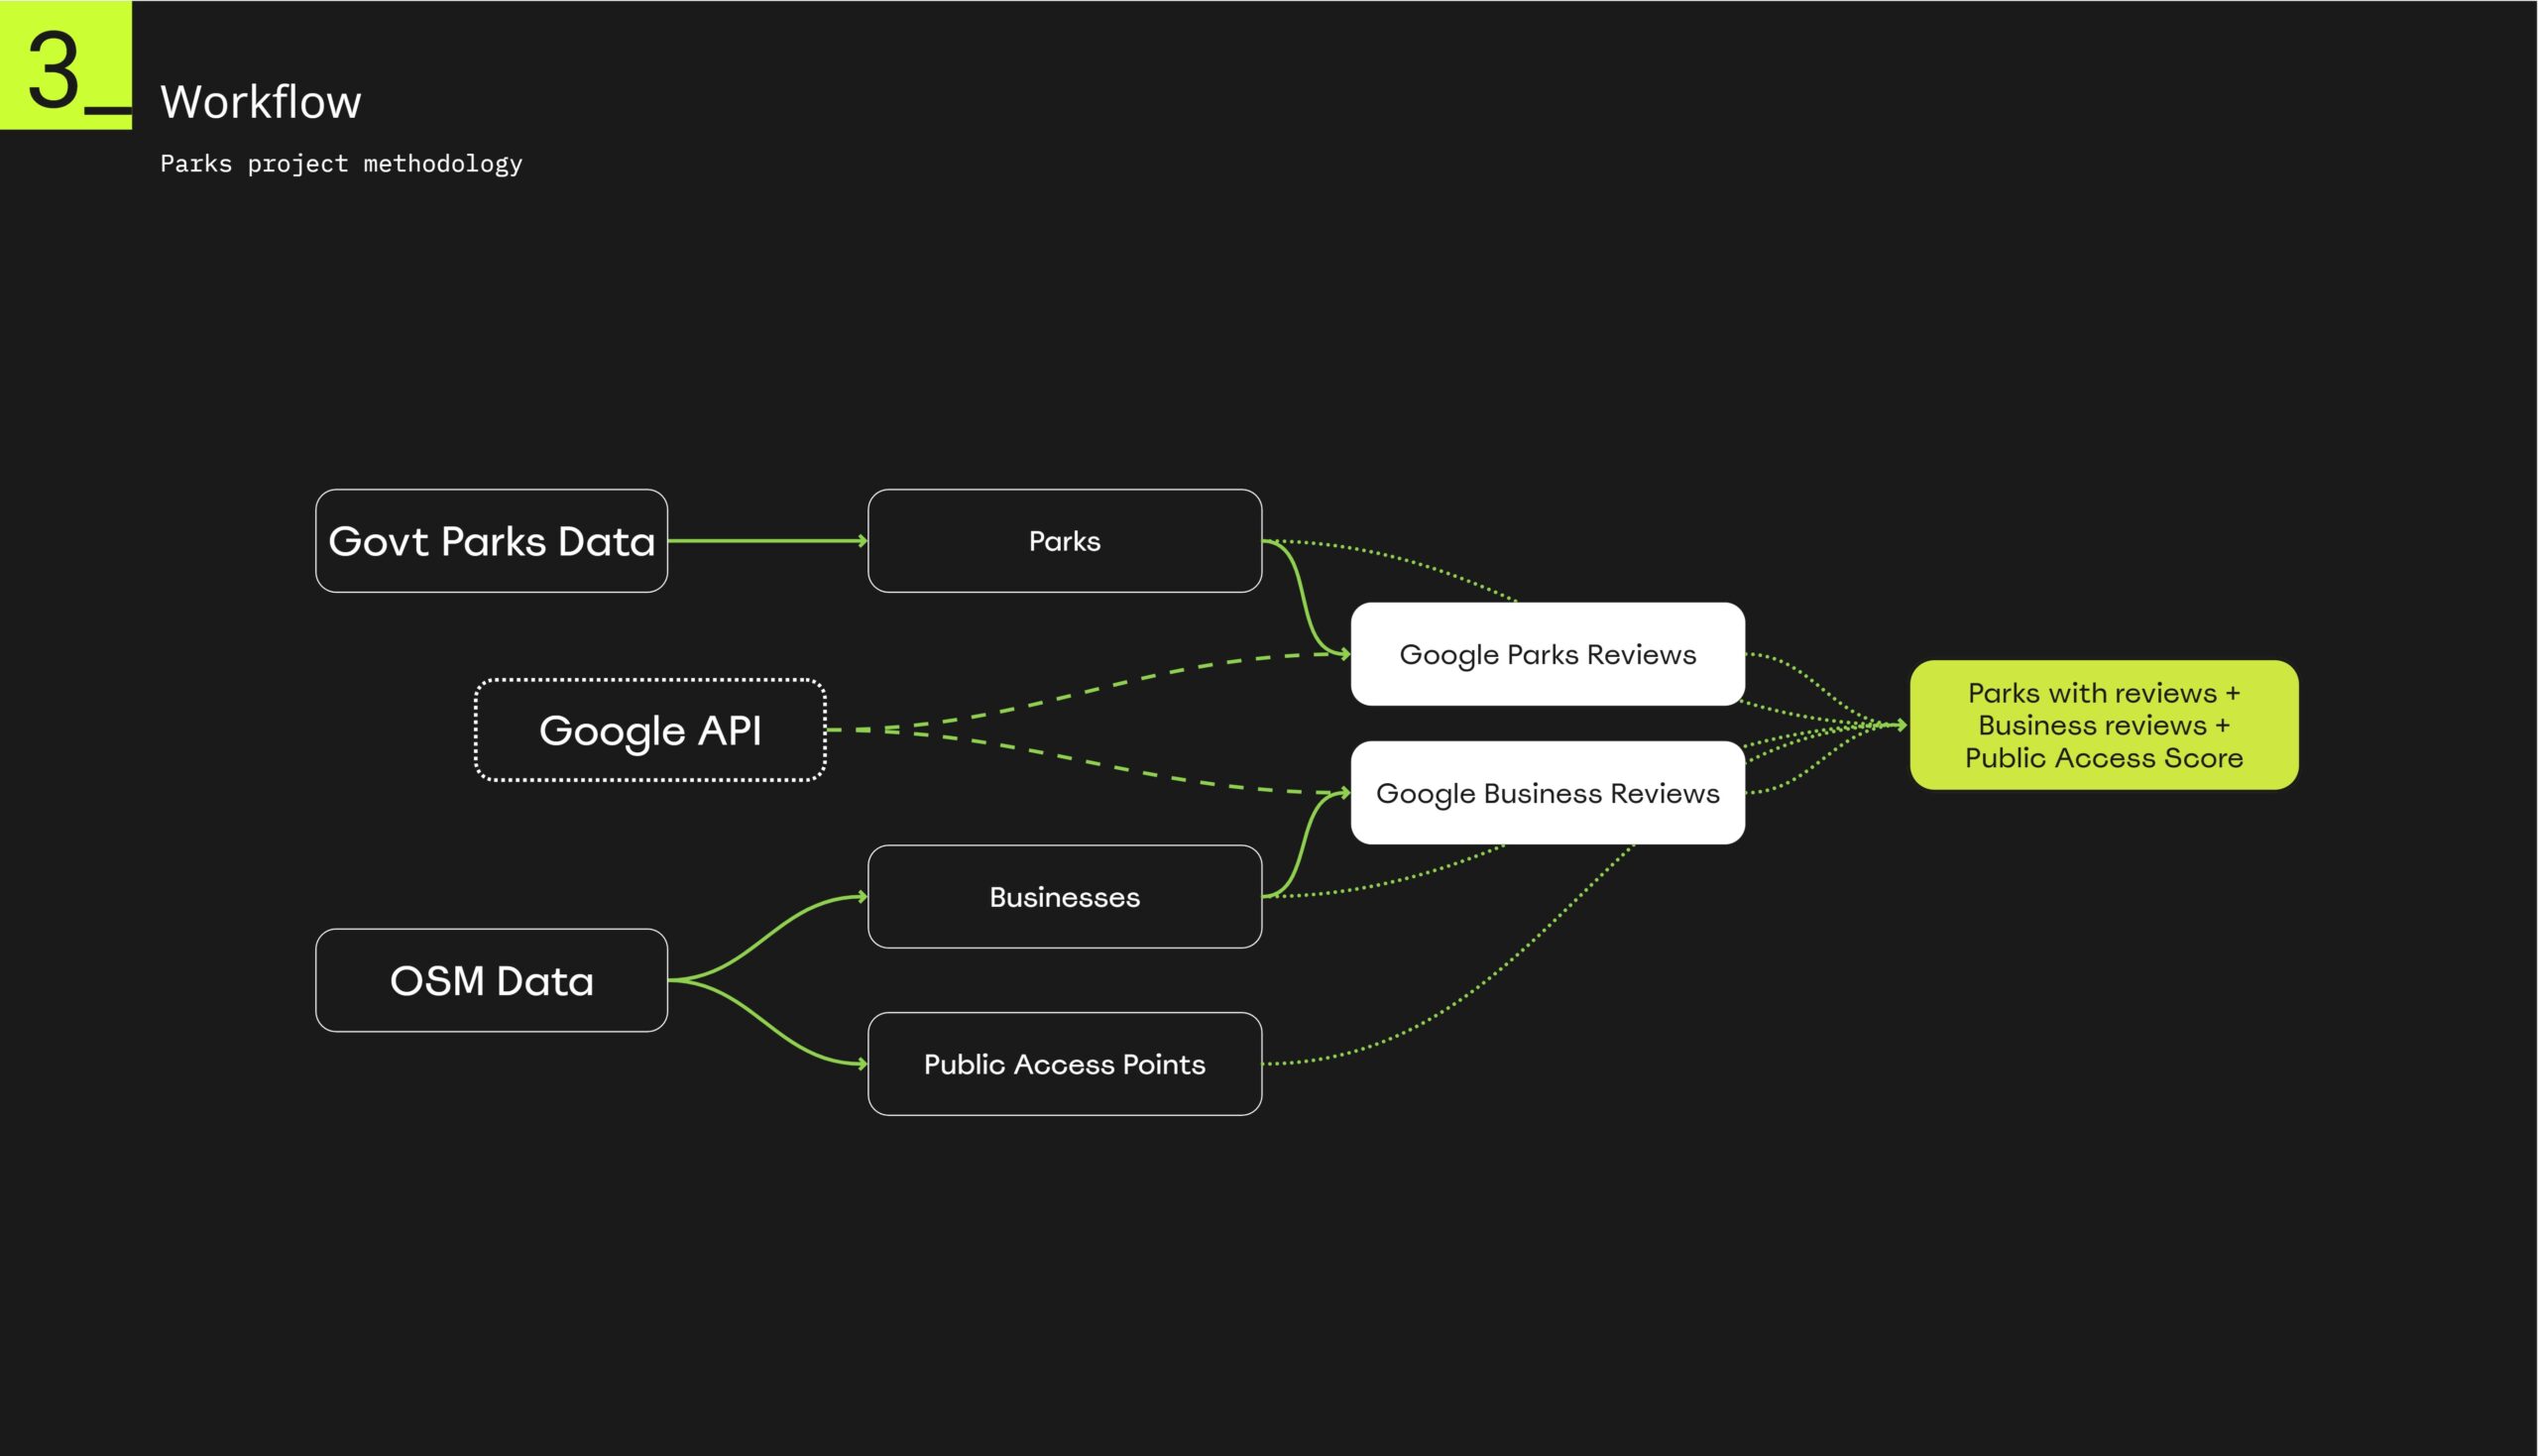
Our workflow for the parks project methodology, detailing the process of integrating various data sources to evaluate and enhance public access to parks in Miami-Dade County. The workflow involves data collection, integration, and analysis, culminating in the creation of a composite score for parks based on public reviews and accessibility.
Key Components:
- Data Sources:
- Govt Parks Data: Government-sourced data providing information about the locations and details of parks.
- OSM Data: OpenStreetMap data, which includes geographic data on various public access points and businesses.
- Google API: Used to fetch reviews and ratings for both parks and businesses.
- Data Integration:
- Parks: Derived from Government Parks Data, representing the primary subject of analysis.
- Businesses: Derived from OSM Data, indicating commercial entities in proximity to parks.
- Public Access Points: Also derived from OSM Data, detailing the points of public entry to parks and surrounding areas.
- Google Reviews:
- Google Parks Reviews: Reviews and ratings of parks collected via the Google API.
- Google Business Reviews: Reviews and ratings of nearby businesses collected via the Google API.
- Data Processing:
- The slide shows how data flows from the raw sources through processing stages to integrate different types of data (parks, businesses, public access points) with public reviews.
- Dashed Lines: Represent the API calls to Google for fetching reviews of parks and businesses.
- Outcome:
- Parks with Reviews + Business Reviews + Public Access Score: The final output of this workflow, which combines the integrated data into a composite metric.
- This metric includes:
- Reviews of parks.
- Reviews of nearby businesses.
- A public access score indicating the ease of access to these parks.
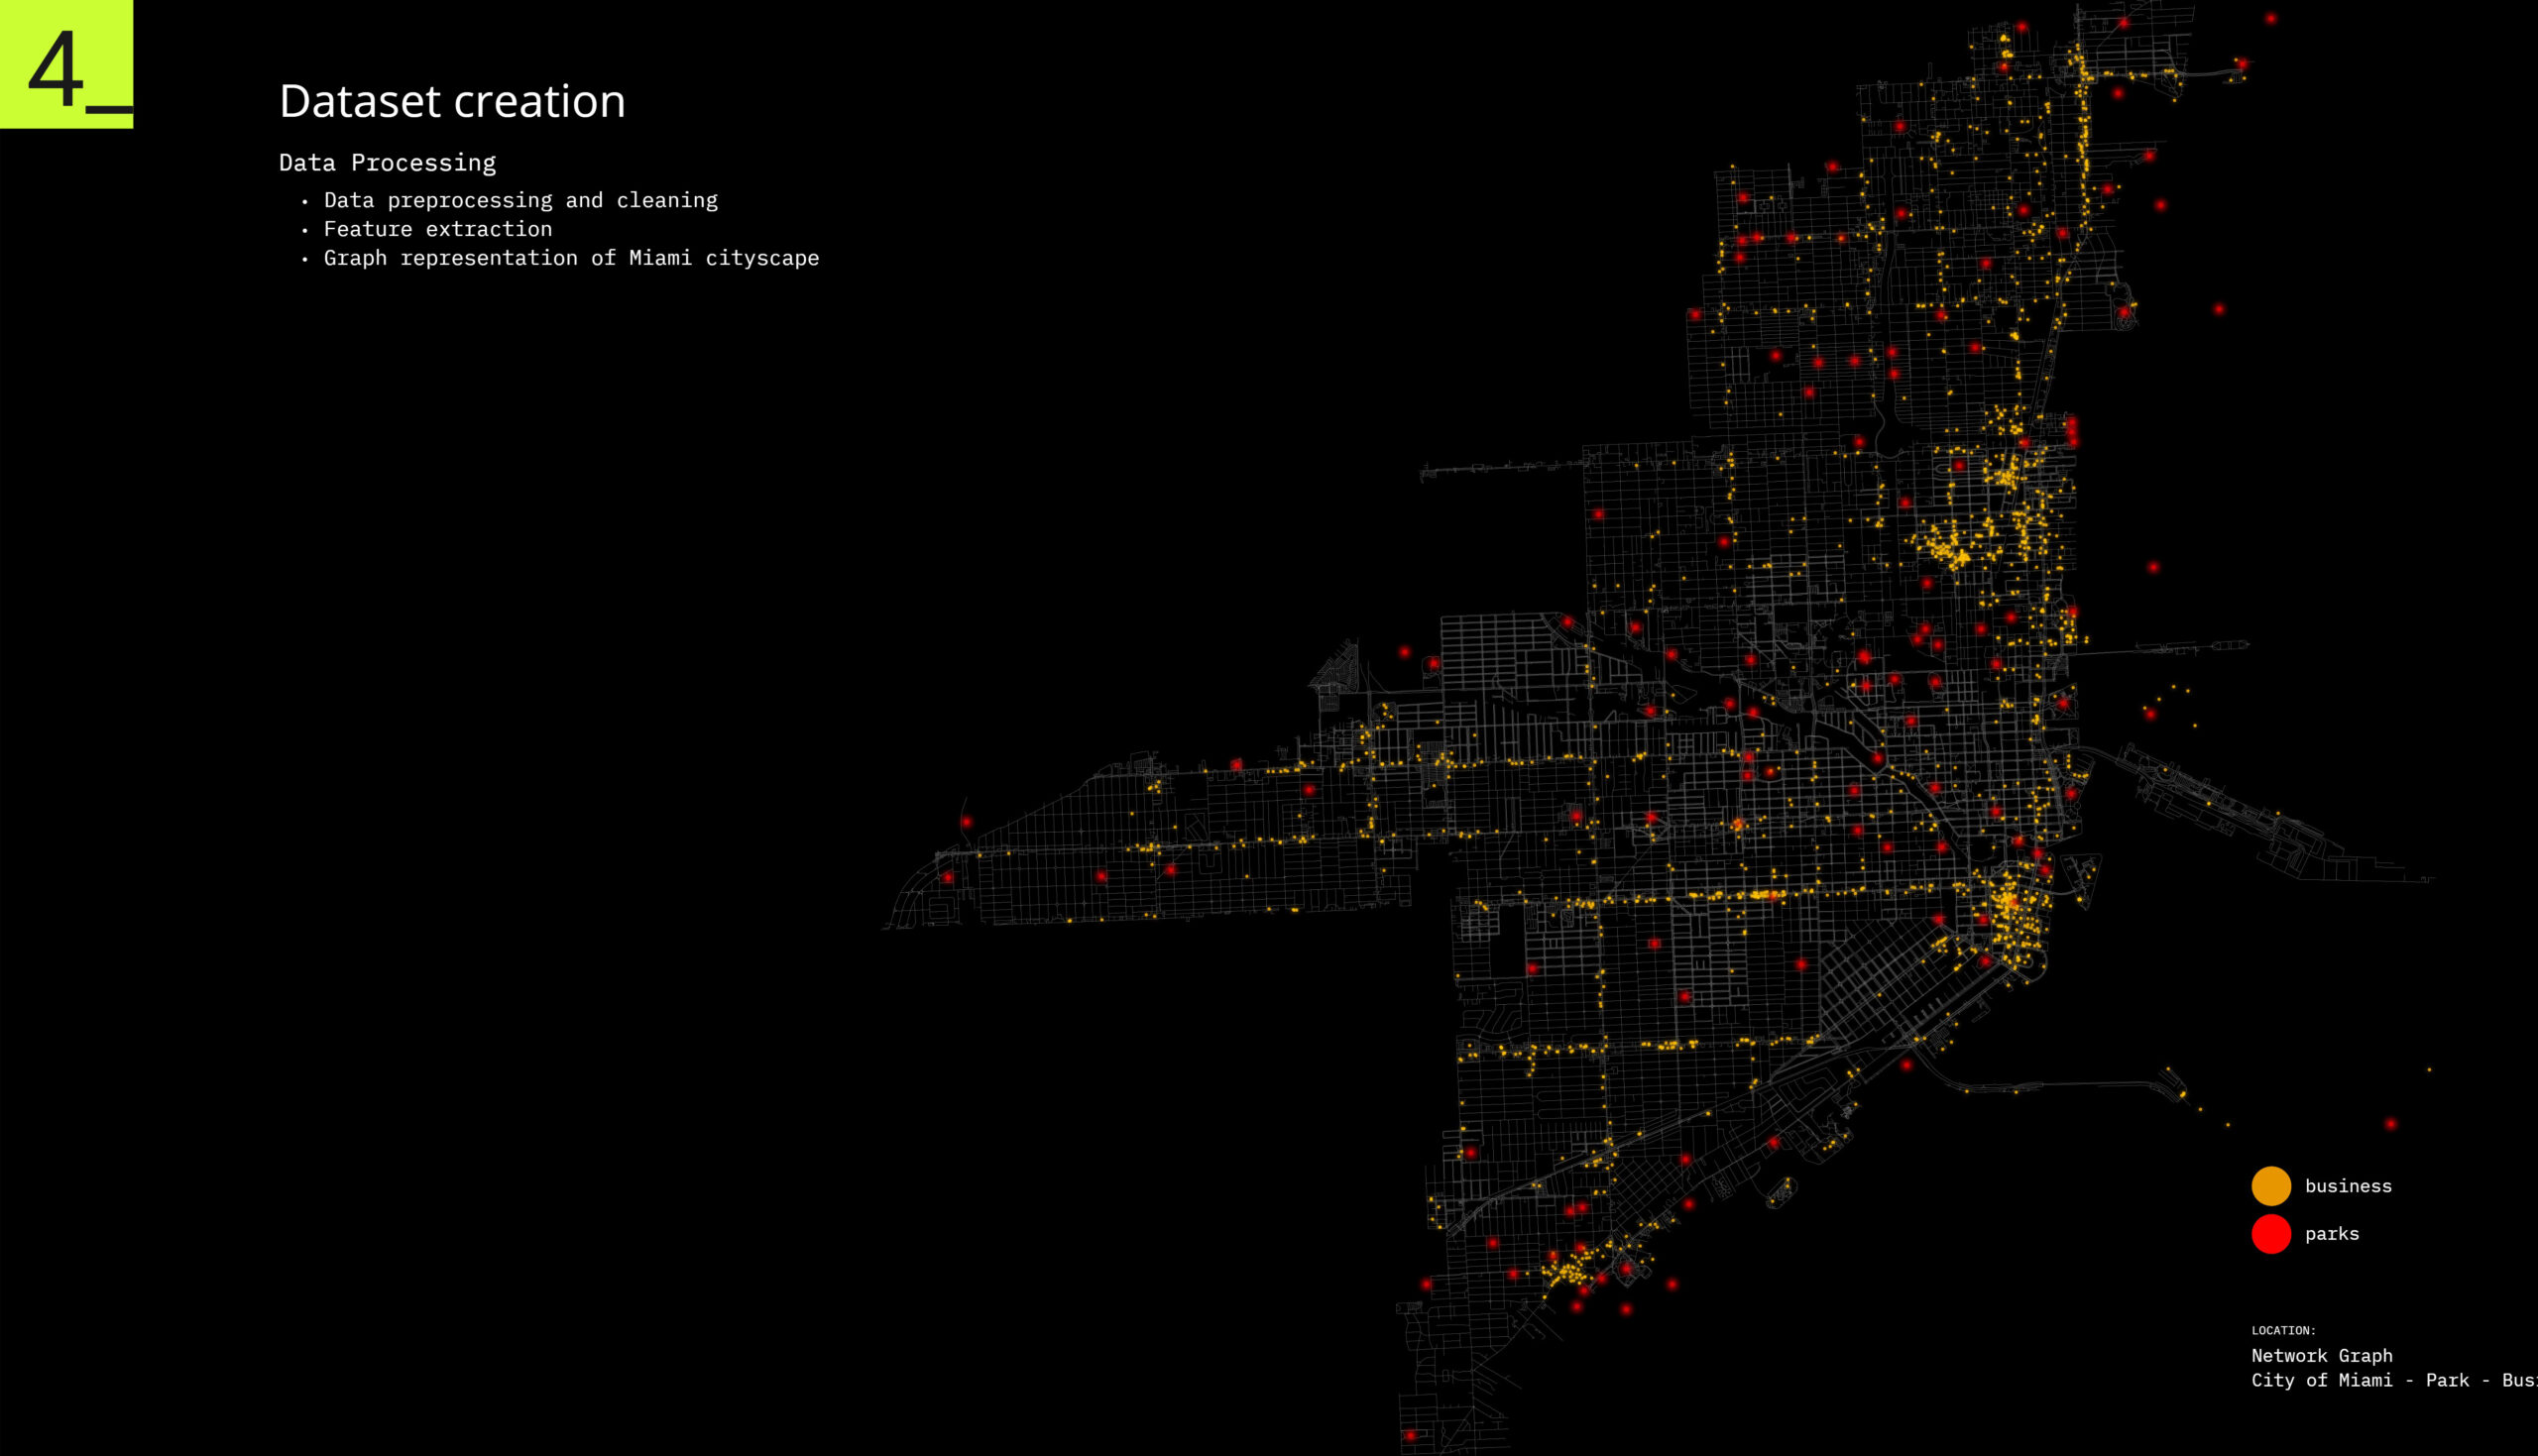
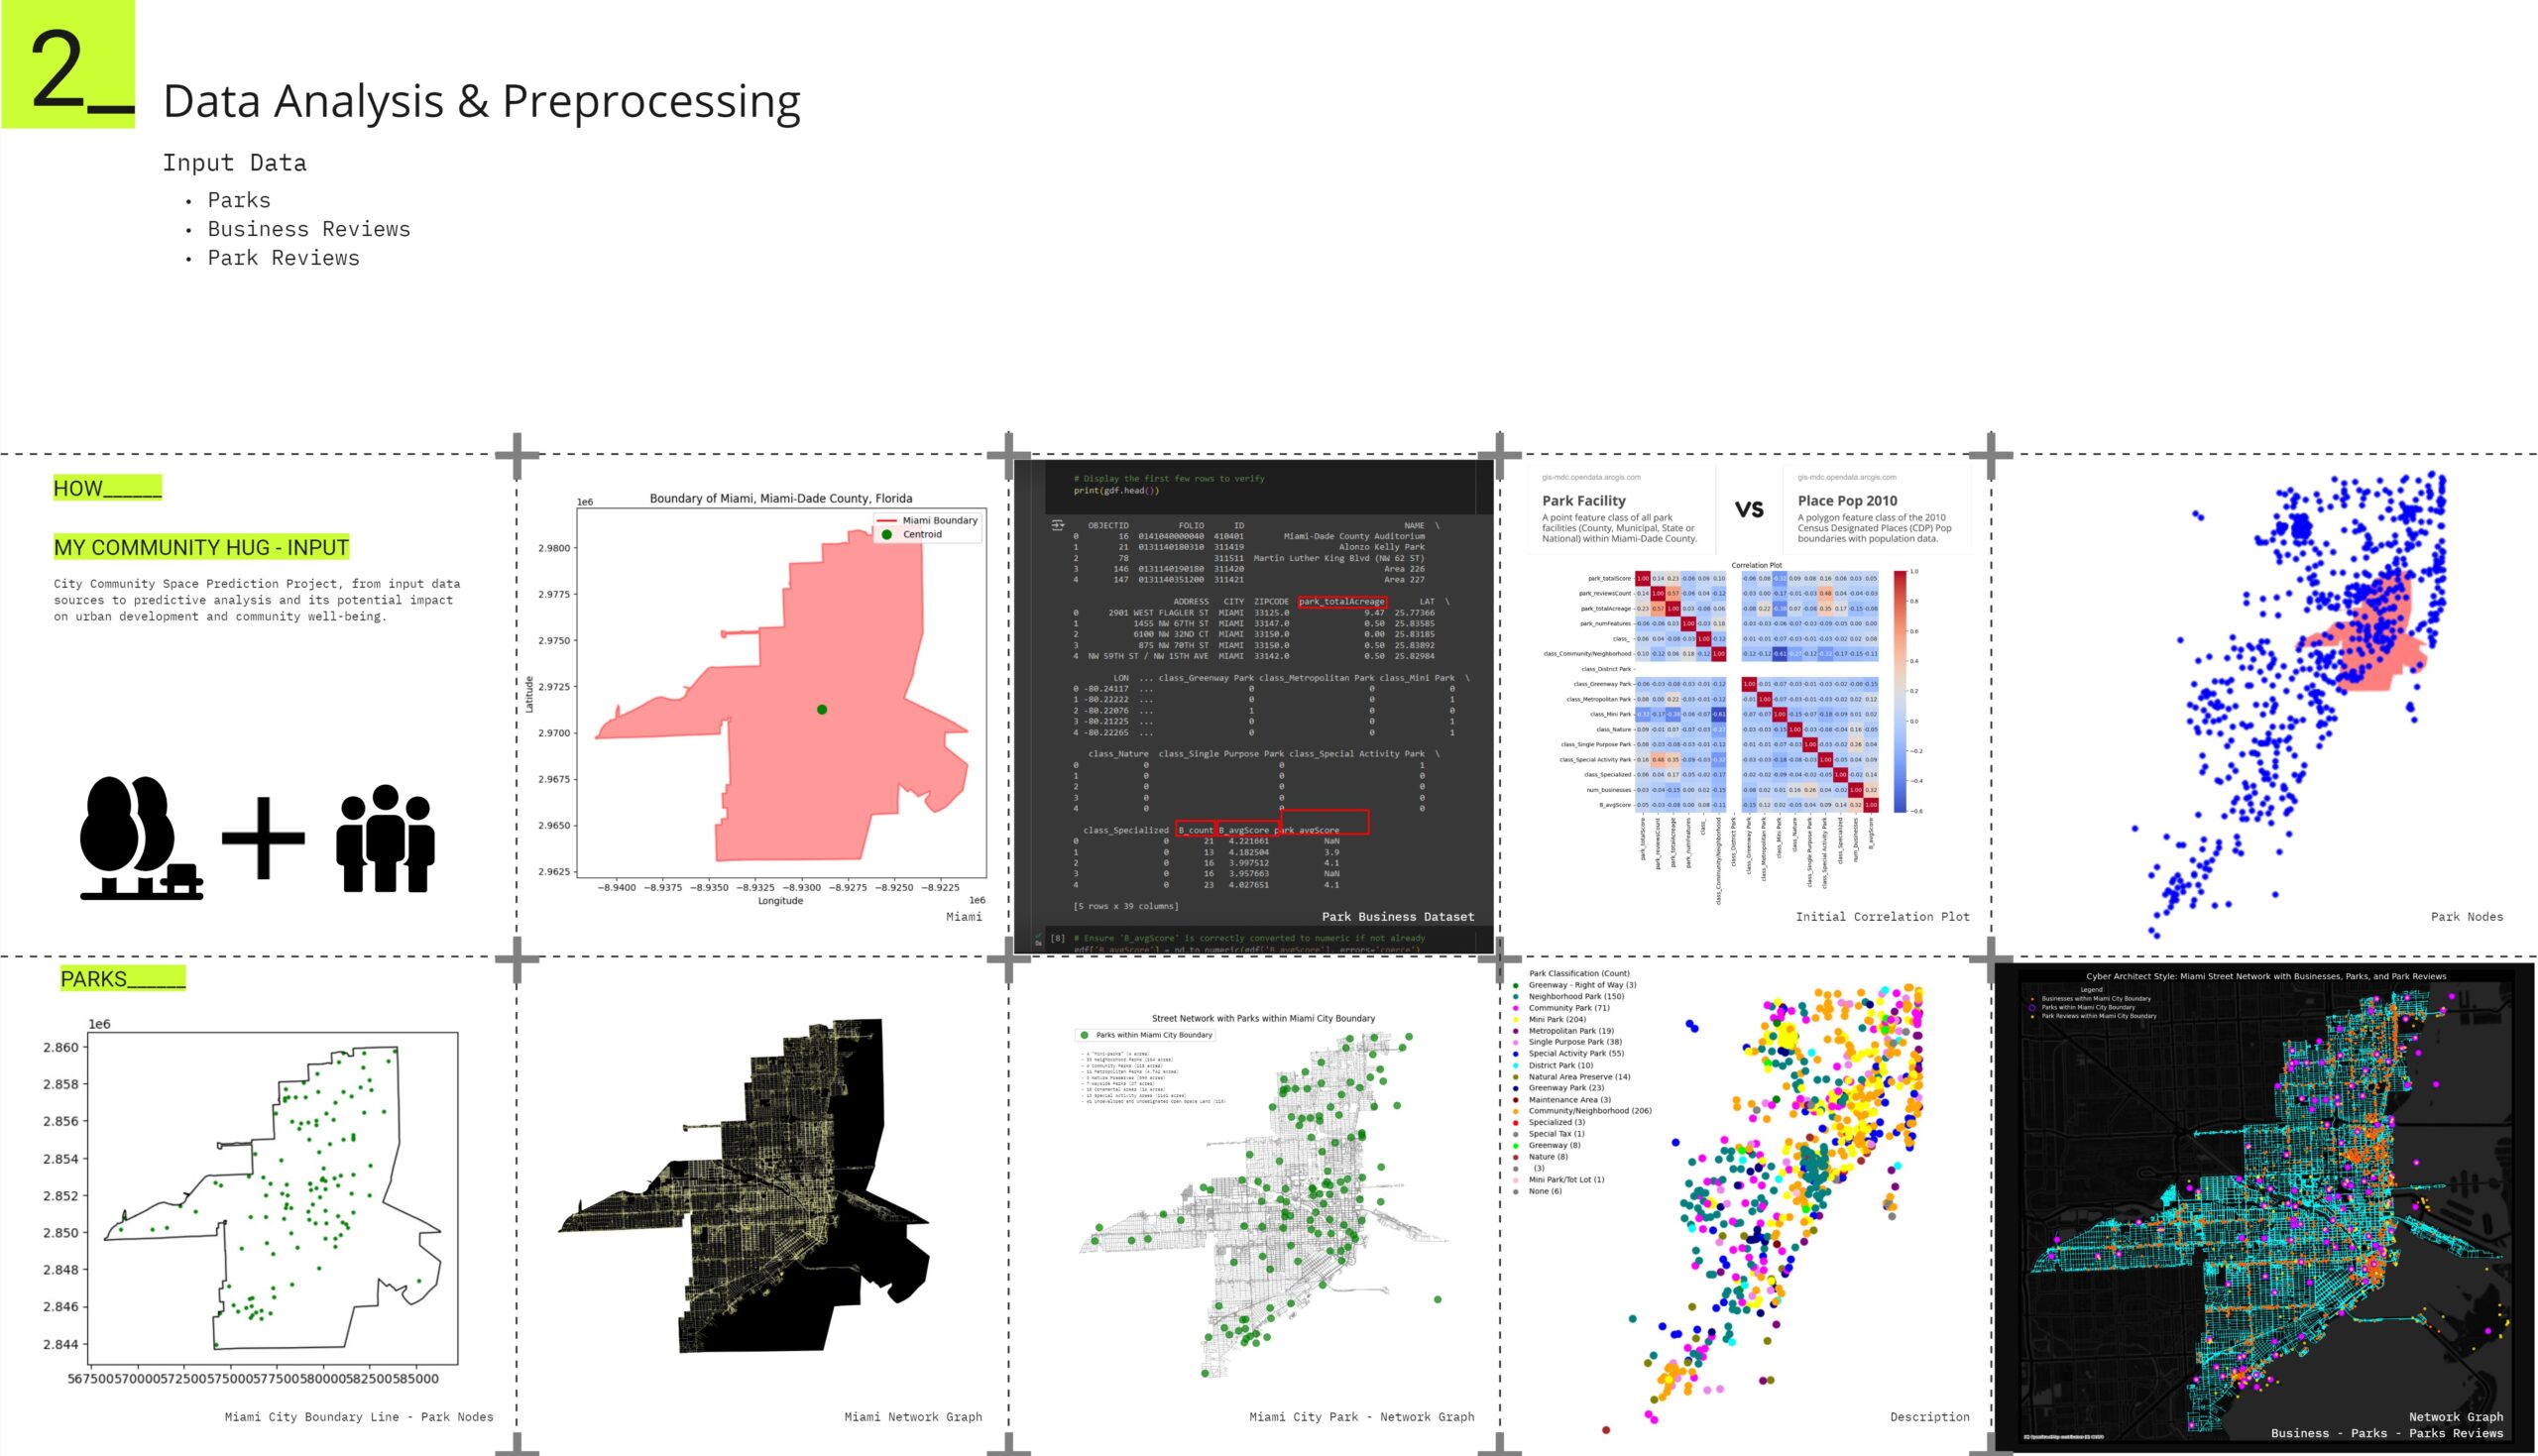
We was focuses on the process of creating and preparing the dataset for the analysis and visualization of Miami’s cityscape, particularly highlighting the importance of data preprocessing, feature extraction, and the graph representation of the city.
- Data Processing:
- Data Preprocessing and Cleaning: This step involves preparing the raw data by removing any inconsistencies, correcting errors, and ensuring the dataset is ready for analysis. It is crucial to have clean data to ensure accurate and reliable results.
- Feature Extraction: This involves identifying and extracting important attributes or features from the raw data. In the context of urban analysis, features might include locations of businesses, parks, public transport stops, and other critical points of interest.
- Graph Representation of Miami Cityscape:
- The map displayed on the slide represents a graph of Miami’s cityscape, showcasing the spatial distribution and connectivity of various elements within the city.
- Legend:
- Business (Orange): Points marked in yellow represent the locations of businesses across Miami. This helps in understanding the commercial distribution within the city.
- Parks (Red): Points marked in red indicate the locations of parks. This highlights the availability and spread of green spaces within the urban environment.
- Visual Representation:
- The map uses a network graph approach to visualize the relationships and proximity between different urban elements.
- The intricate network of lines and points showcases how businesses and parks are distributed throughout Miami, providing insights into the city’s infrastructure and planning.
- The density of points can give an indication of areas with high concentrations of businesses or parks, which is useful for urban planning and development purposes.
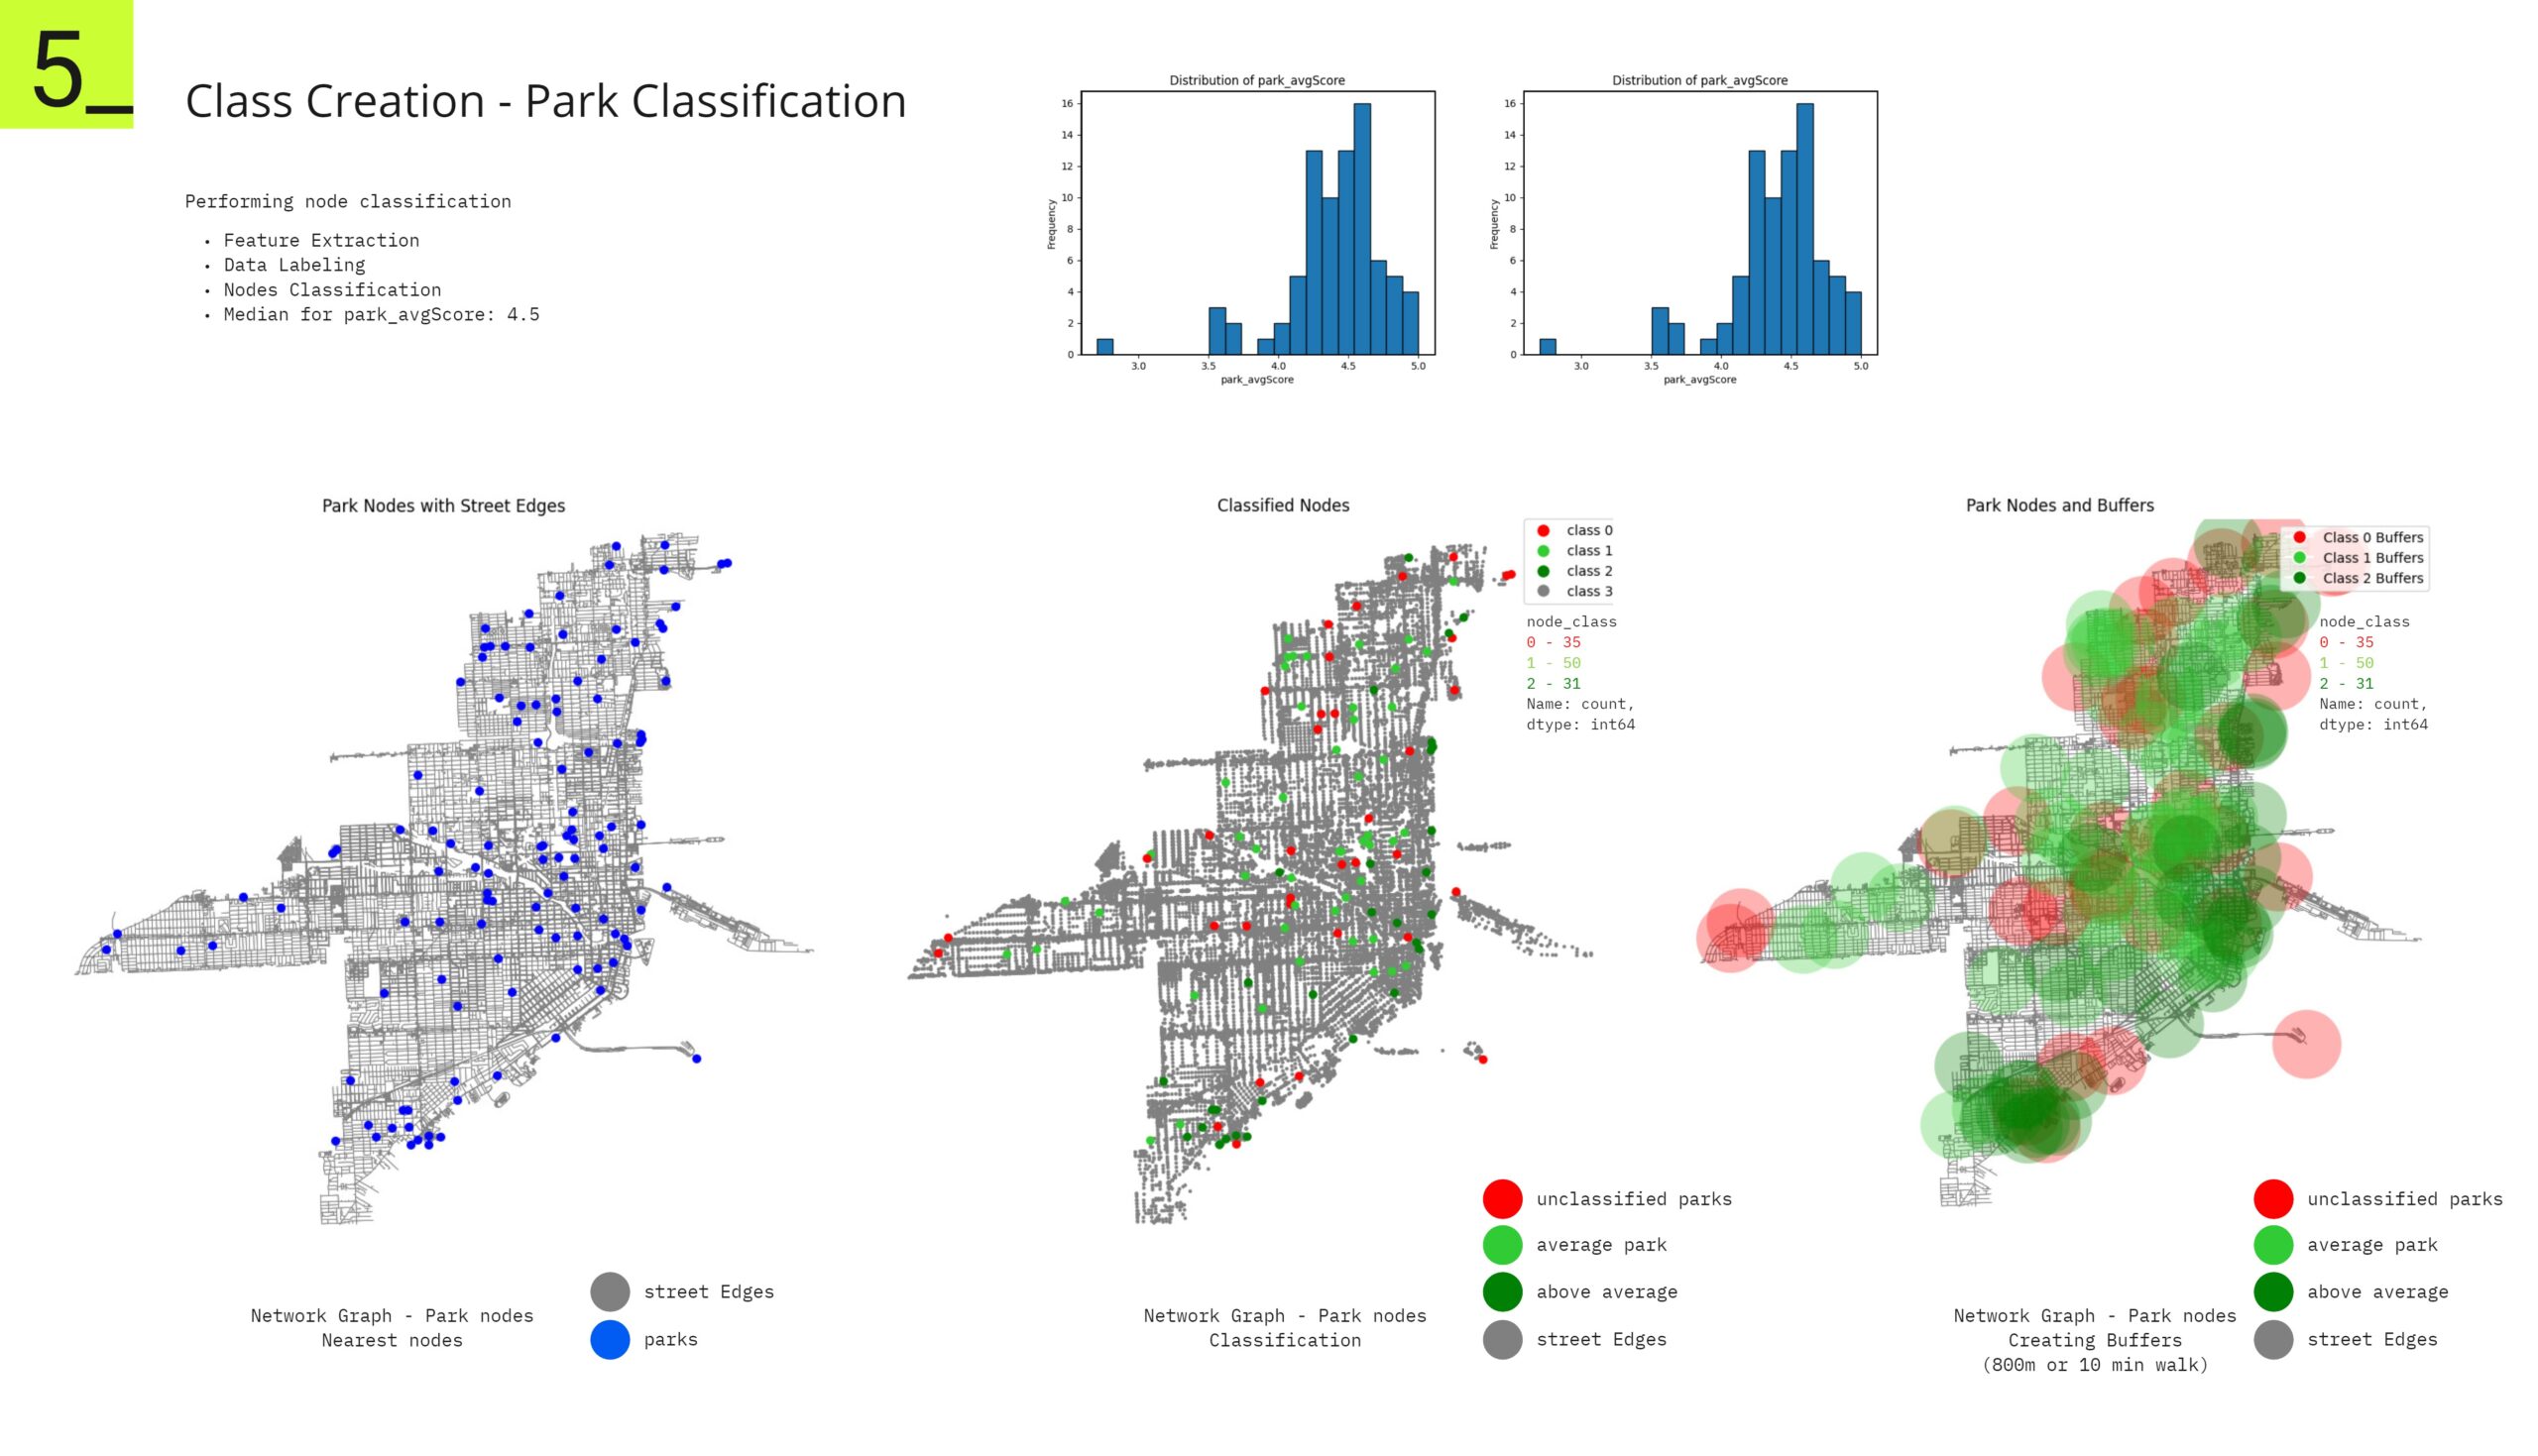
Here we demonstrate how parks in Miami-Dade County are classified based on their attributes and public reviews. The classifications help in understanding the quality and accessibility of parks, providing valuable insights for urban planners and policymakers. The visualizations make it easier to identify areas with well-rated parks and those that might need improvement or further development. The inclusion of buffers helps in assessing the accessibility of parks, ensuring that public spaces are within a convenient walking distance for residents.
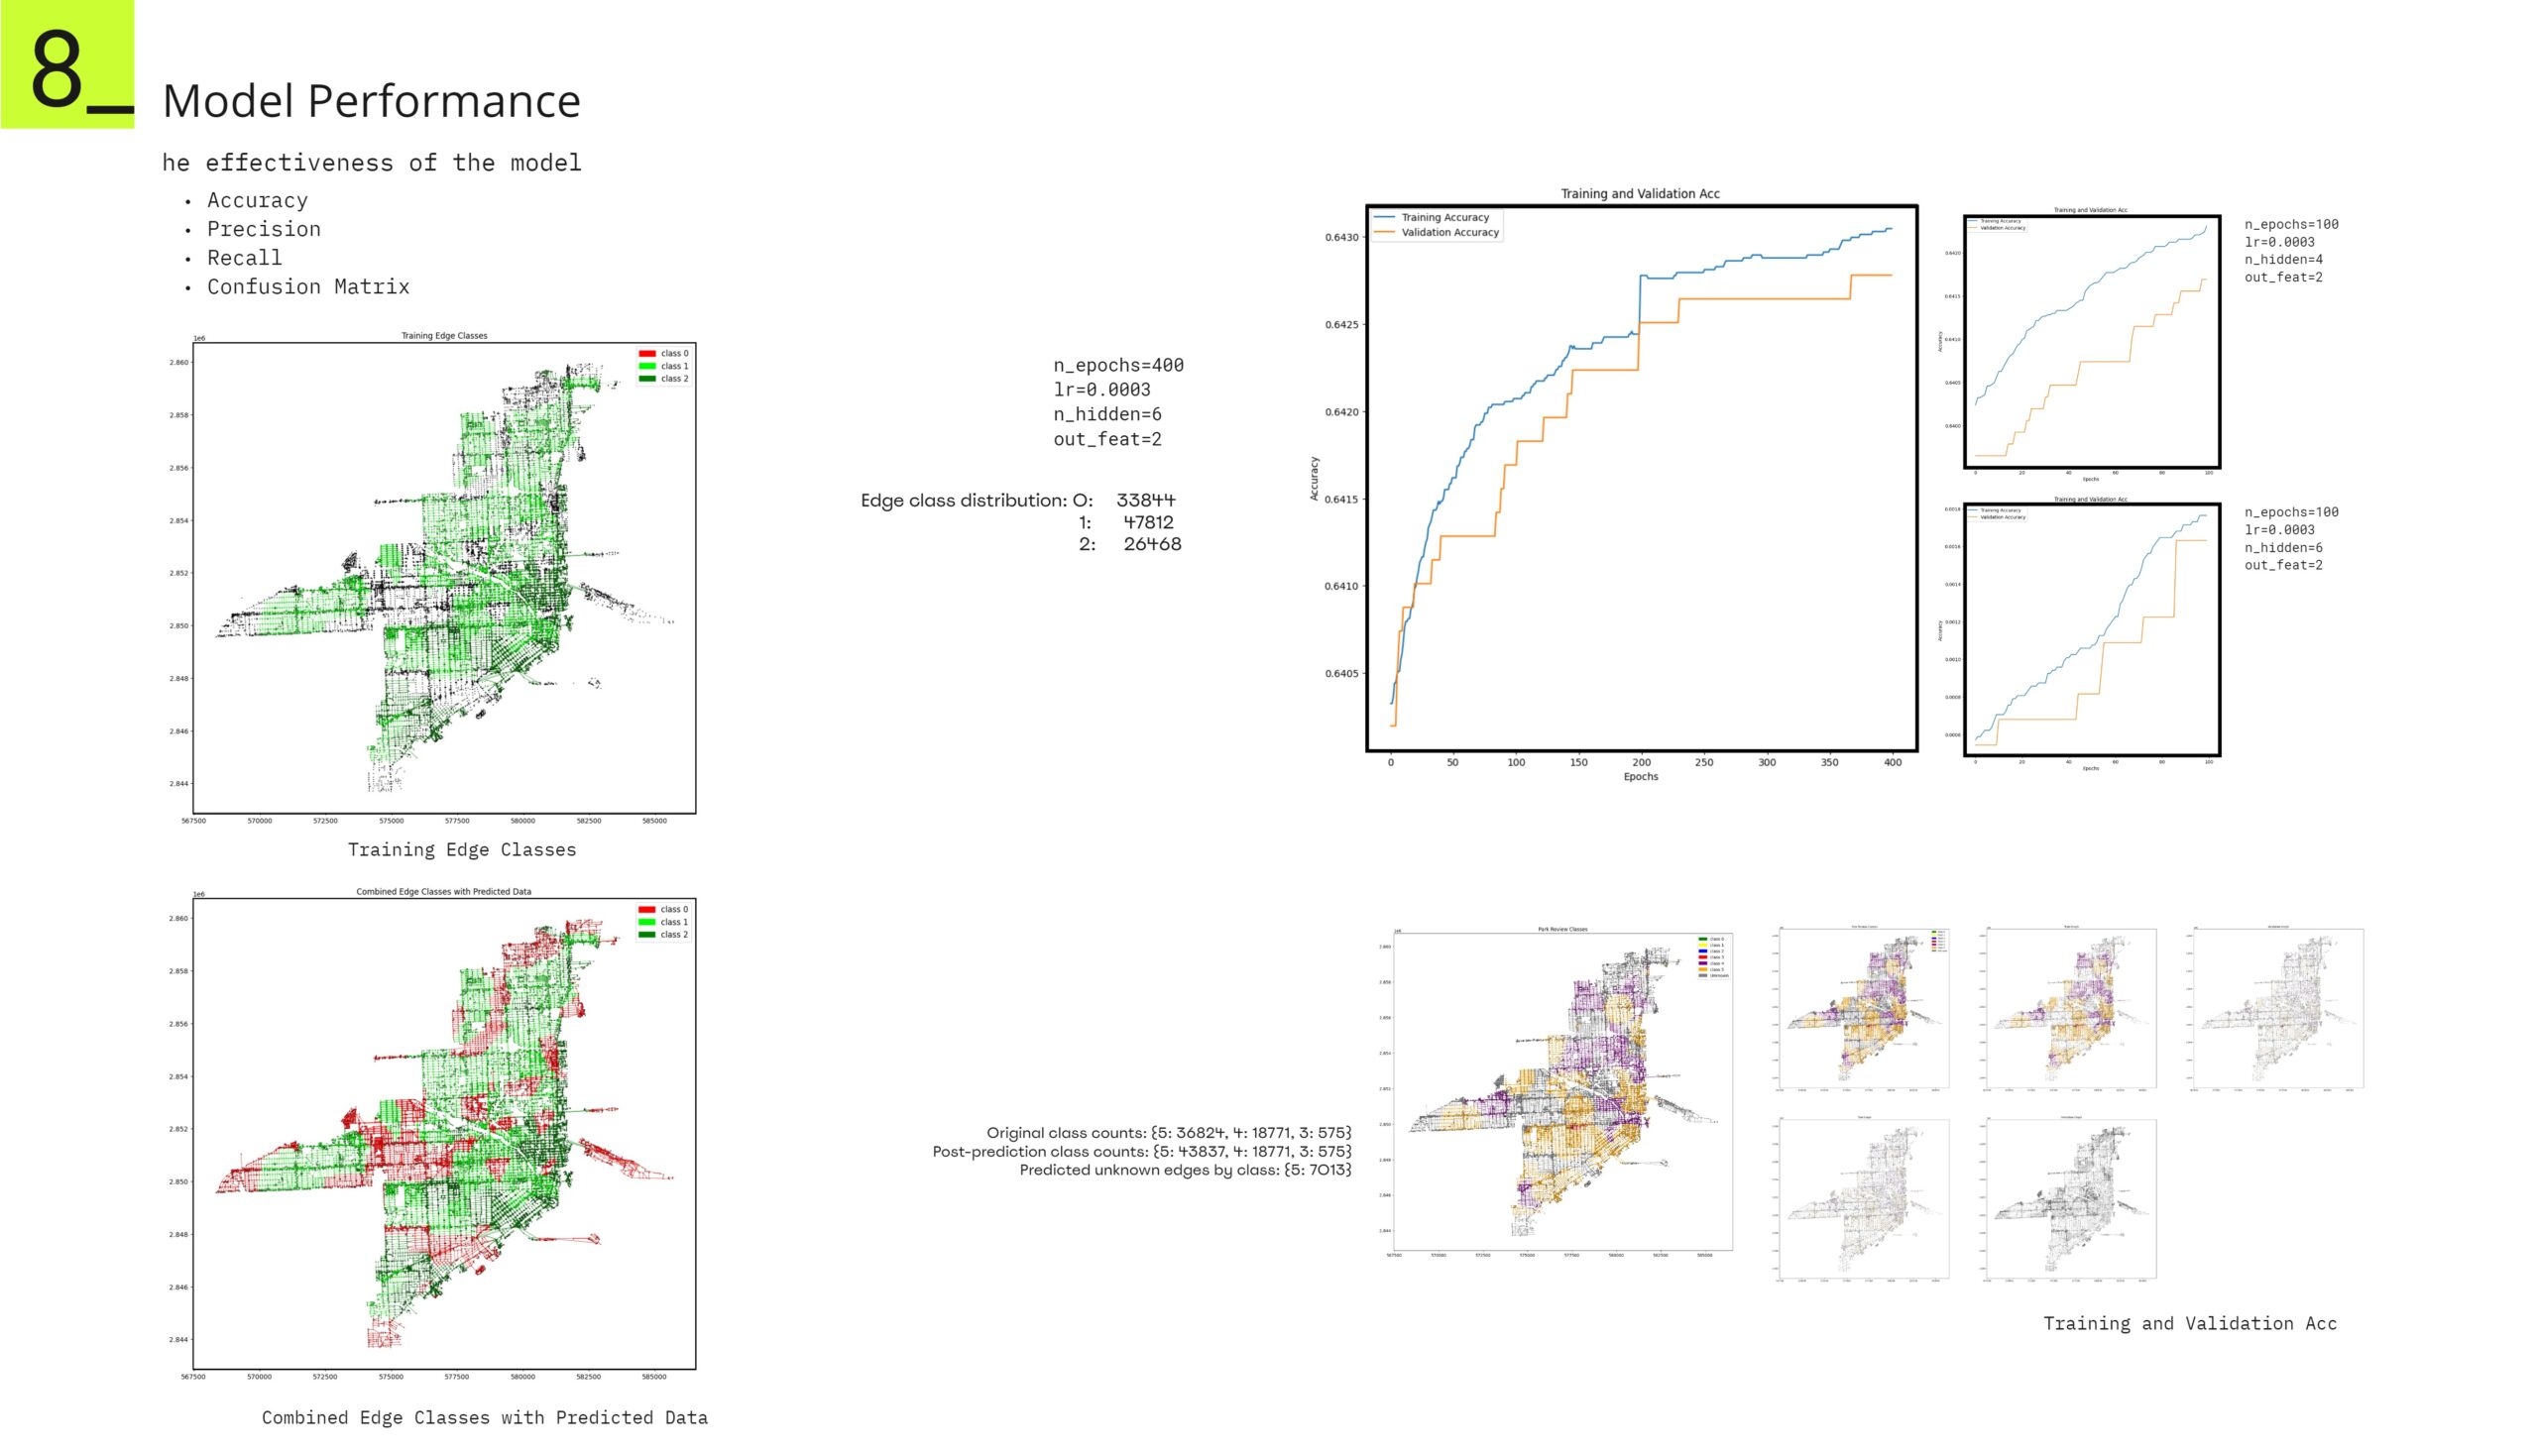
We provides an in-depth analysis of how effectively our machine learning model classifies these interconnected elements. Key metrics such as accuracy, precision, recall, and the confusion matrix are used to evaluate the model’s performance.
The top-left plot displays the distribution of edge classes used in training, while the bottom-left plot compares actual edge classes with predicted data, showcasing the model’s predictive accuracy. The distribution of edge classes is detailed, with specific counts for each class.
The top-right plots track the training and validation accuracy over multiple epochs, offering insights into the model’s learning process and generalization capabilities. Additionally, the bottom-right section compares the original class counts with post-prediction counts, highlighting the changes induced by the model and identifying the number of previously unknown edges it predicted.
Conclusion/ Learning:
In the end, using features these features we were able to predict teh park score class with a limited accuracy
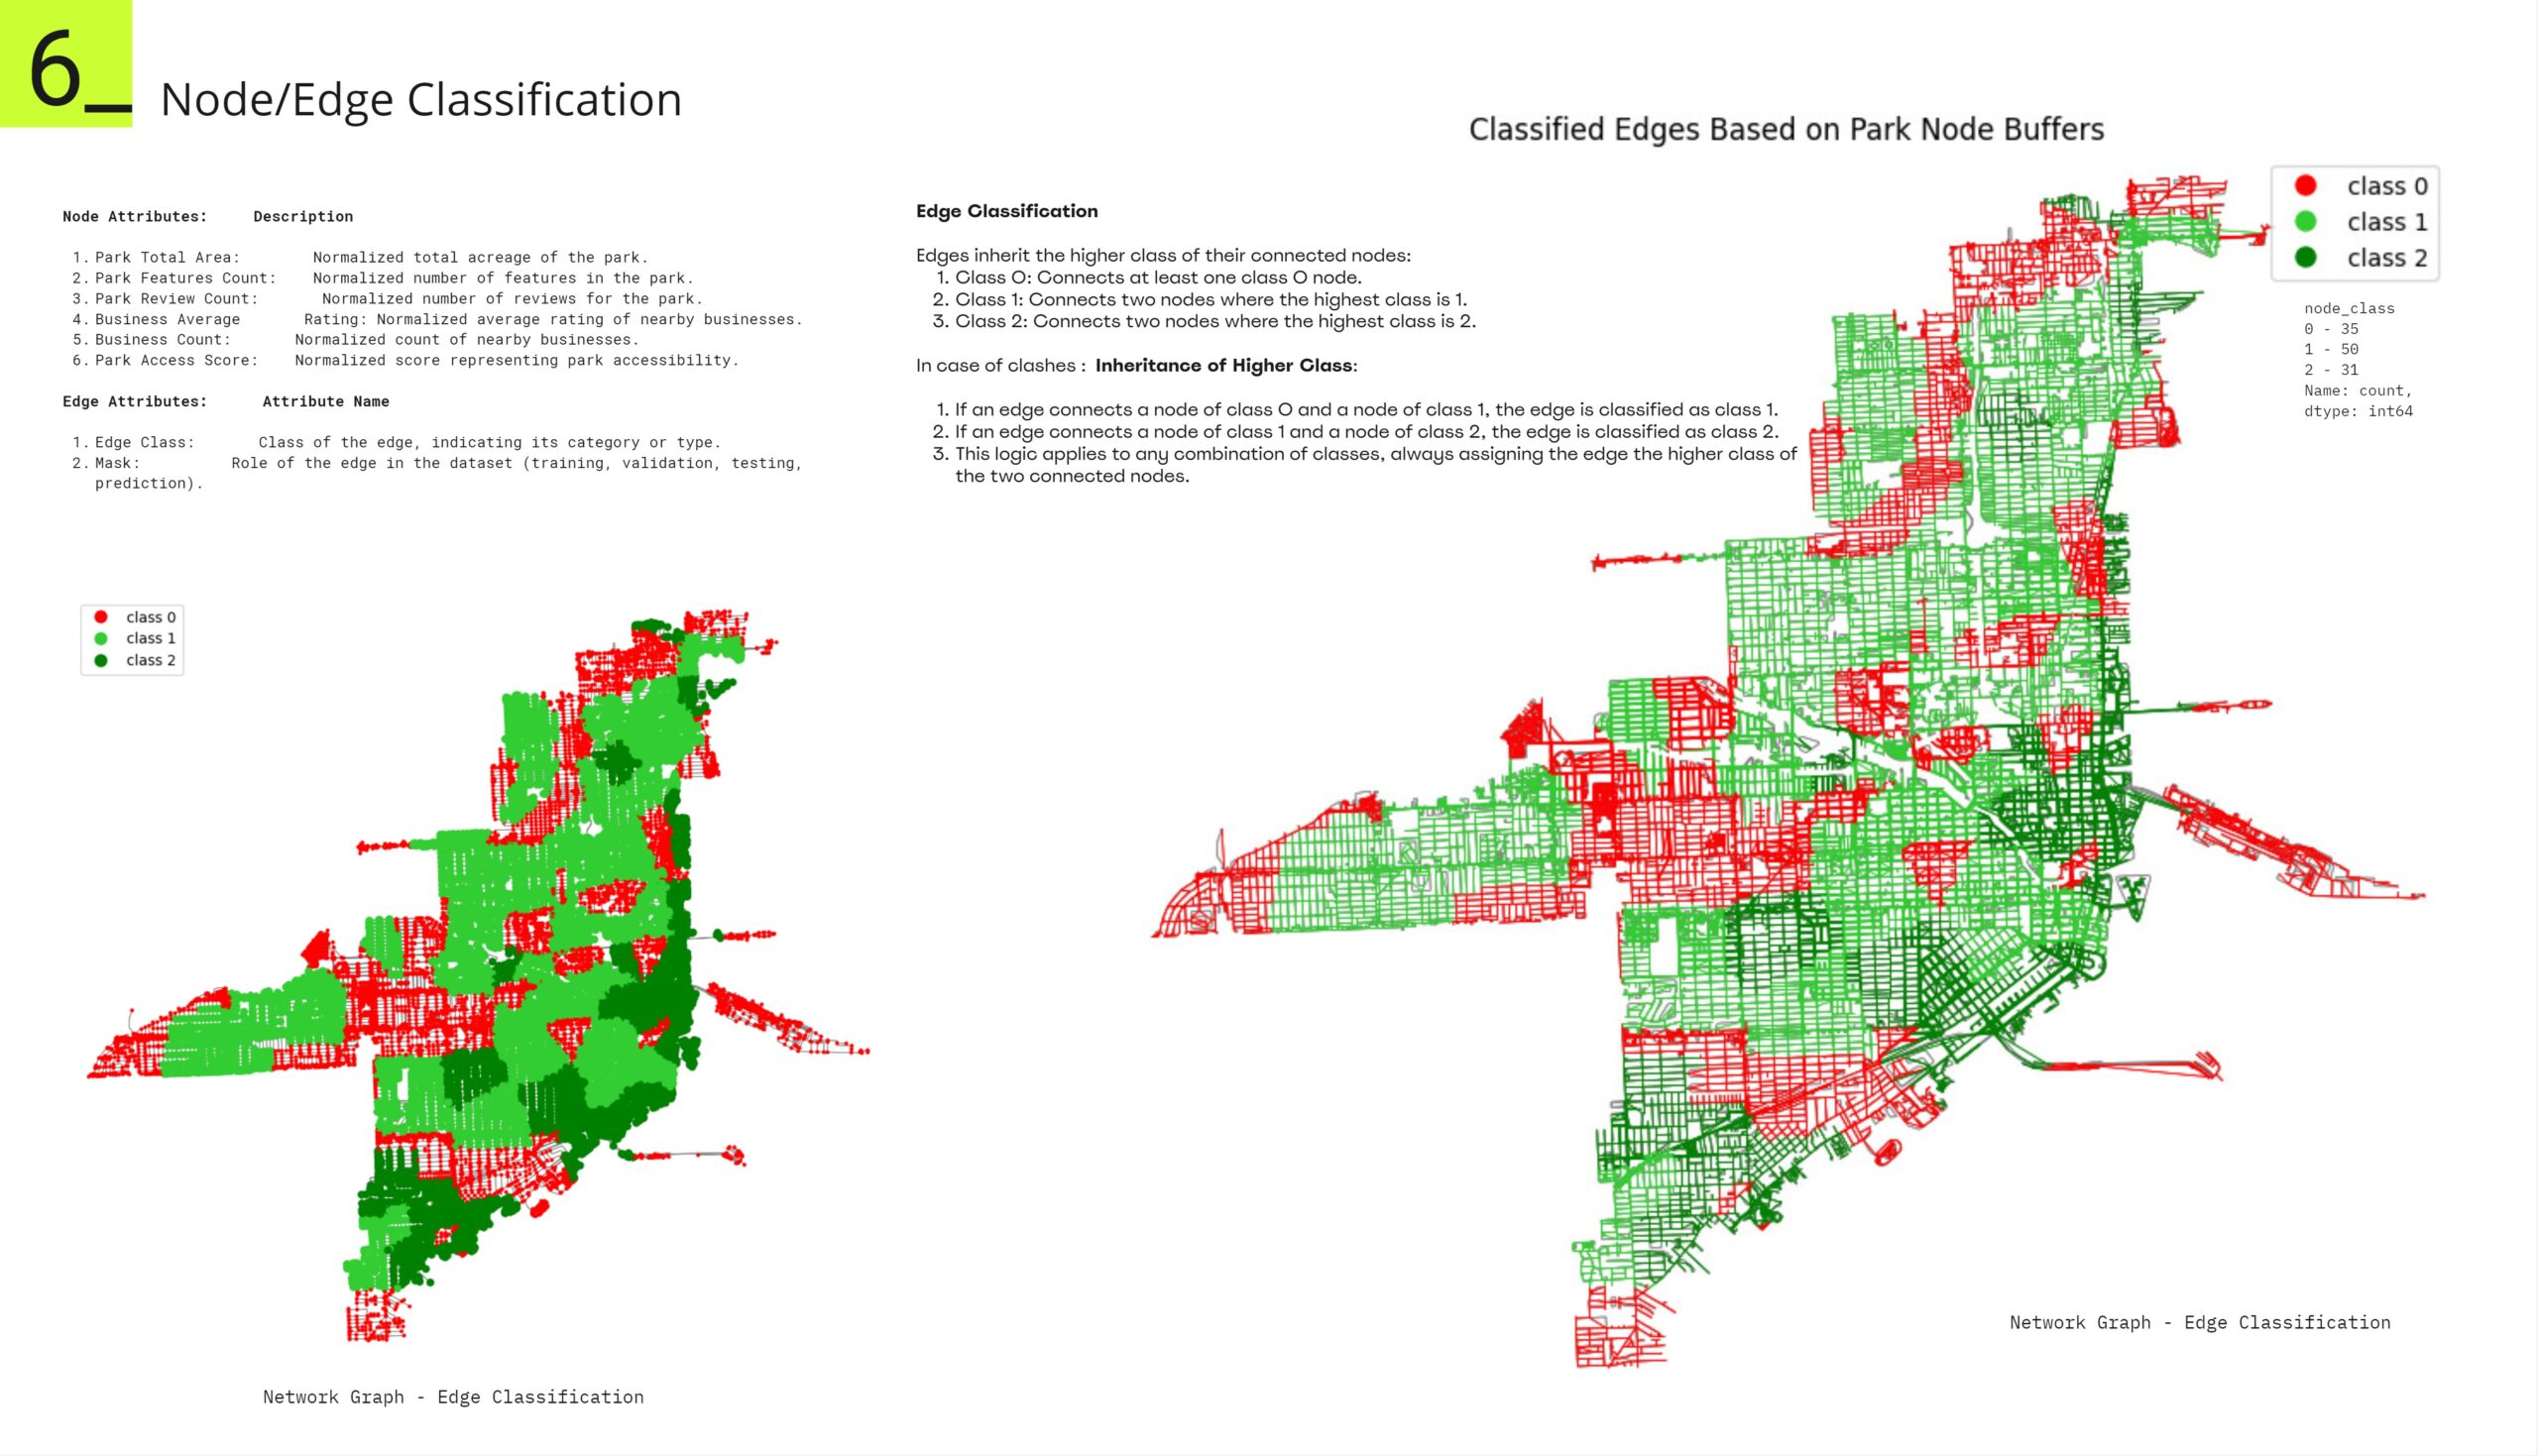
Park Total Area: Normalized total acreage of the park.
Park Features Count: Normalized number of features in the park.
Park Review Count: Normalized number of reviews for the park.
Business Average Rating: Normalized average rating of nearby businesses.
Business Count: Normalized count of nearby businesses.
Park Access Score: Normalized score representing park accessibility.
What we’ve learnt is that these features although ahve a considerabel impact on user reviws of the parks, these are certainly not enough to predict user ratings accurately (or to a certain accuracy). A lot of other social, economic and urban varaibles are to be included in these studies check their correlation wiuth the user ratings of the parks.
A case can also be made that predicting user ratings, in the end, is also not the best strategy. user rating on social websites can become very difficult to predict based on tangible objective data sources. So we also made an attempt to score the parks ourselves. Create a scoring mechanism which is based on park amenities, park areas, public access to the park etc and that model performs exceptionally well to predict park scores for missing data sets.
Miami_Parks is a project of IaaC, Institute for Advanced Architecture of Catalonia developed at Master in Advanced Computation for Architecture & Design in 2023-24 by Students: Mohammad Abid, Agustin Salas under the supervision of Faculty: David Andrés León, Olga Poletkina, Erida Bendo
