Skin Sense is a project that aims to help users optimize the thermal comfort of their interior spaces by applying skin shaders.
Why implement this?
- Energy Efficiency
- It will improve the occupant’s comfort
- The decisions made are data-driven
- Economics benefits
- and advanced predictive capabilities
What can skin sense help the user with?
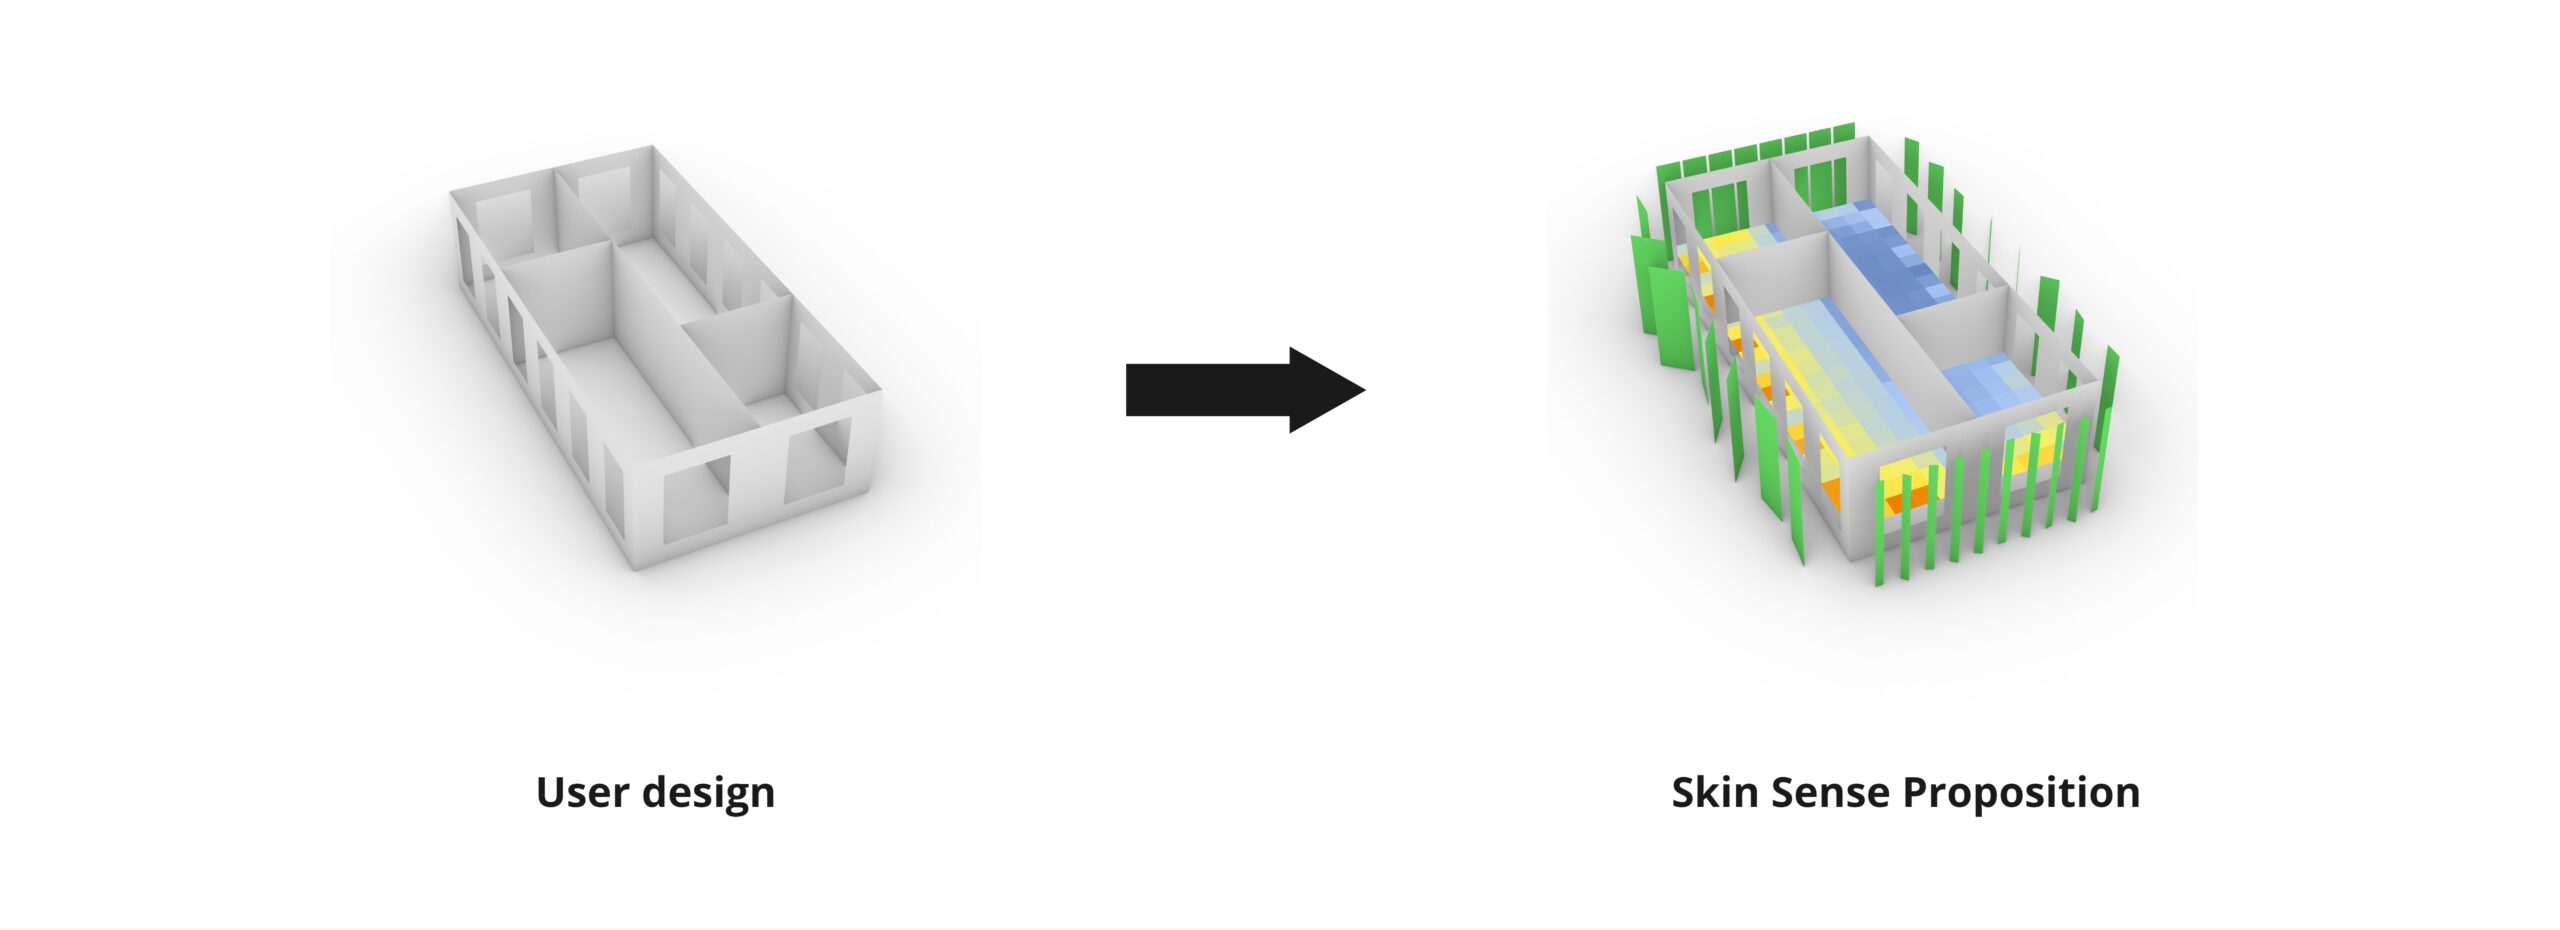
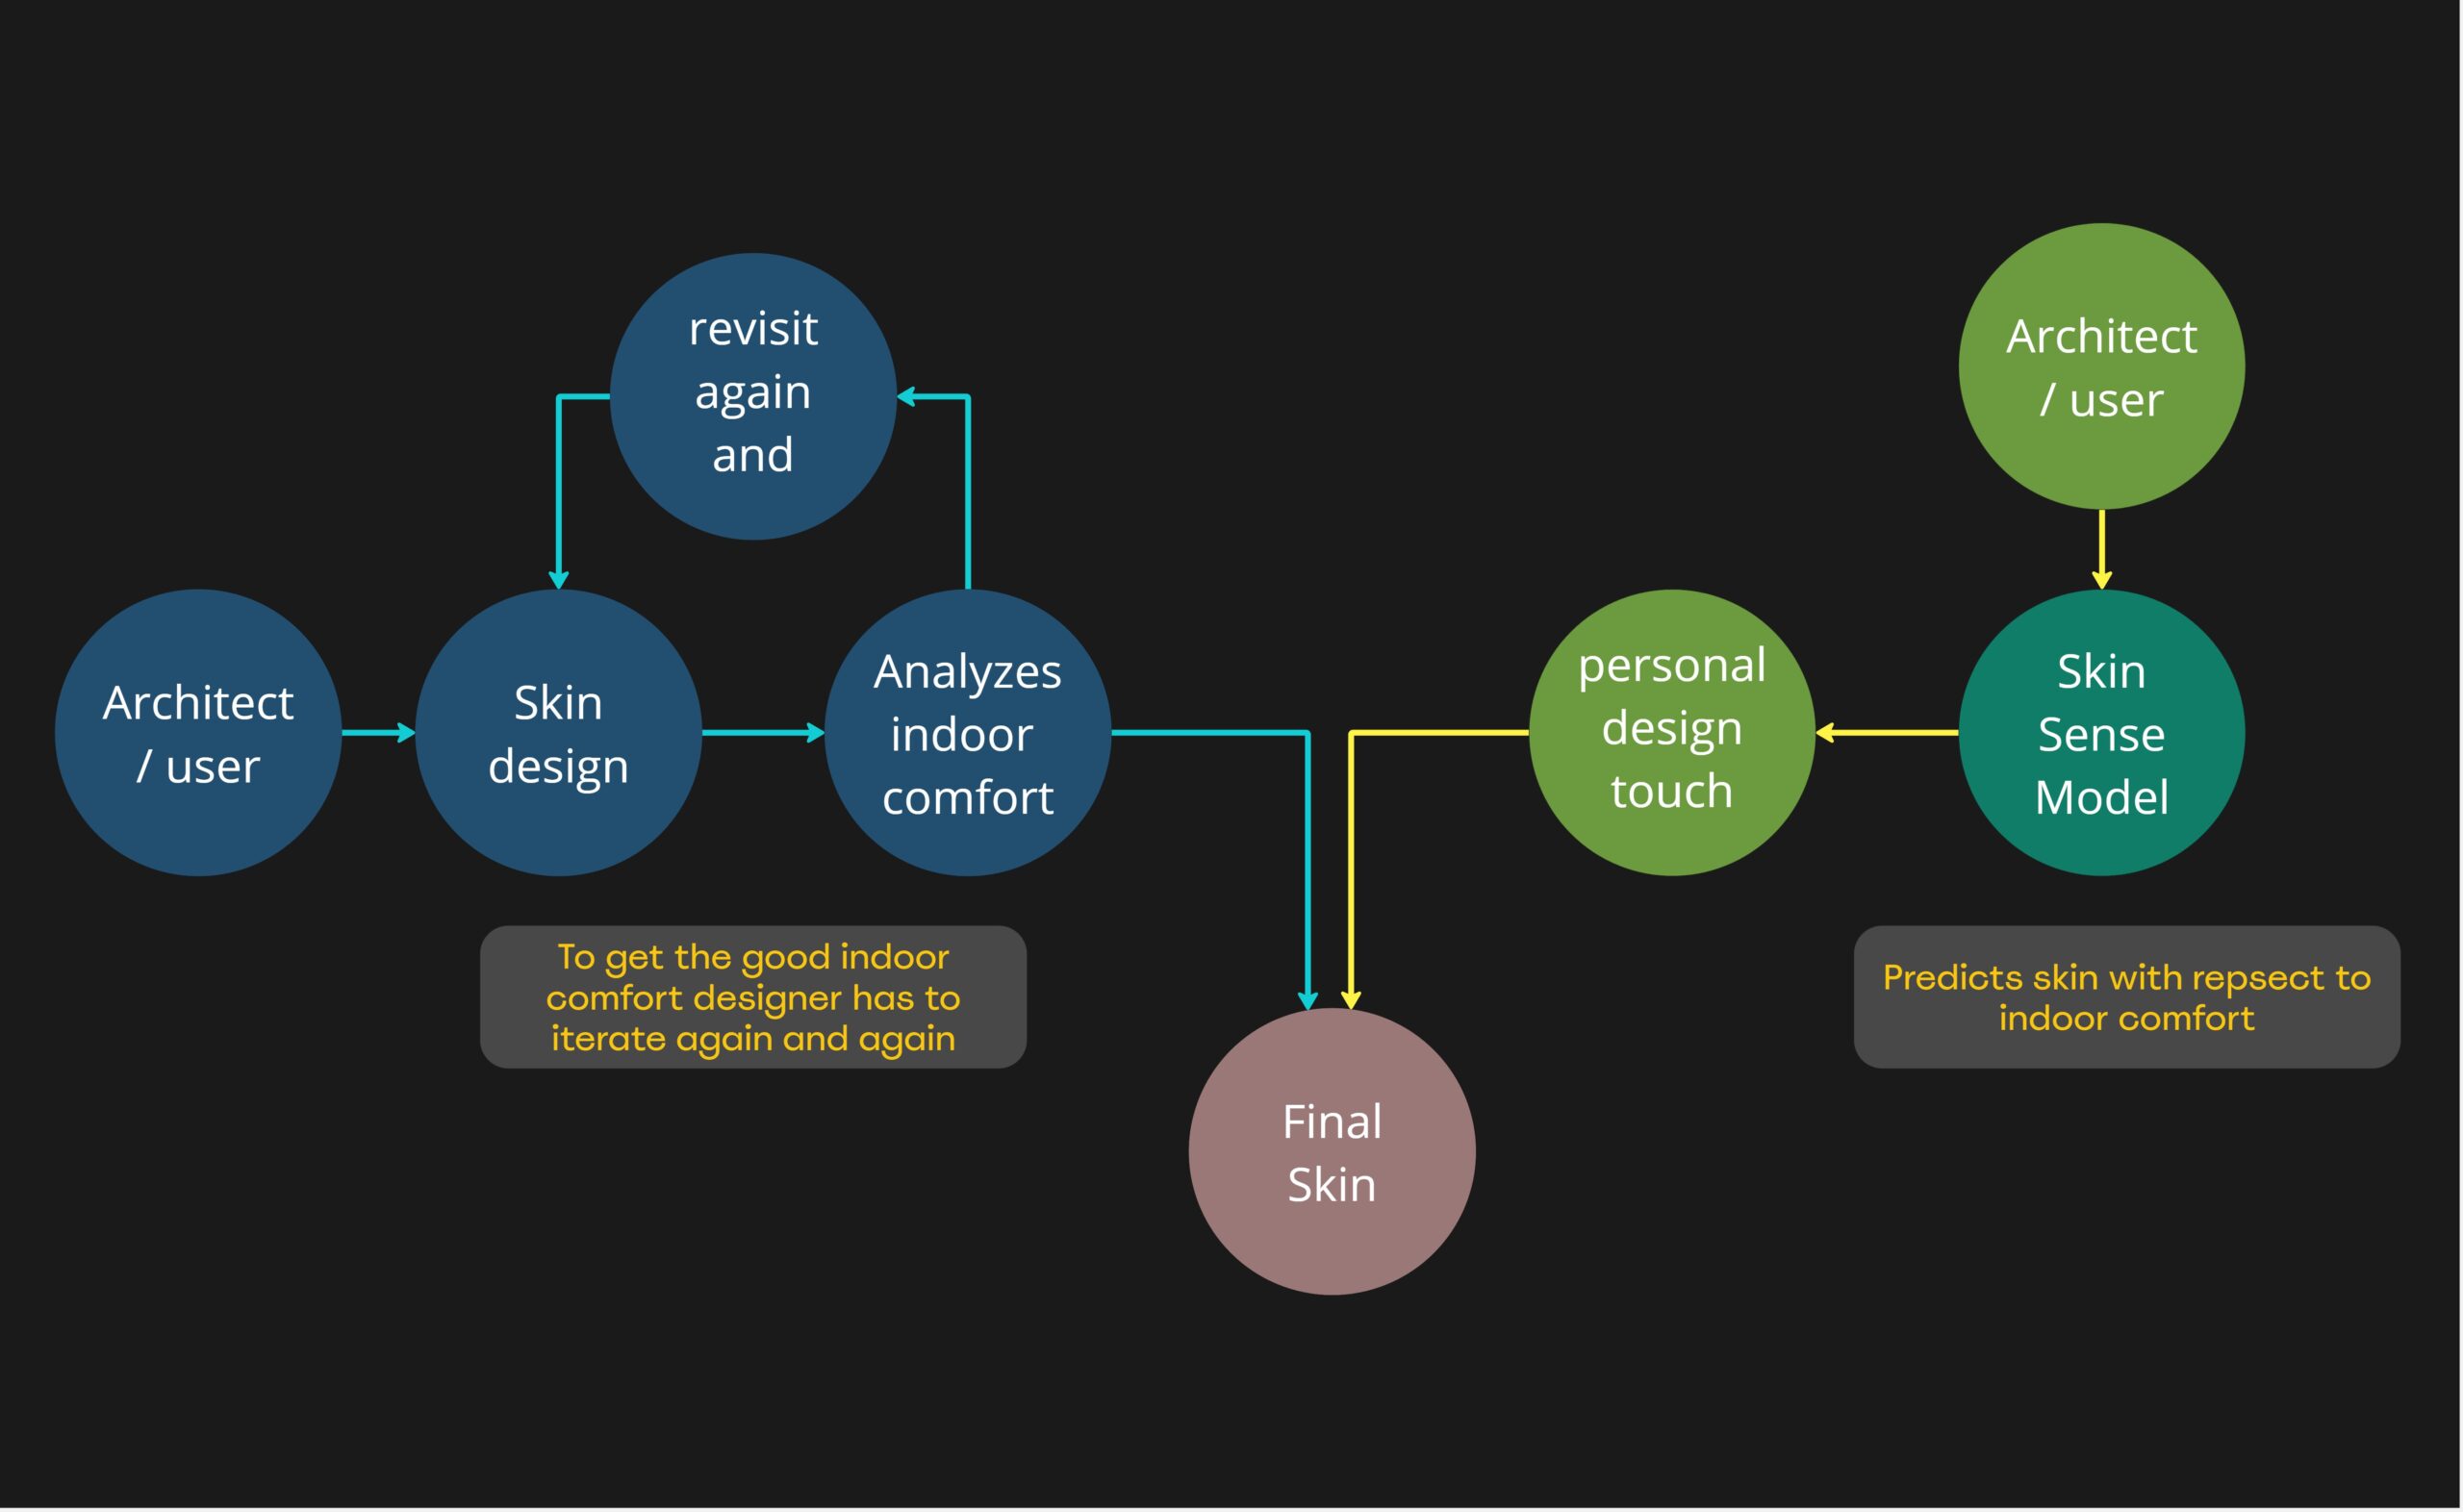
Once the designer designs the skin for the building facade it has to be analyzed for indoor comfort. To analyze indoor comfort with low error tolerance the user has to make an environmental script usually done by Ladybug and Honeybee tools, which for complex designs can take very long to compute or will keep throwing errors, and if they don’t get the required comfort values they have go again and again through this tedious process
Skin Sense here comes into the role and helps architects and designers by predicting the skin typology for a given context. It also provides a heat map where users can check simultaneously if the provided skin typology provides indoor comfort as per needs or not. It also has a feature to predict the indoor comfort heat map when no skin is applied helping users to make decisions easily.
Datasets
For our Dataset generation,
Our targeted Architectural space will be office buildings,
For simplification, we are taking only one floor of a building and making parametric layout distributions to be able to explore different layouts, and we also vary the opening sizes for our dataset.

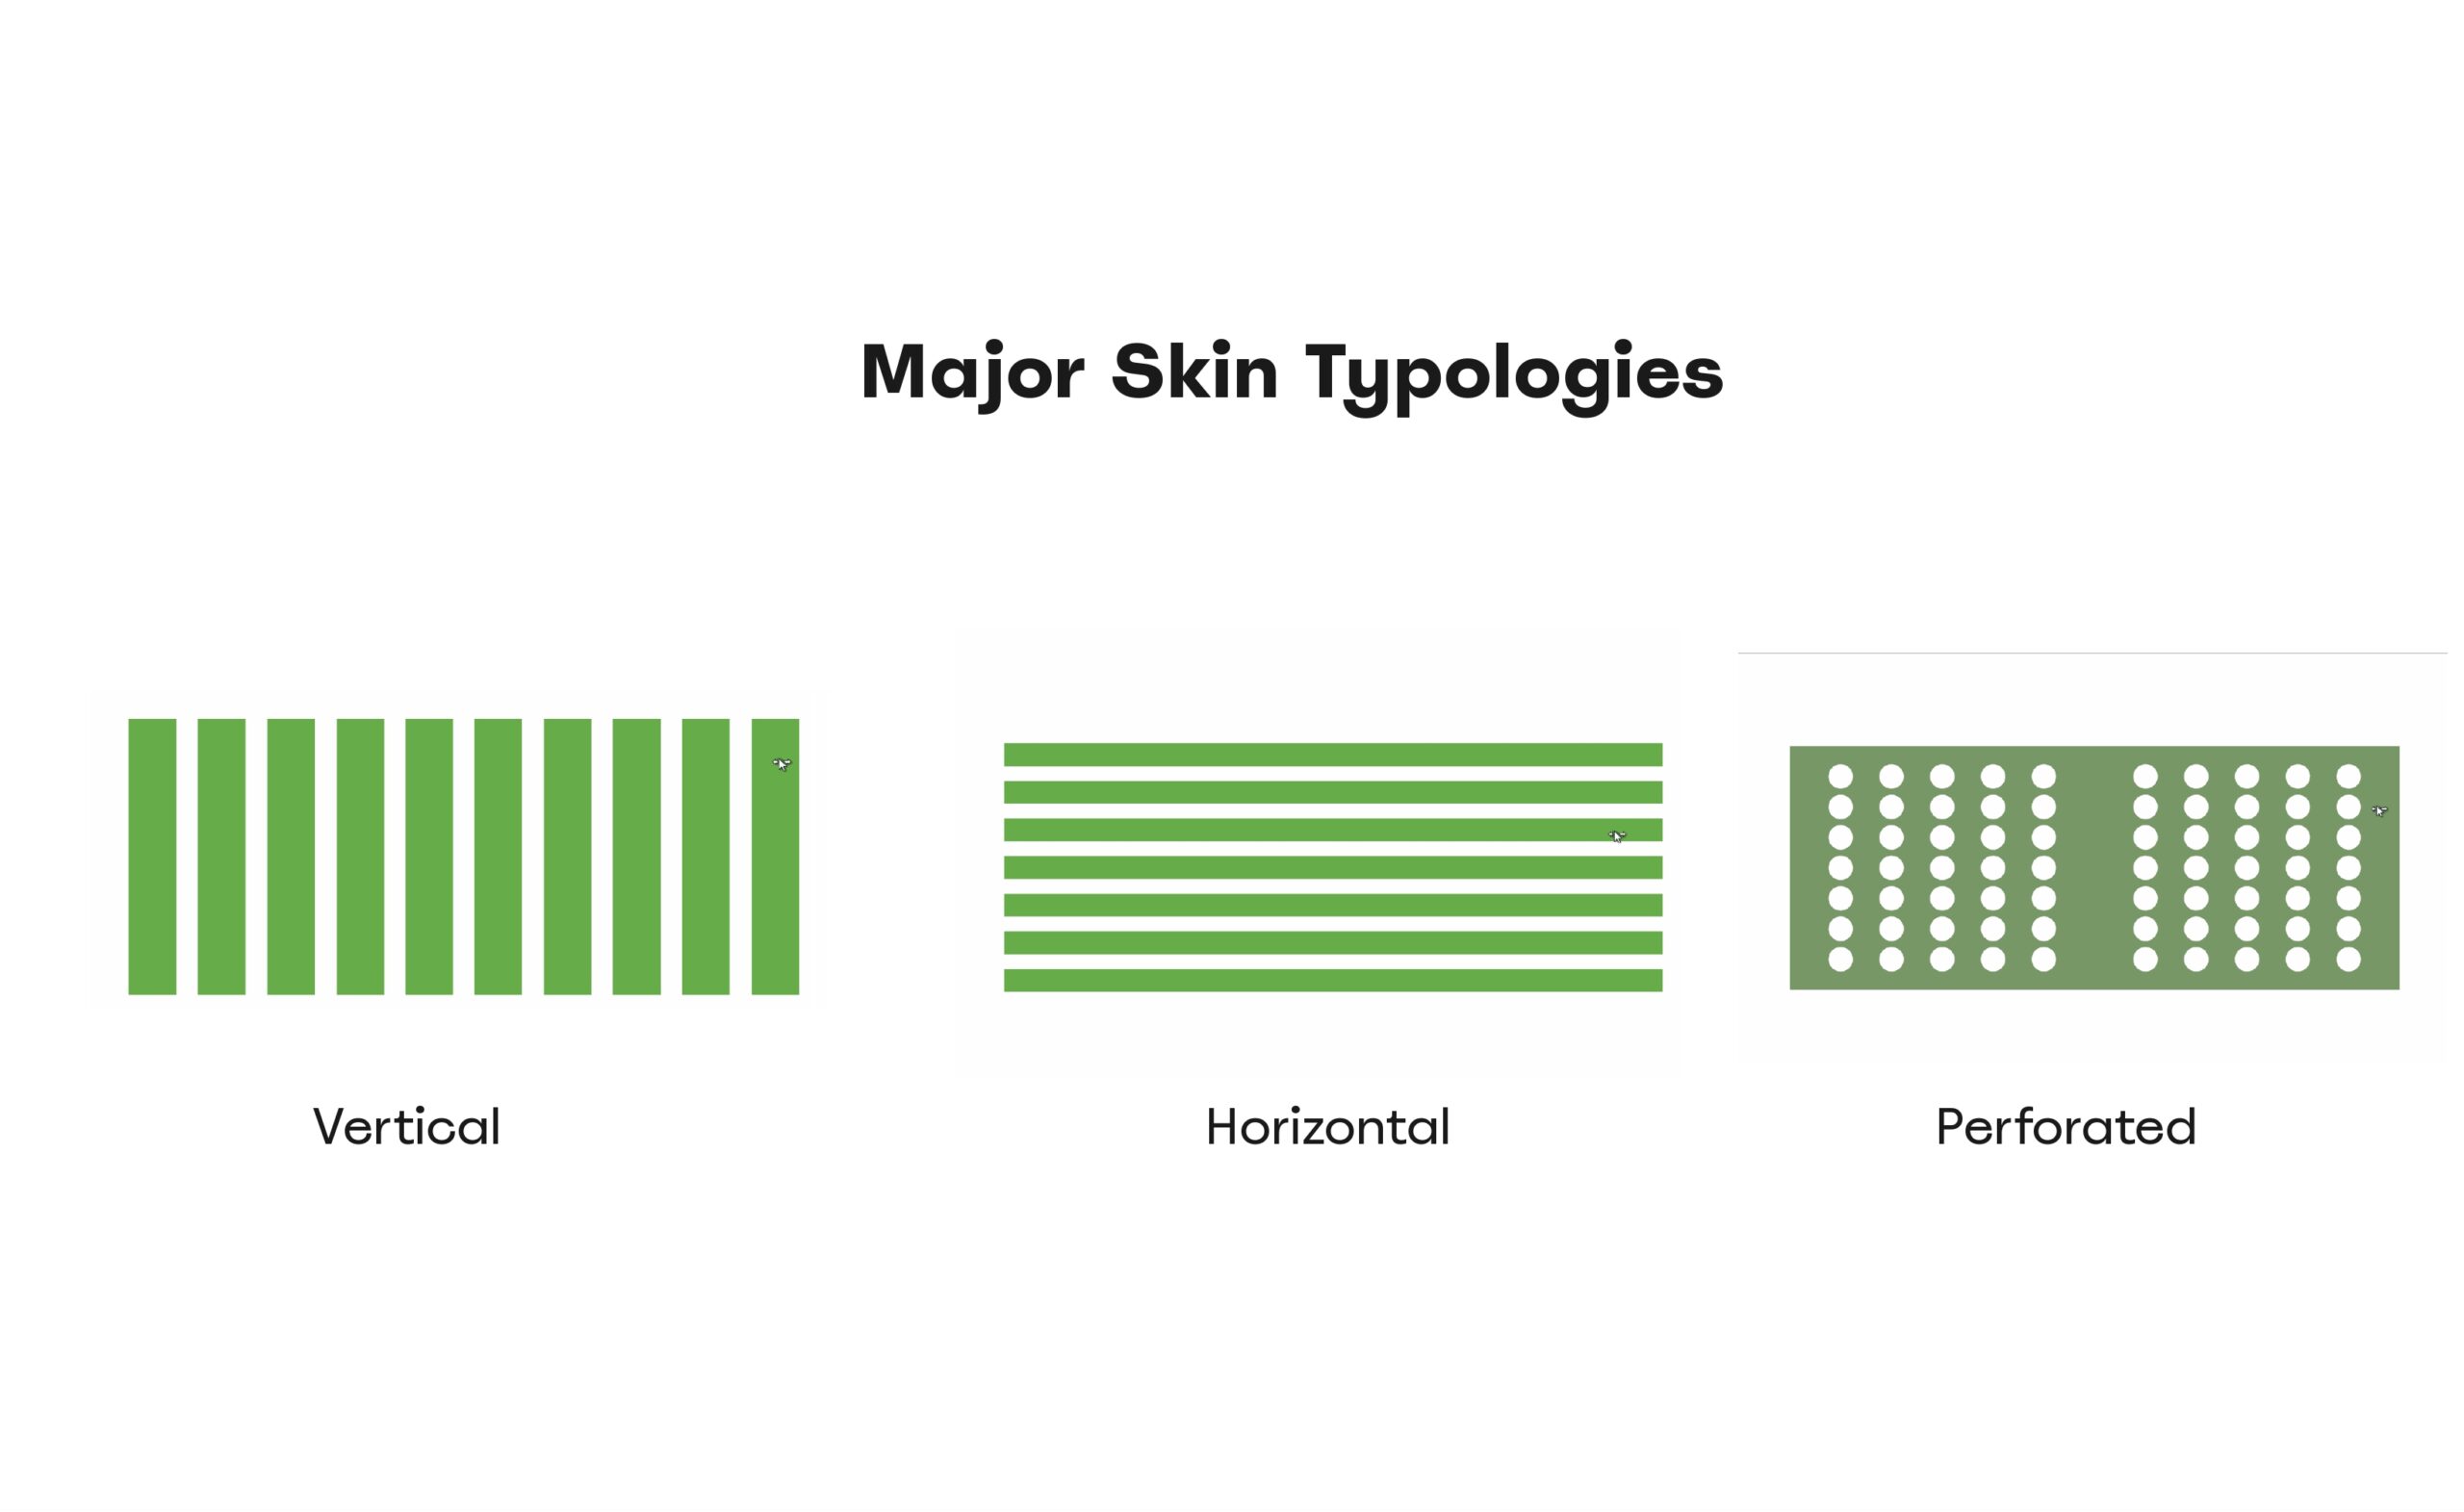
Parametric models for the most commonly used shaders. Vertical, Horizontal, and perforated are created so that we can easily change the values
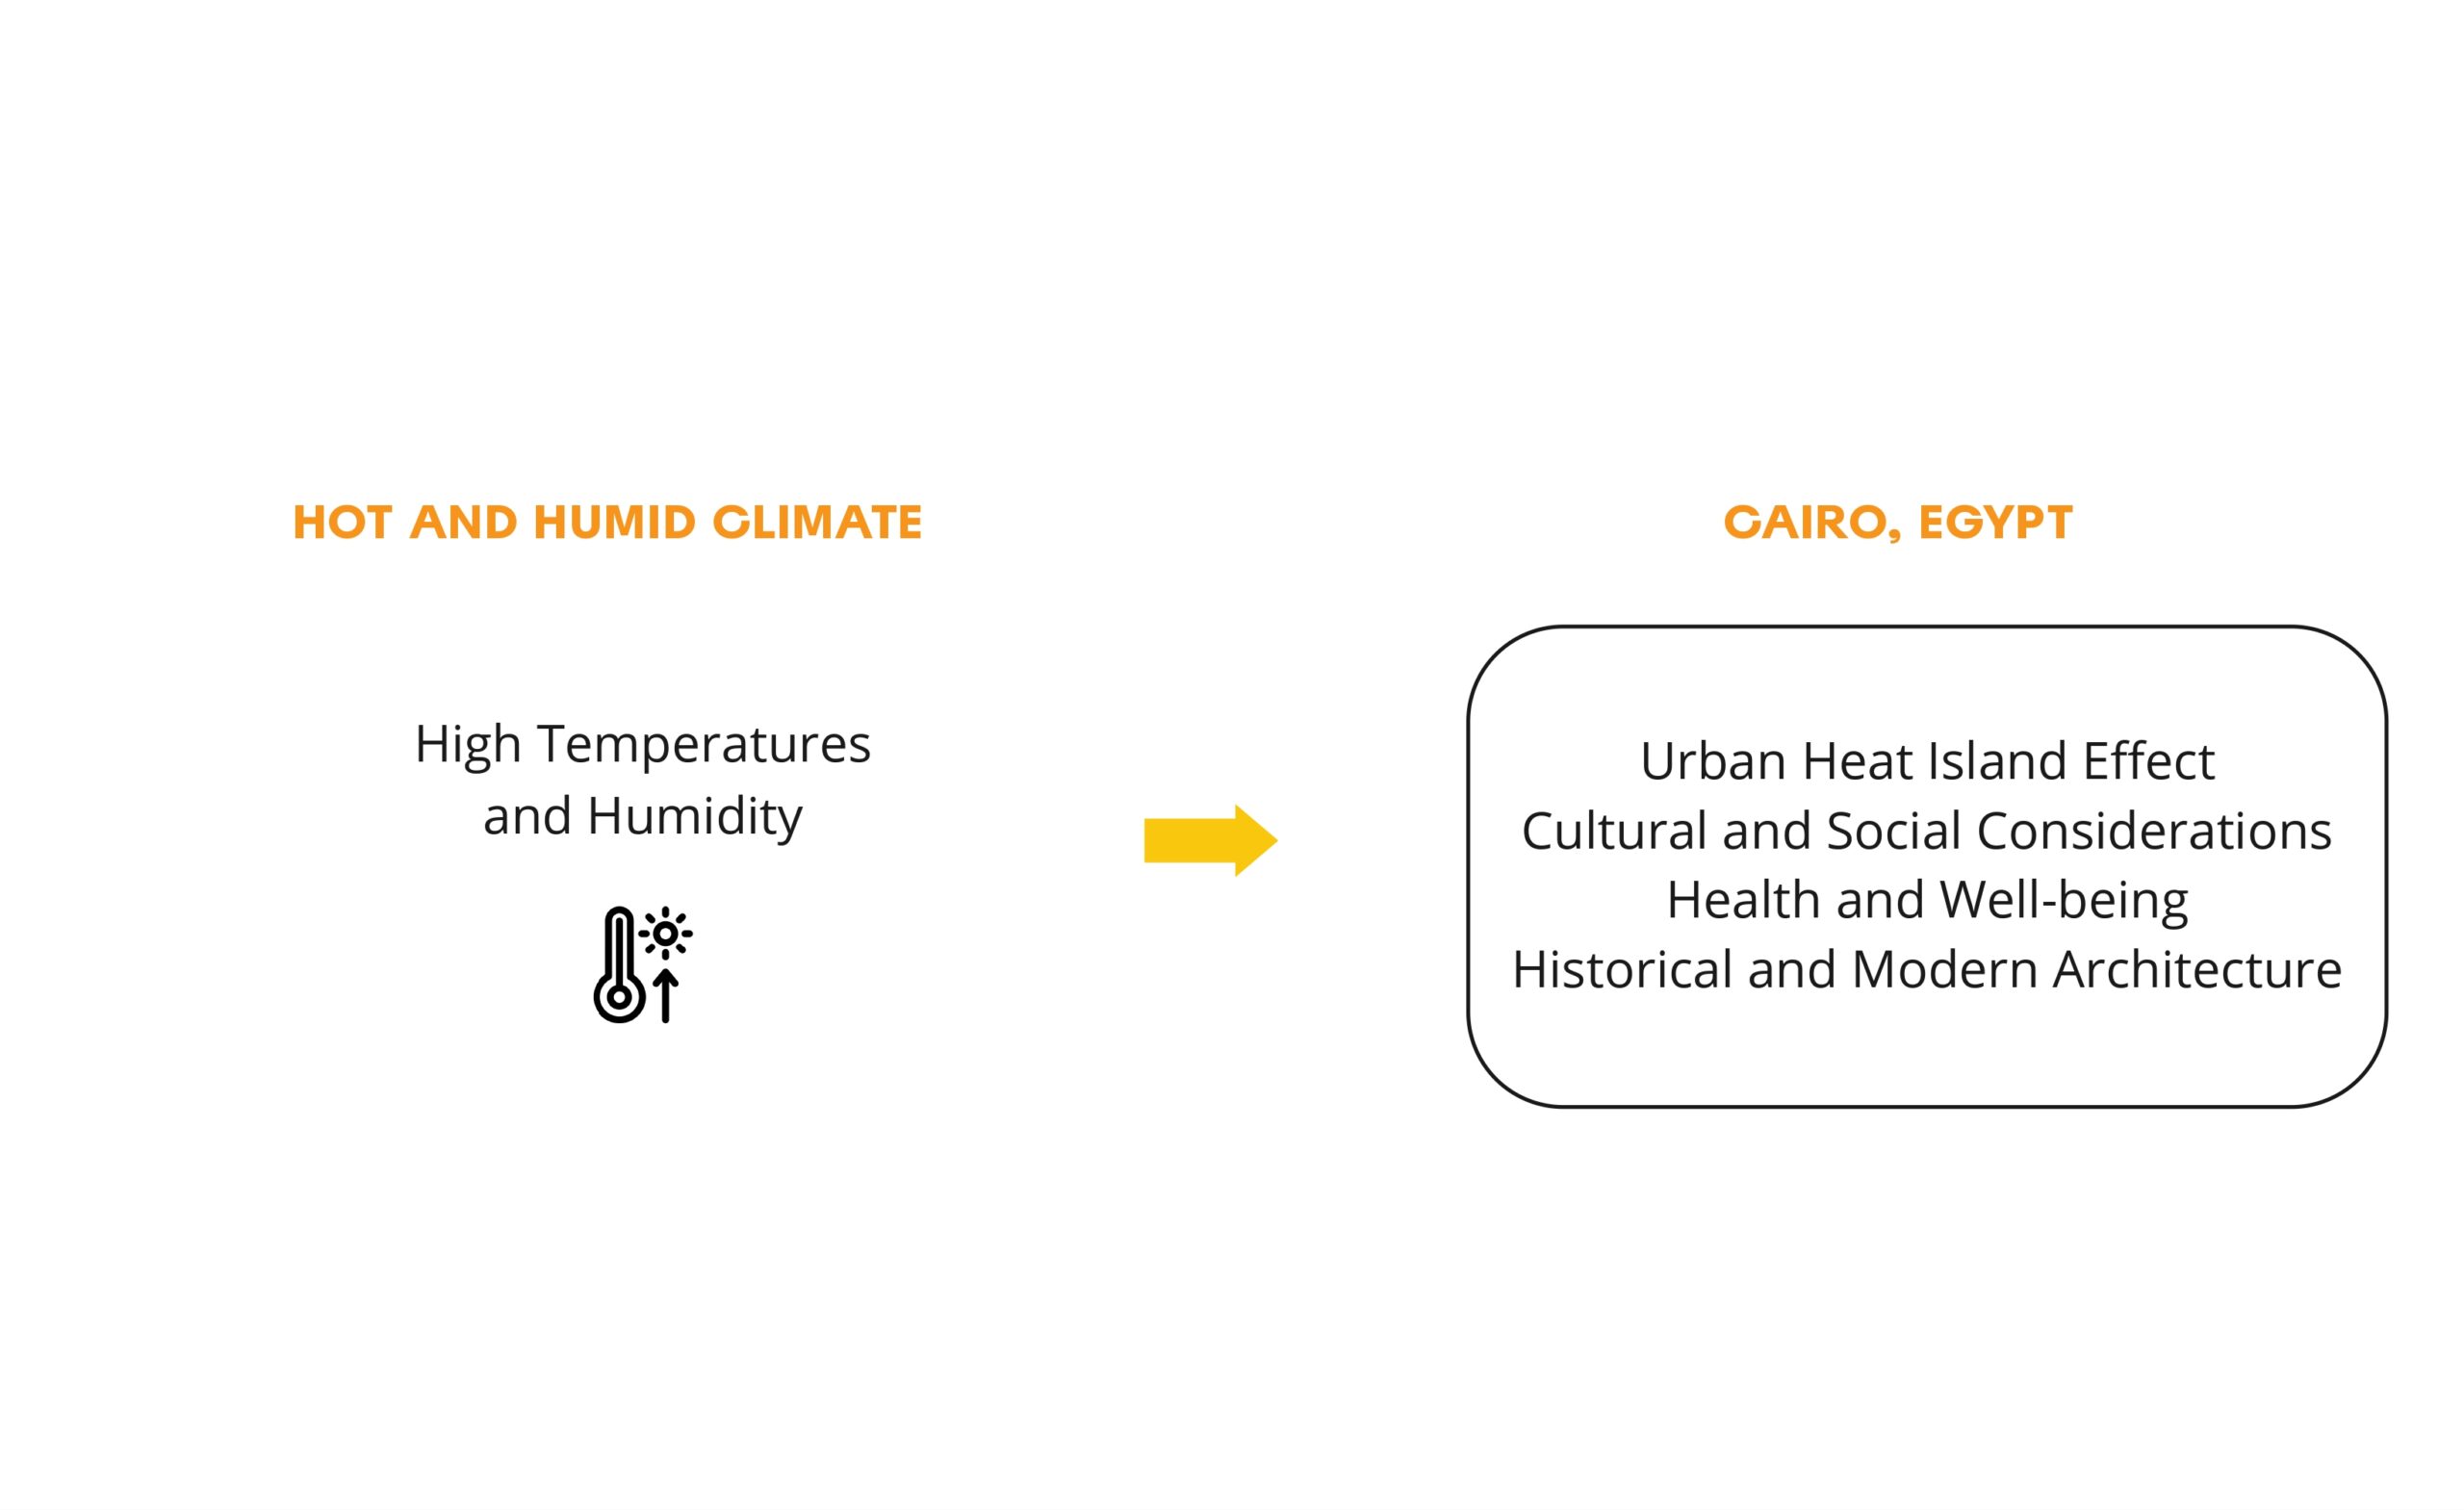
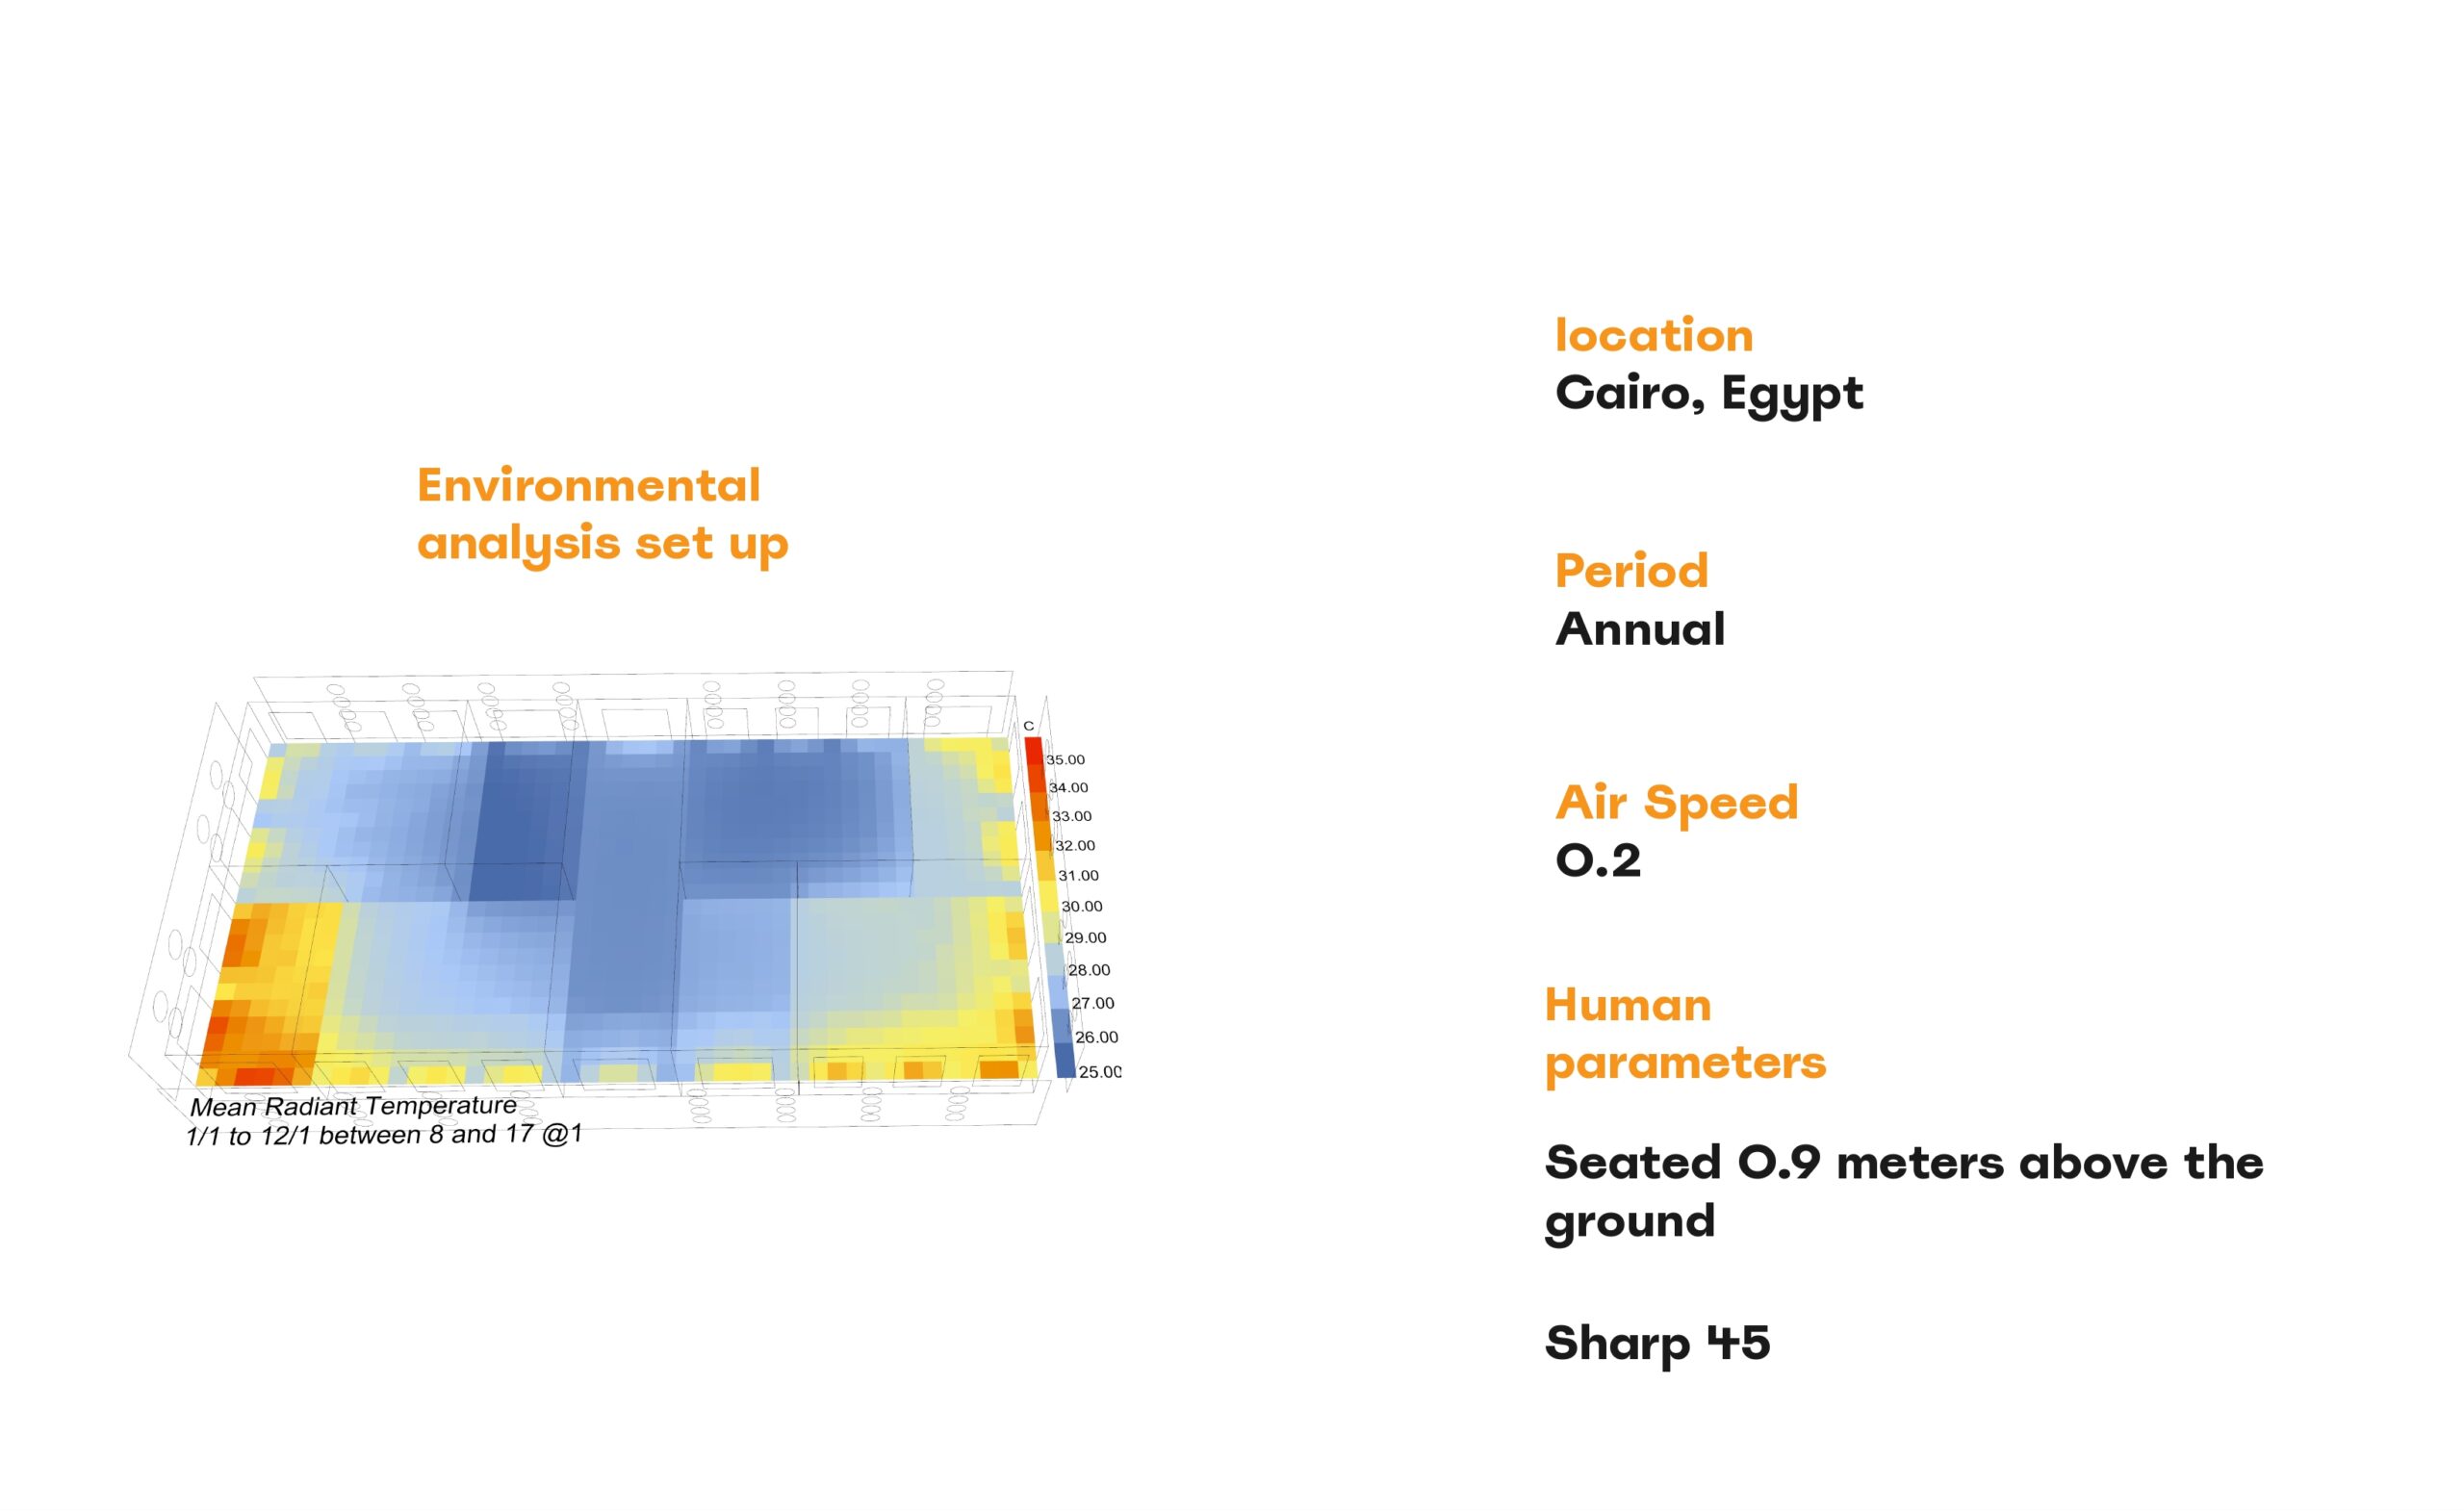
At the same time, we set up an environmental analysis Script for our typologies shown in the previous slides, focusing on hot and humid climate zones we start with Cairo, Egypt, as it is currently one of the densest cities buildings-wise and population-wise.
Our thermal comfort will be determined by the MRT and here are some parameters from the setup such as annual period air speed set up according to the ASHRAE 55 Code and also the human parameters using this space, capping the performance map color gradient between 25 degrees to 35 degrees.
Workflow
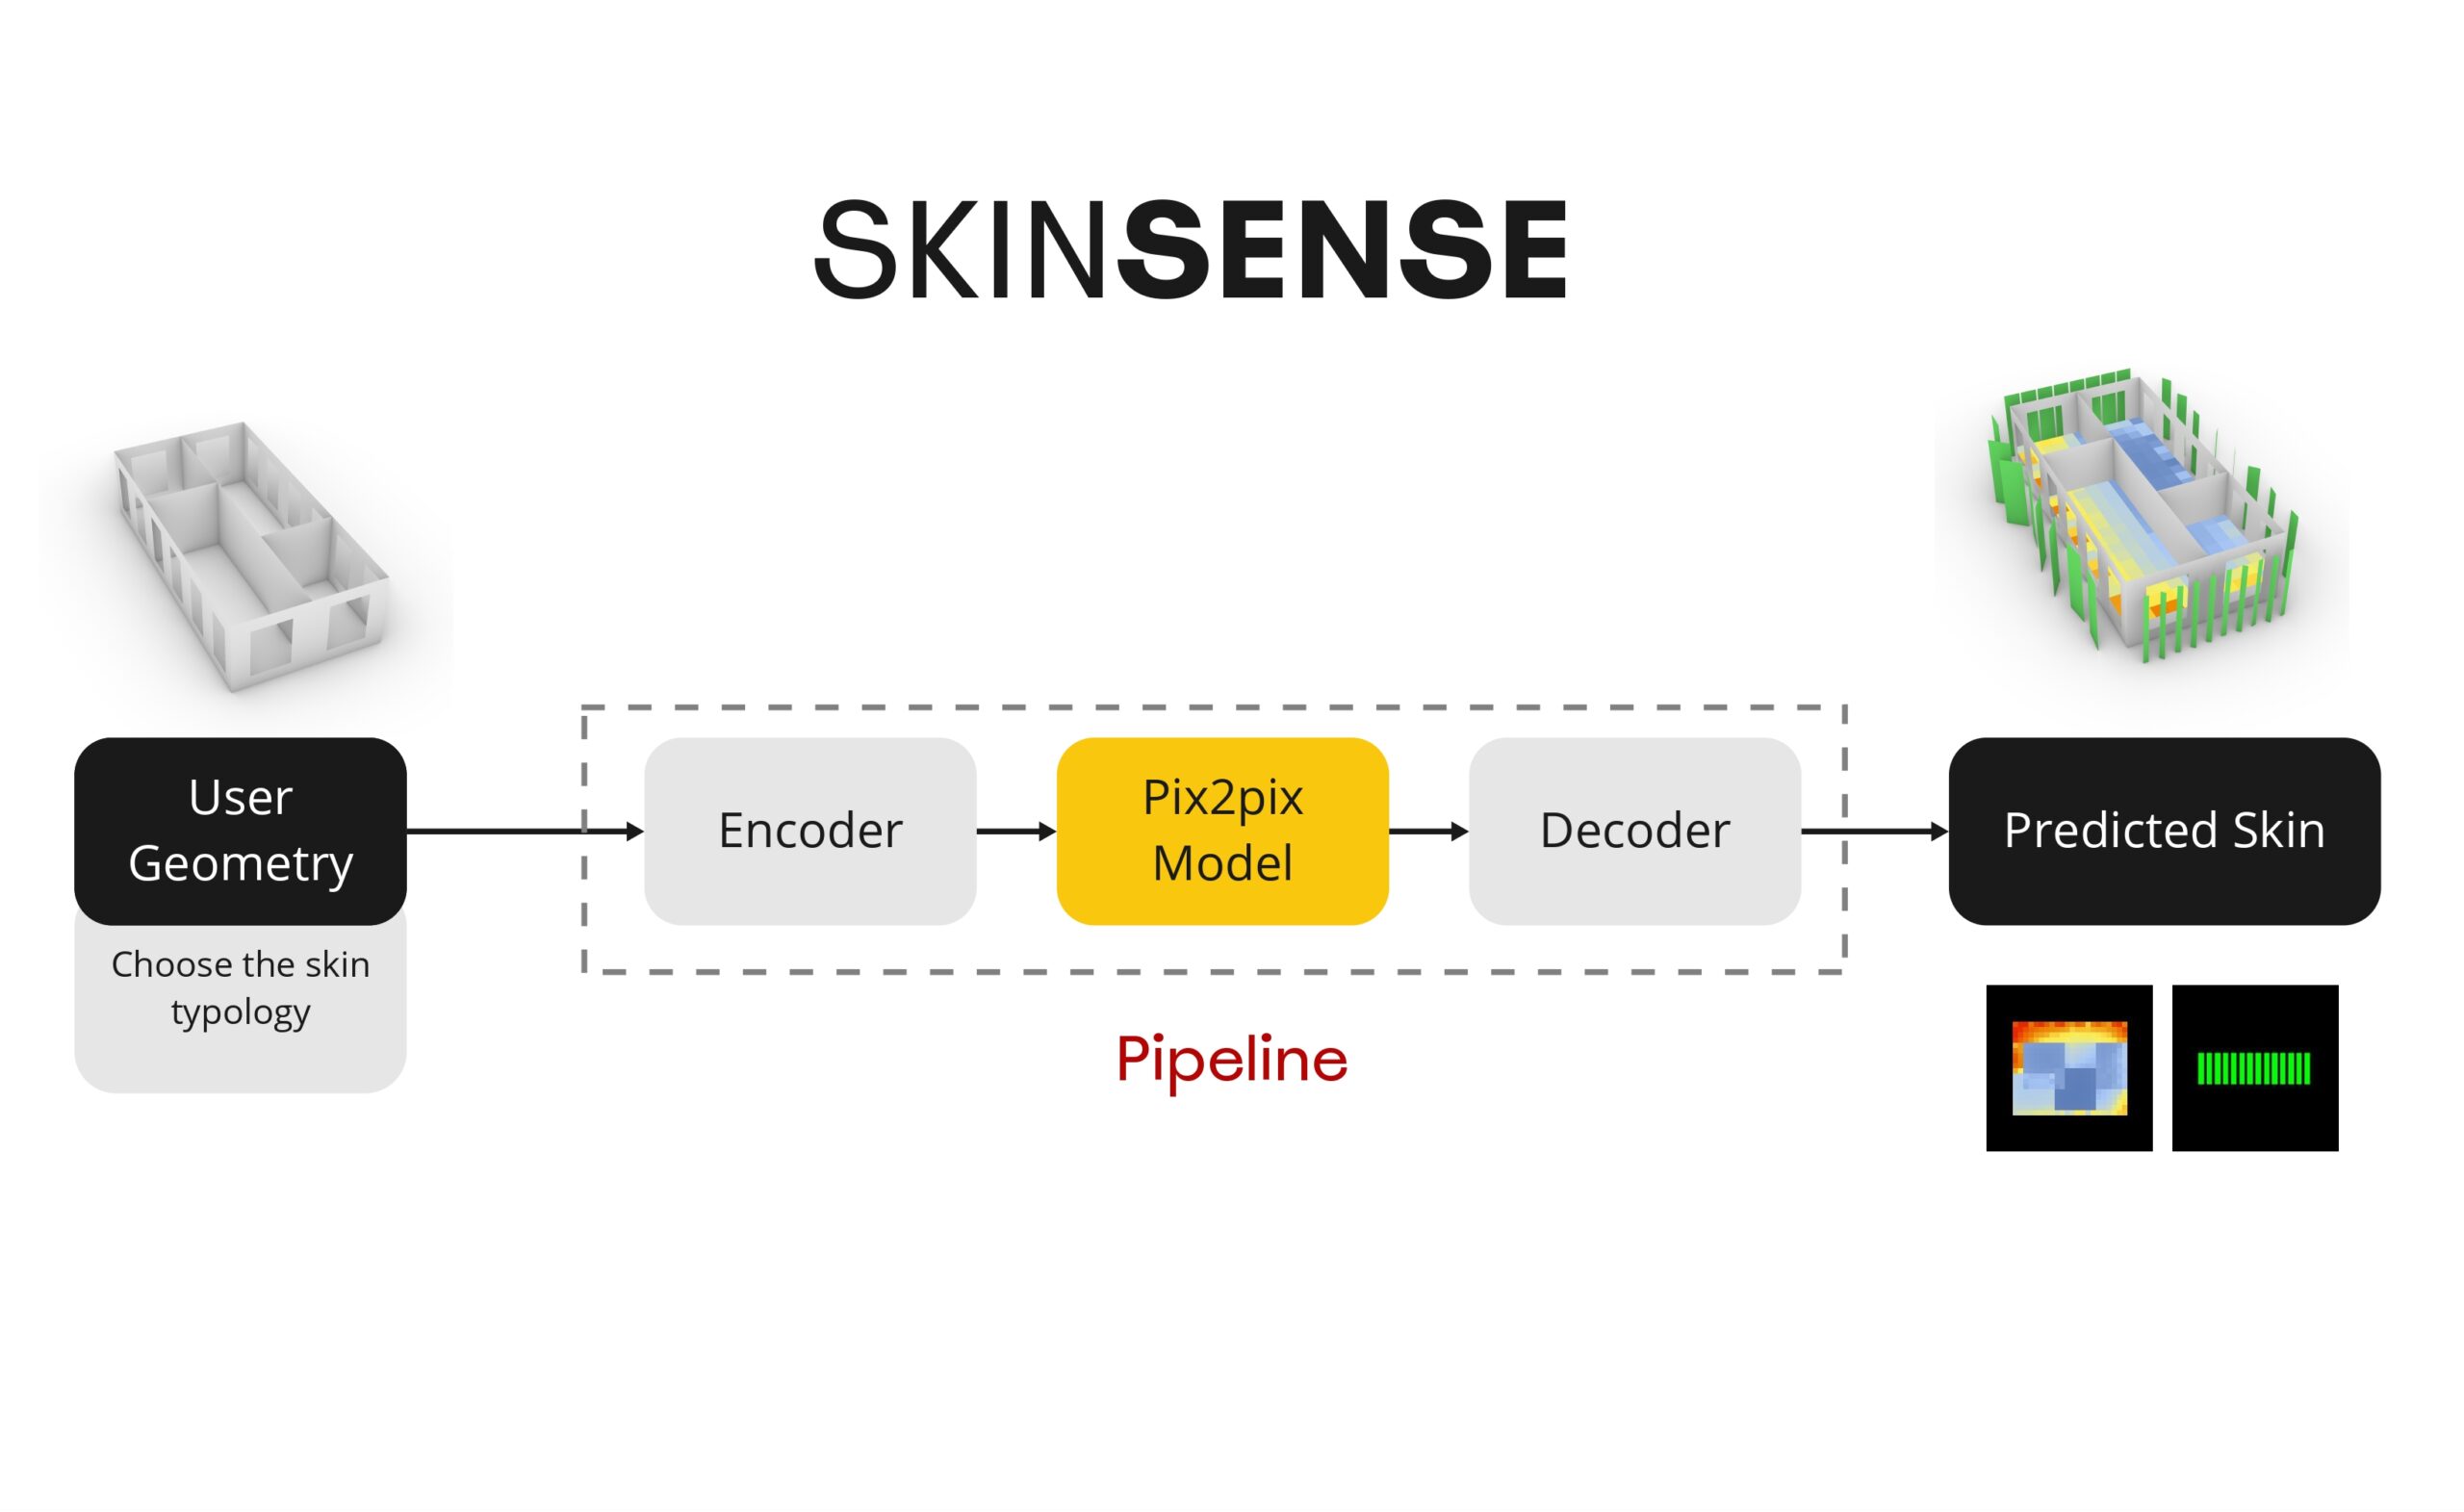
Our pipeline will be working as follows:
The user will input a Geometry having the walls separated from the openings, behind the scenes the app will encode an image out of the geometry passing it to the PIX2PIX model giving us our prediction then passing it to the decoder which will output a Shader Geometry that will optimize the performance of this Space
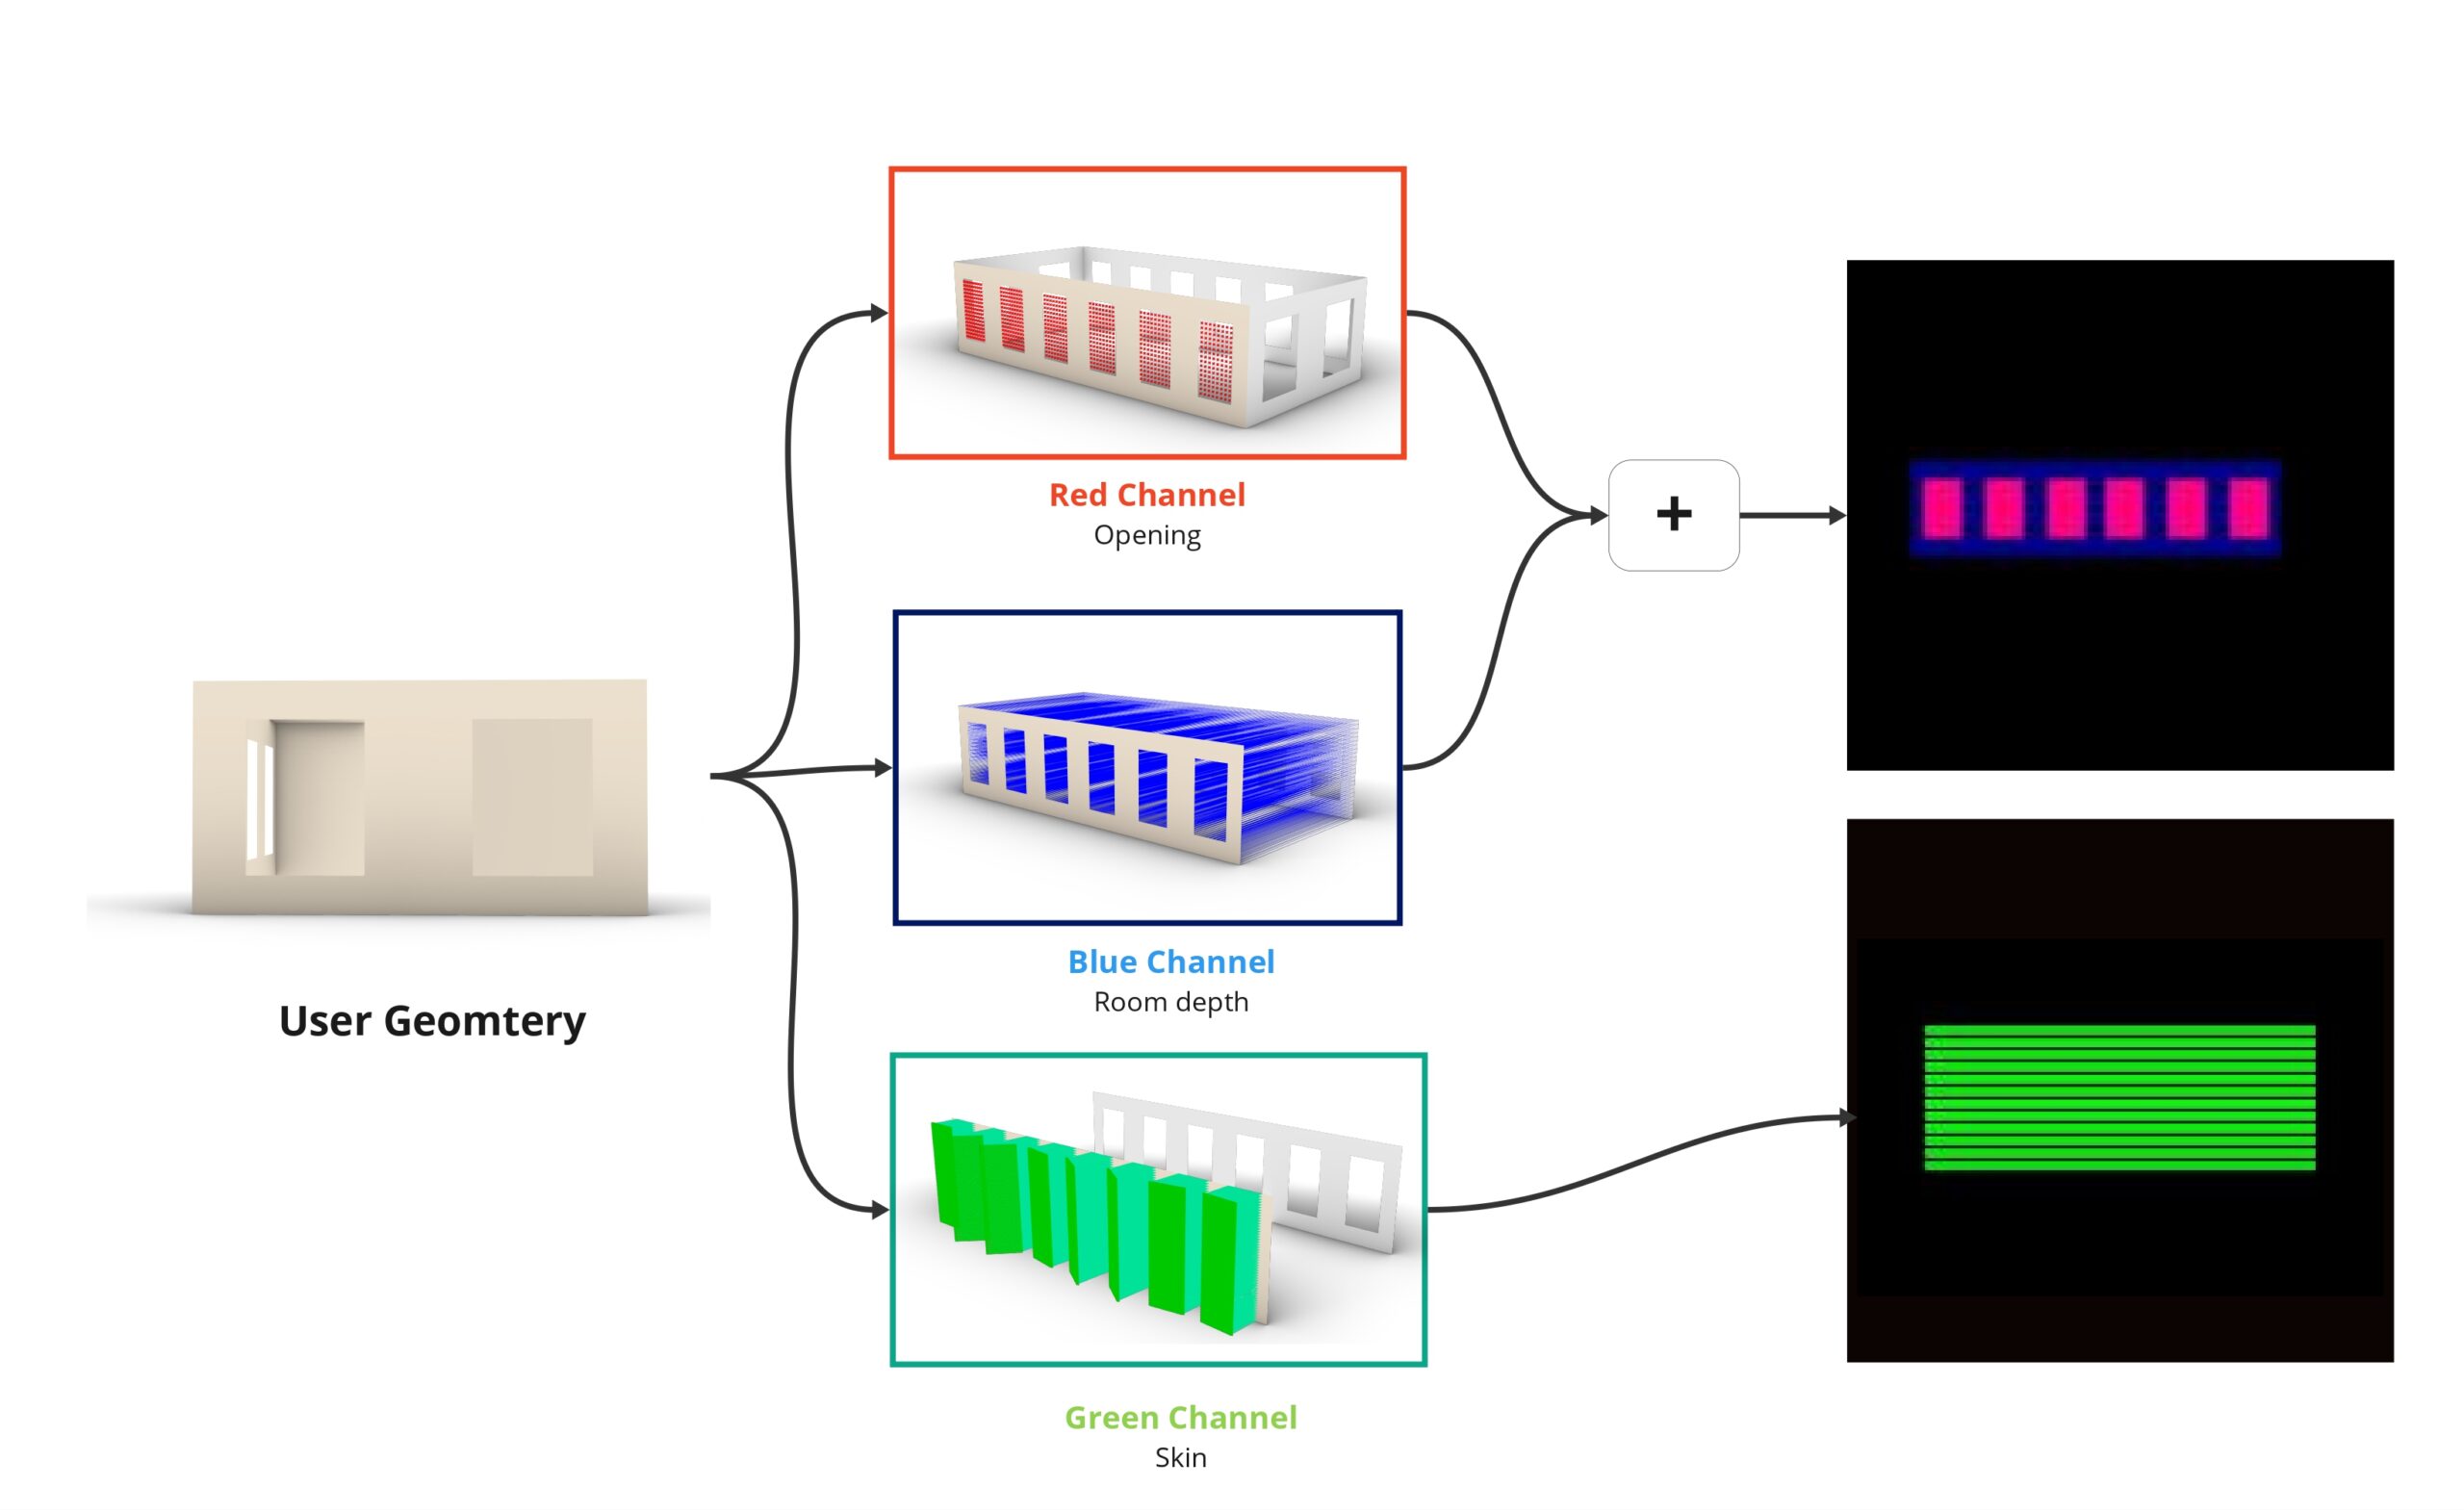
The Geometry is encoded to an image of RGB colors where:
- The R color will define the Window openings
- The Blue color will define the Room extent and the gradient of the blue will define the depth of the room
- The Green color will define the skin typology shape
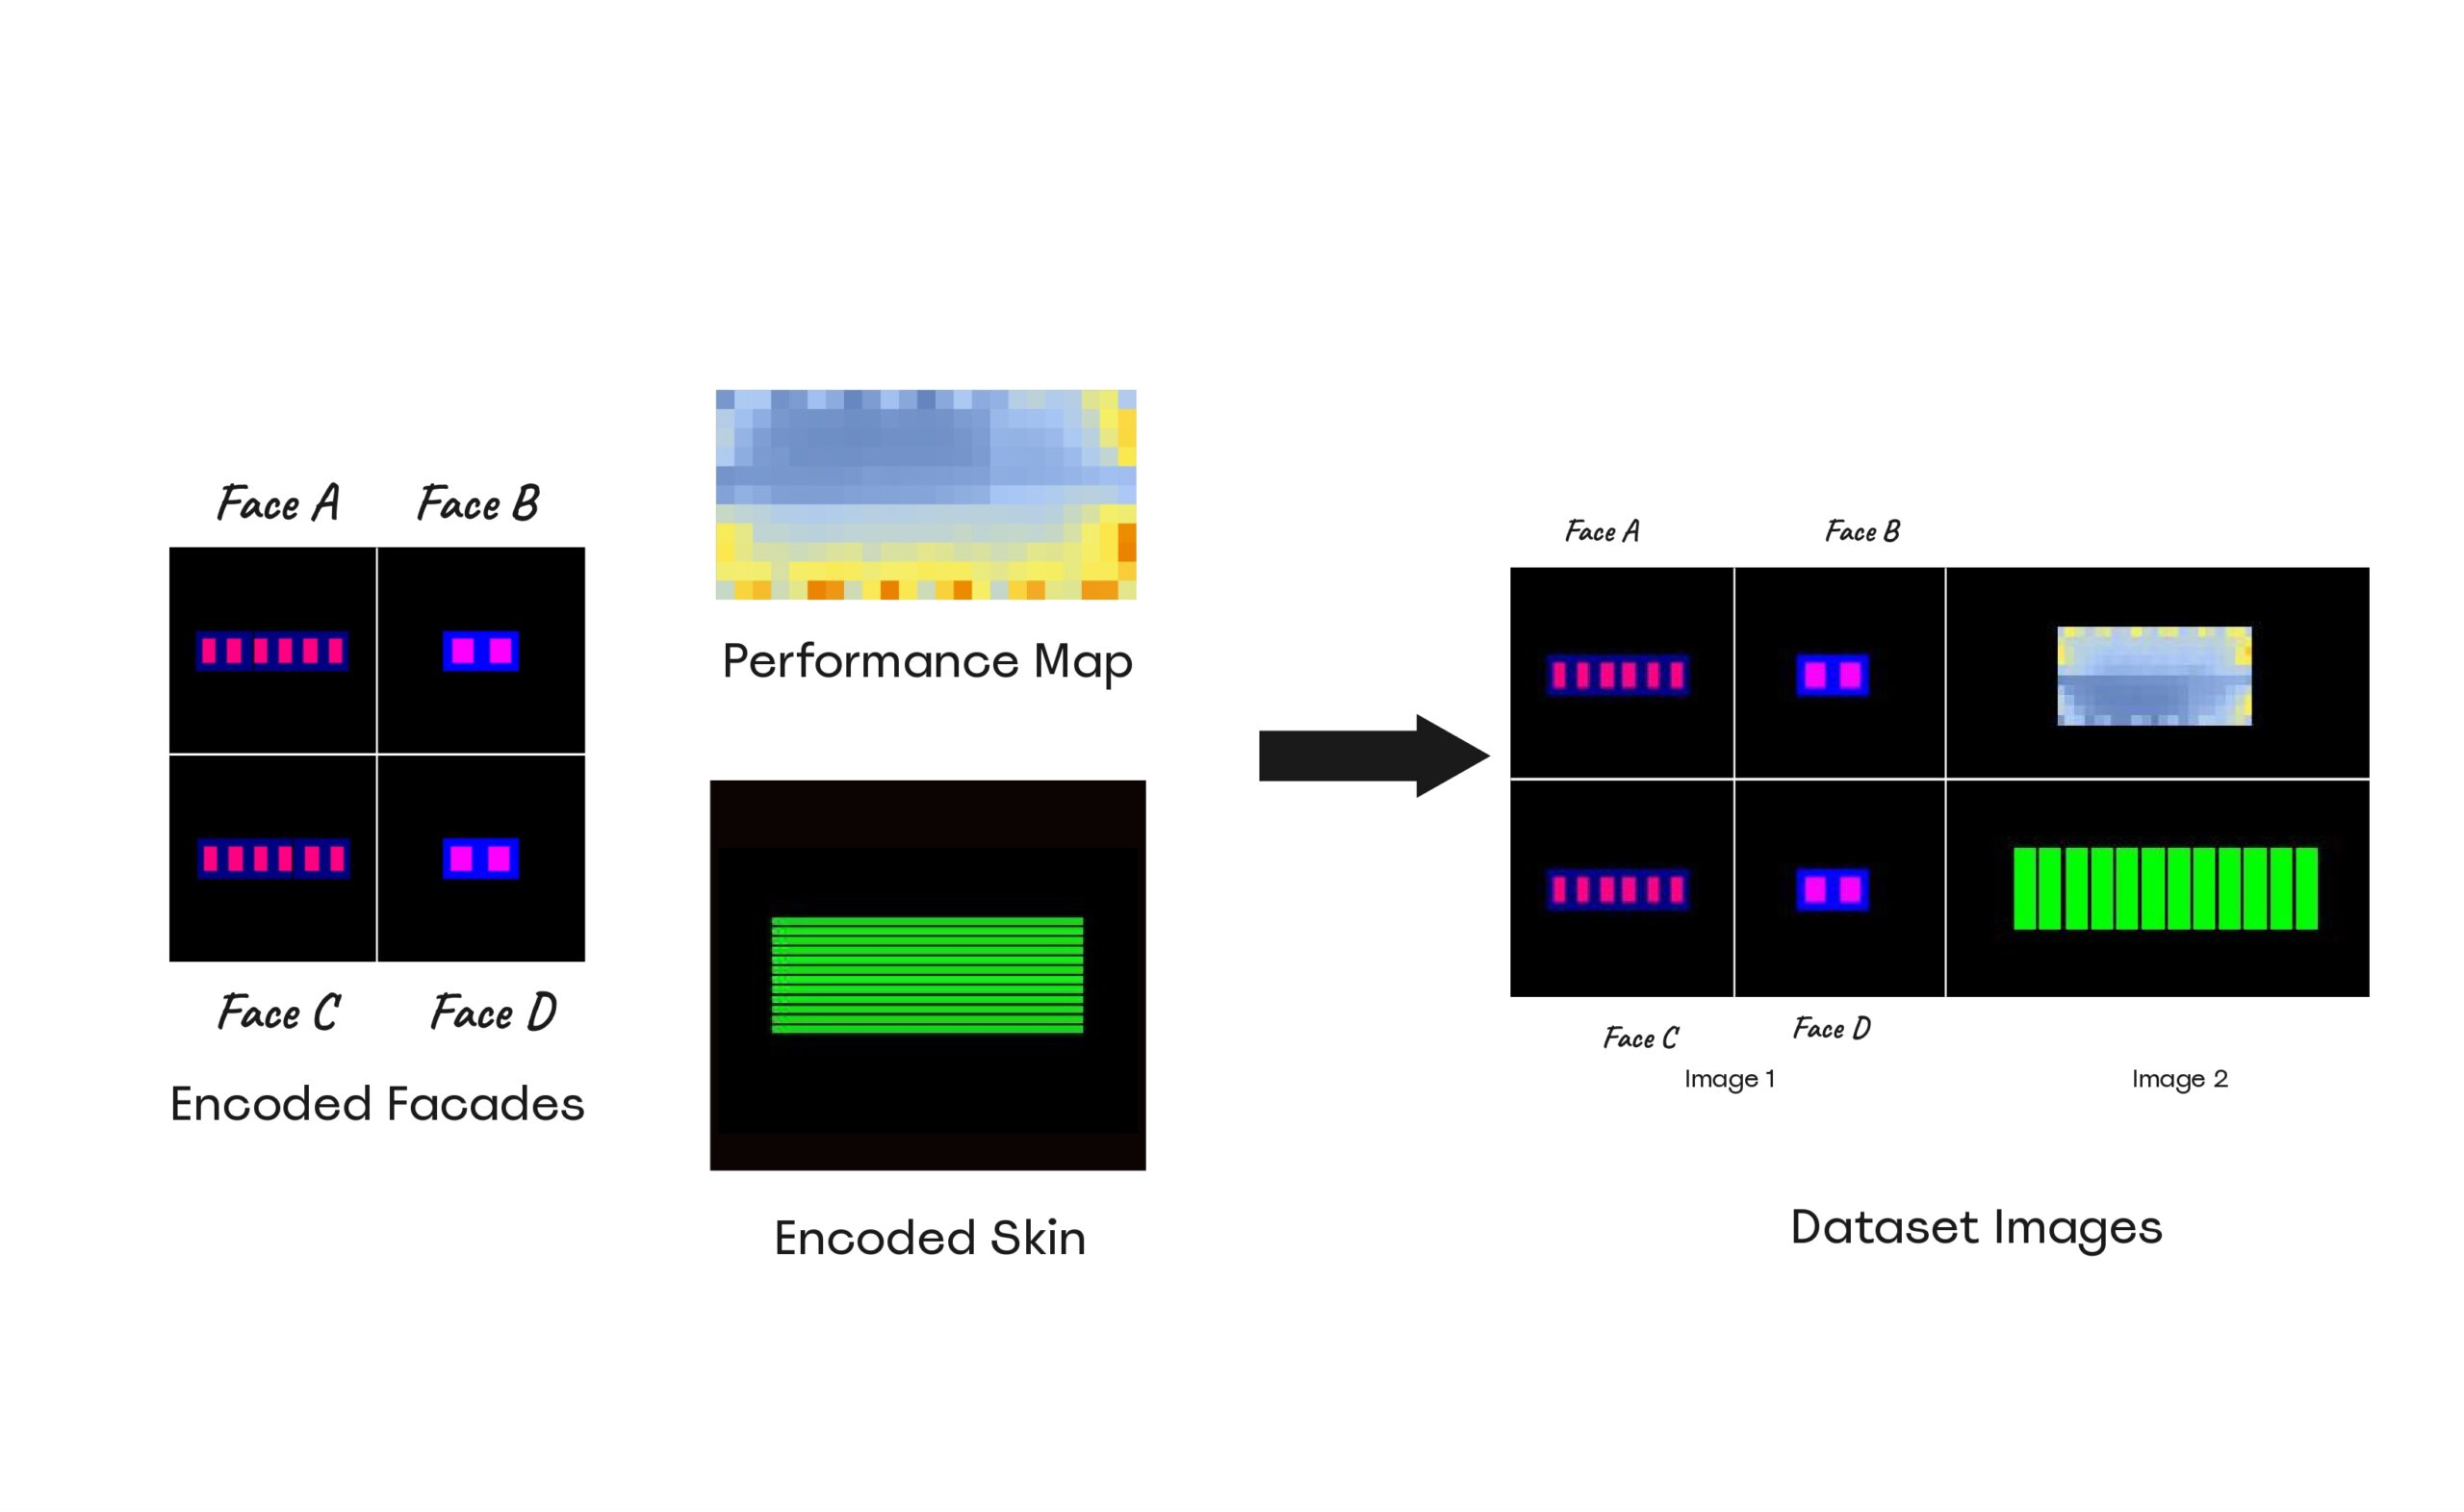
Our dataset is formed with the encoded facades on the left of a 256×412 size image. At the right, we have the final images of how we generated our training dataset. the performance map with the skin typology optimizing this room
The final stage of our dataset Generation is filtering the optimized output minimum and maximum MRT values between 22 to 32 degrees, finally getting 1000 optimized simulations for each typology.
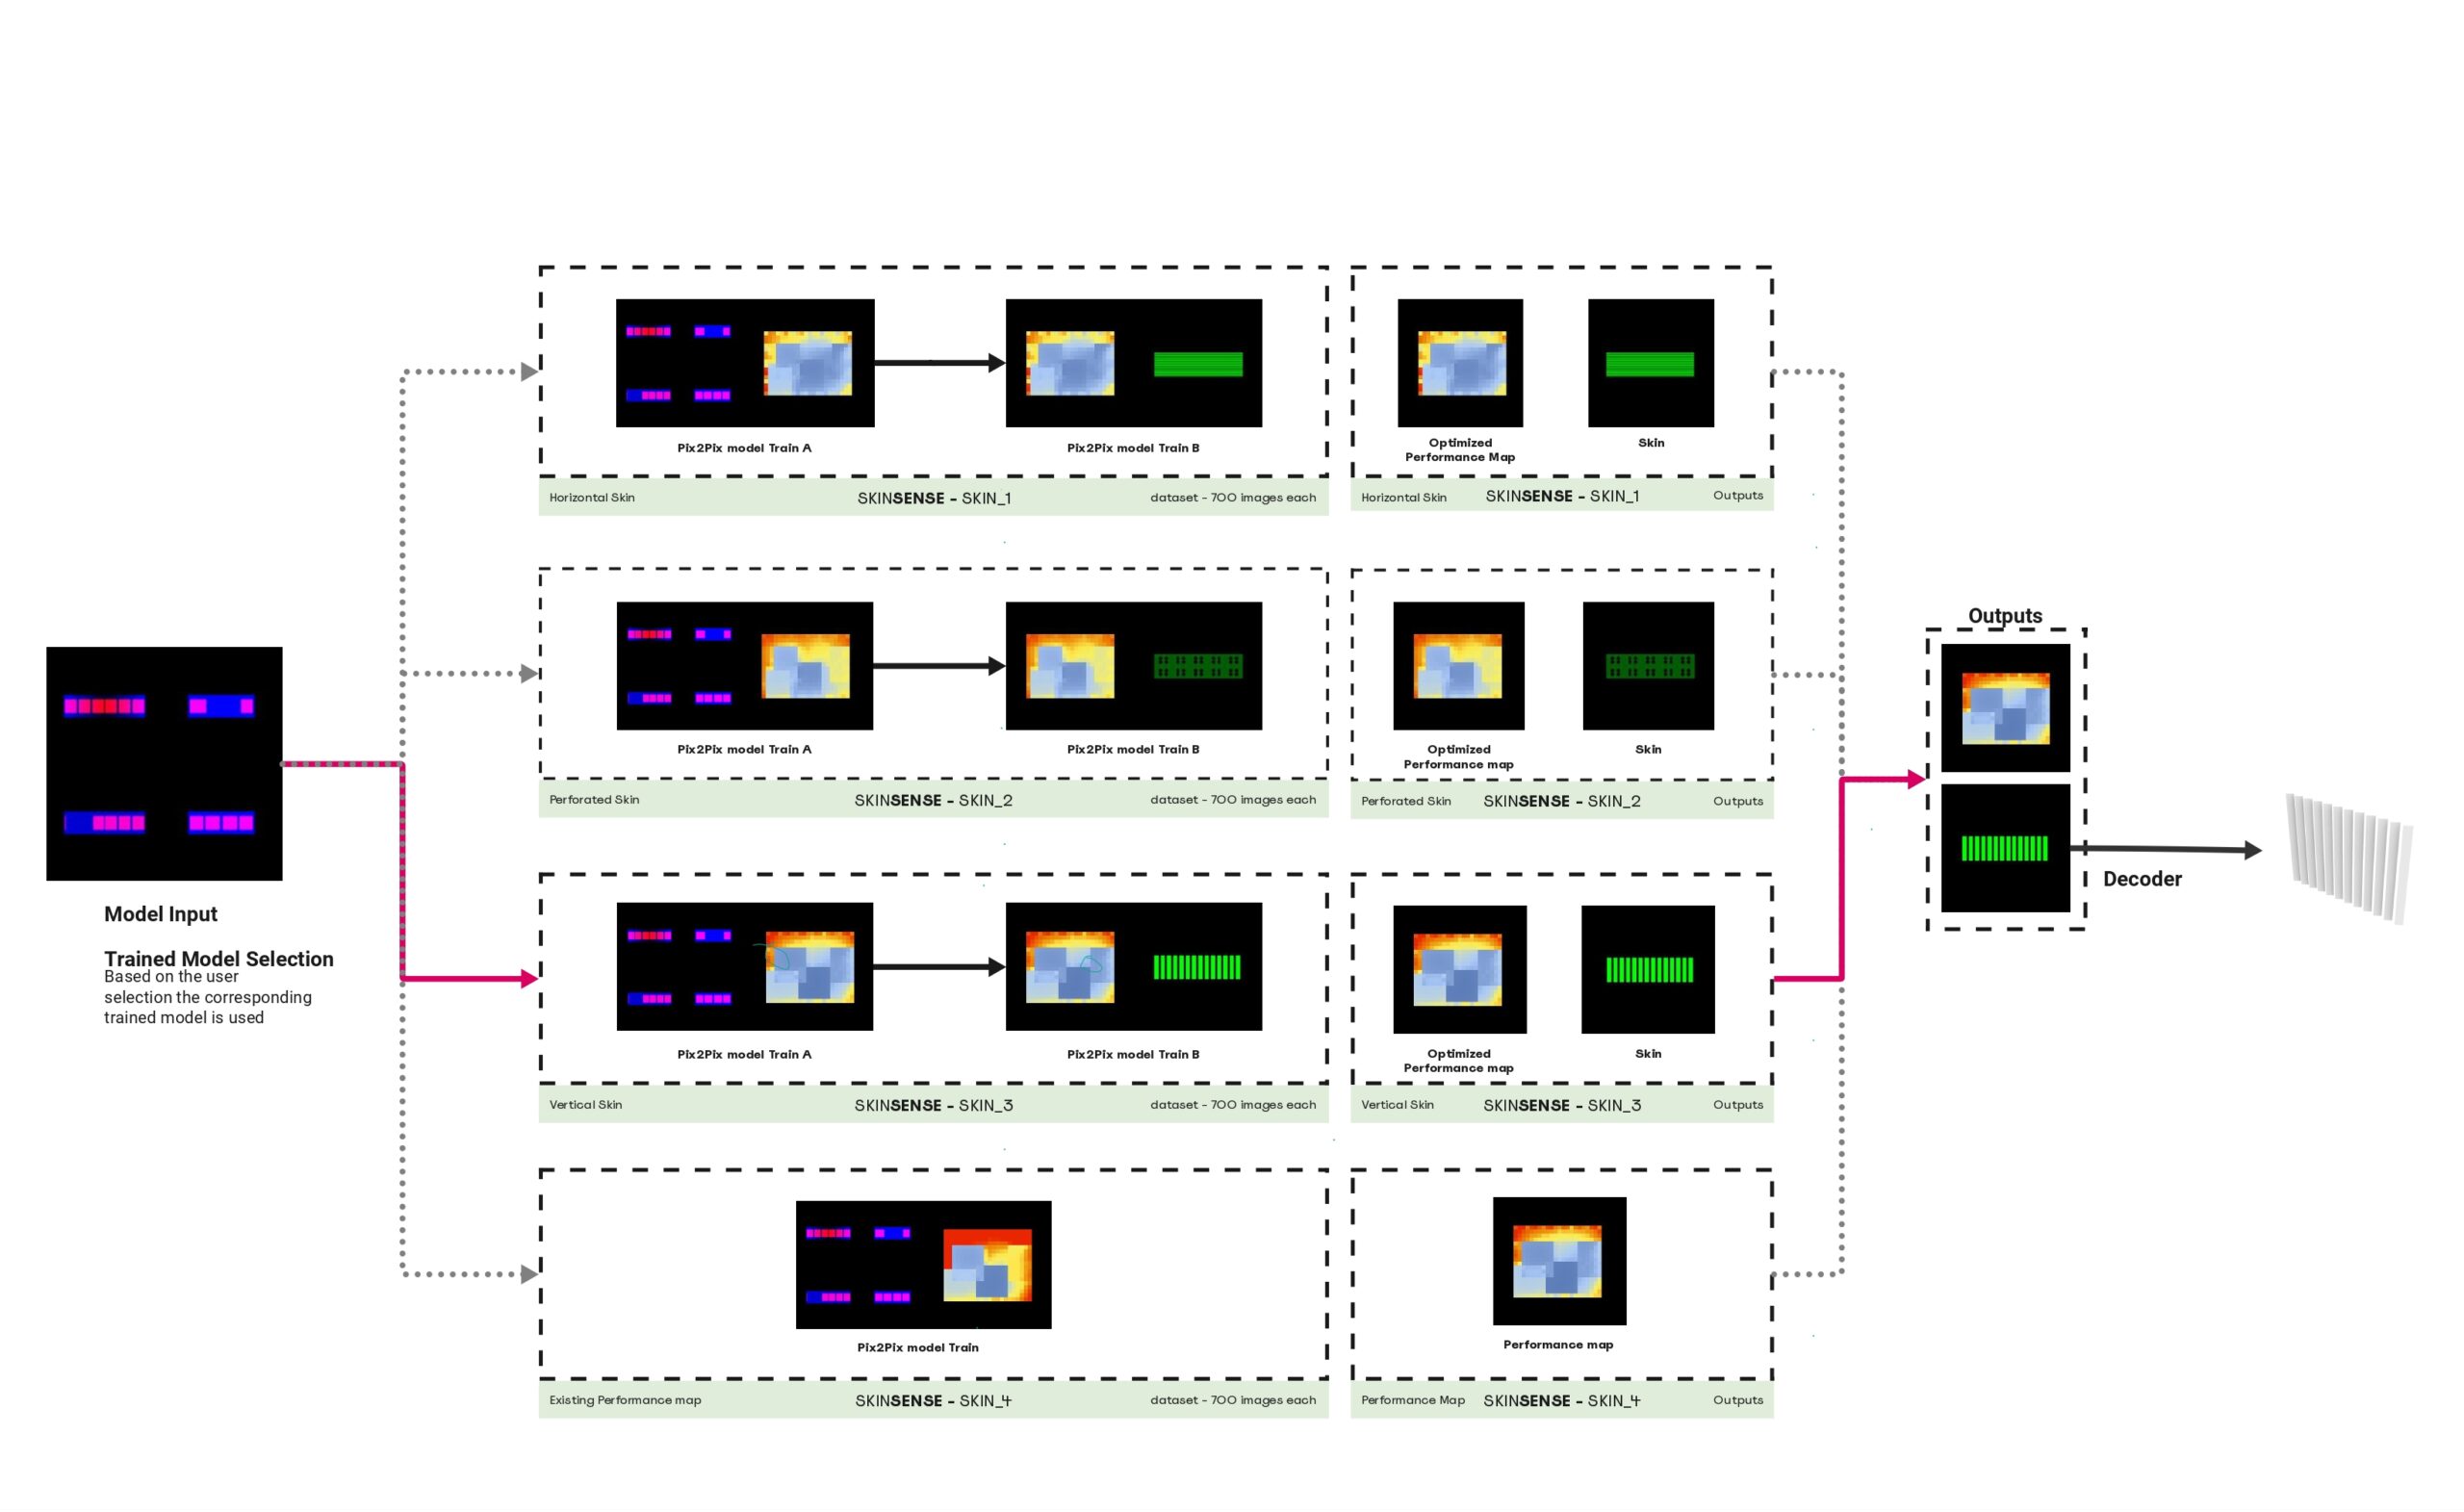
Next, we start training for 4 different skin predictor models in the sense that the user can choose one of the skin typologies as per his needs, and the respective model gets activated providing a performance map and predicted skin typology as output which will then be decoded using the decoder.
In the first trial, we train 2 different pix 2pix models for each skin predictor. Here the output from the first pix2pix model is used as input for the second model.
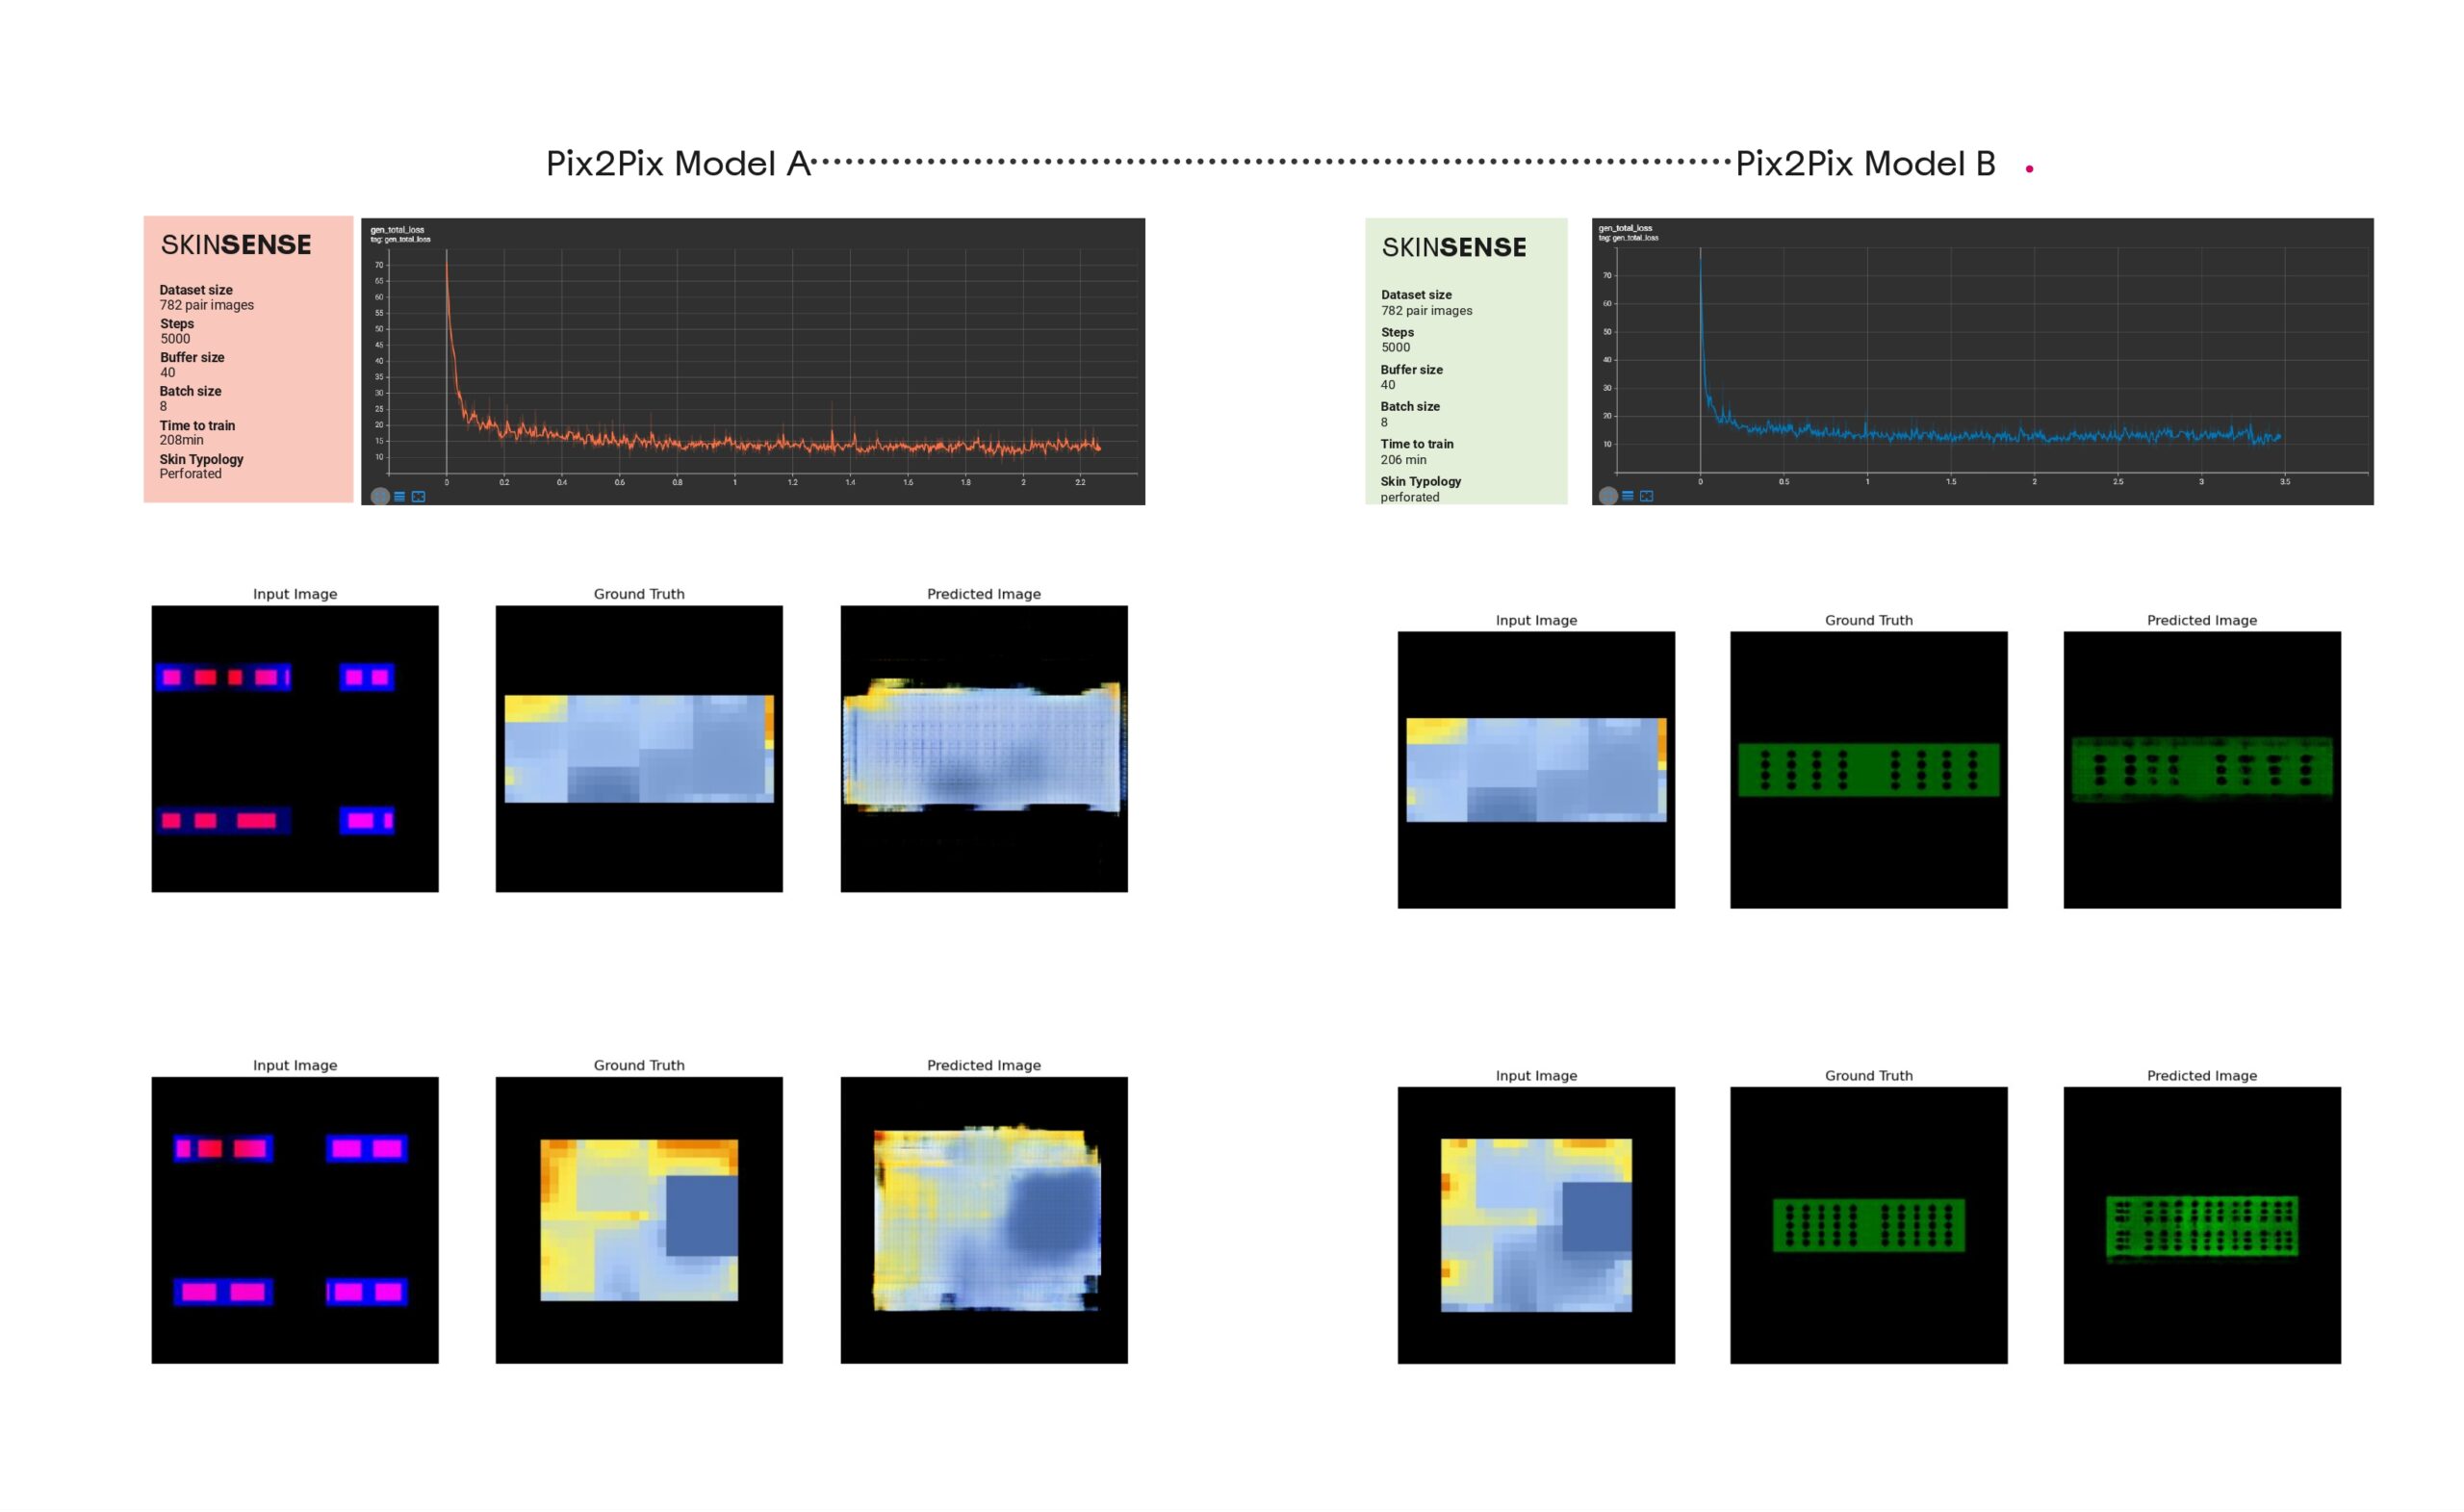
As we can see, the prediction results were not bad. But in the end, when they are used together it will be like amplifying the error through the 2 stages. If it’s within the tolerance in the first stage it will not be at the second stage.
This is when we shifted to the next idea with the previously mentioned input image formation of the Performance map on top and the skin typology on the bottom at the side of the room parameters.
In our final workflow, we reduce the 2 steps in training to one step, to reduce the error where we can see the output encoded images have been updated to have heat map and the predicted skin.
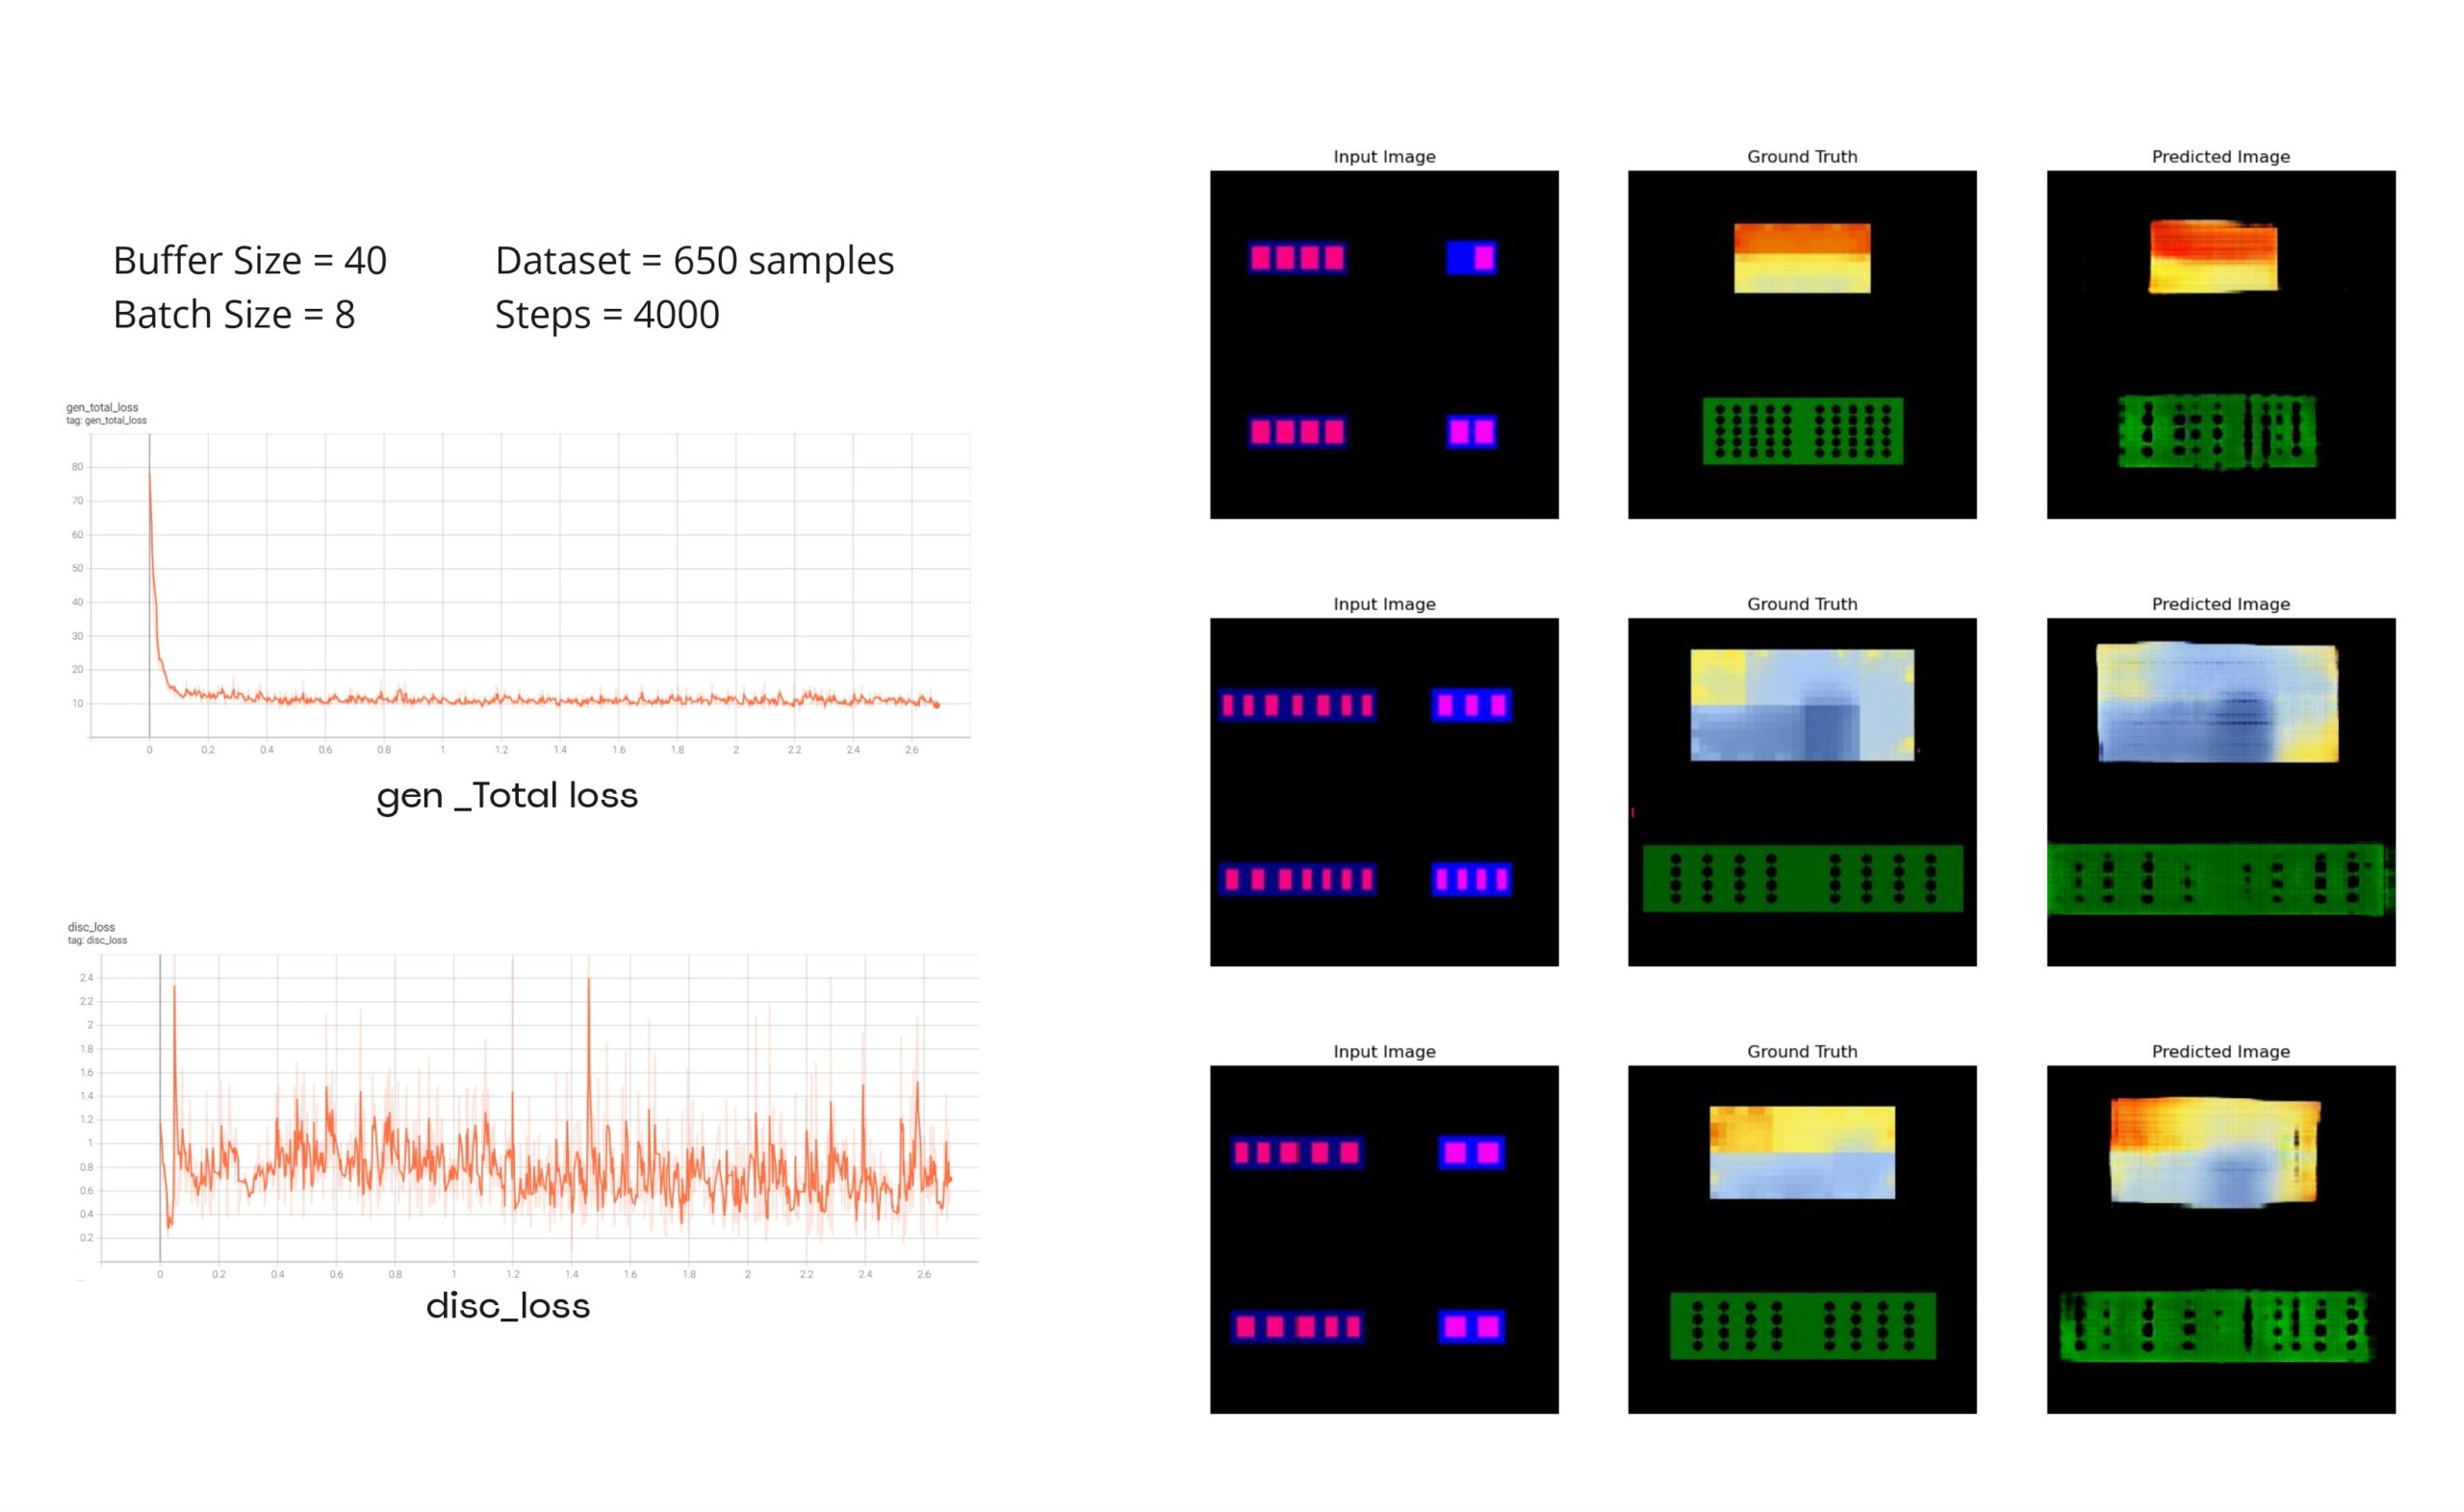
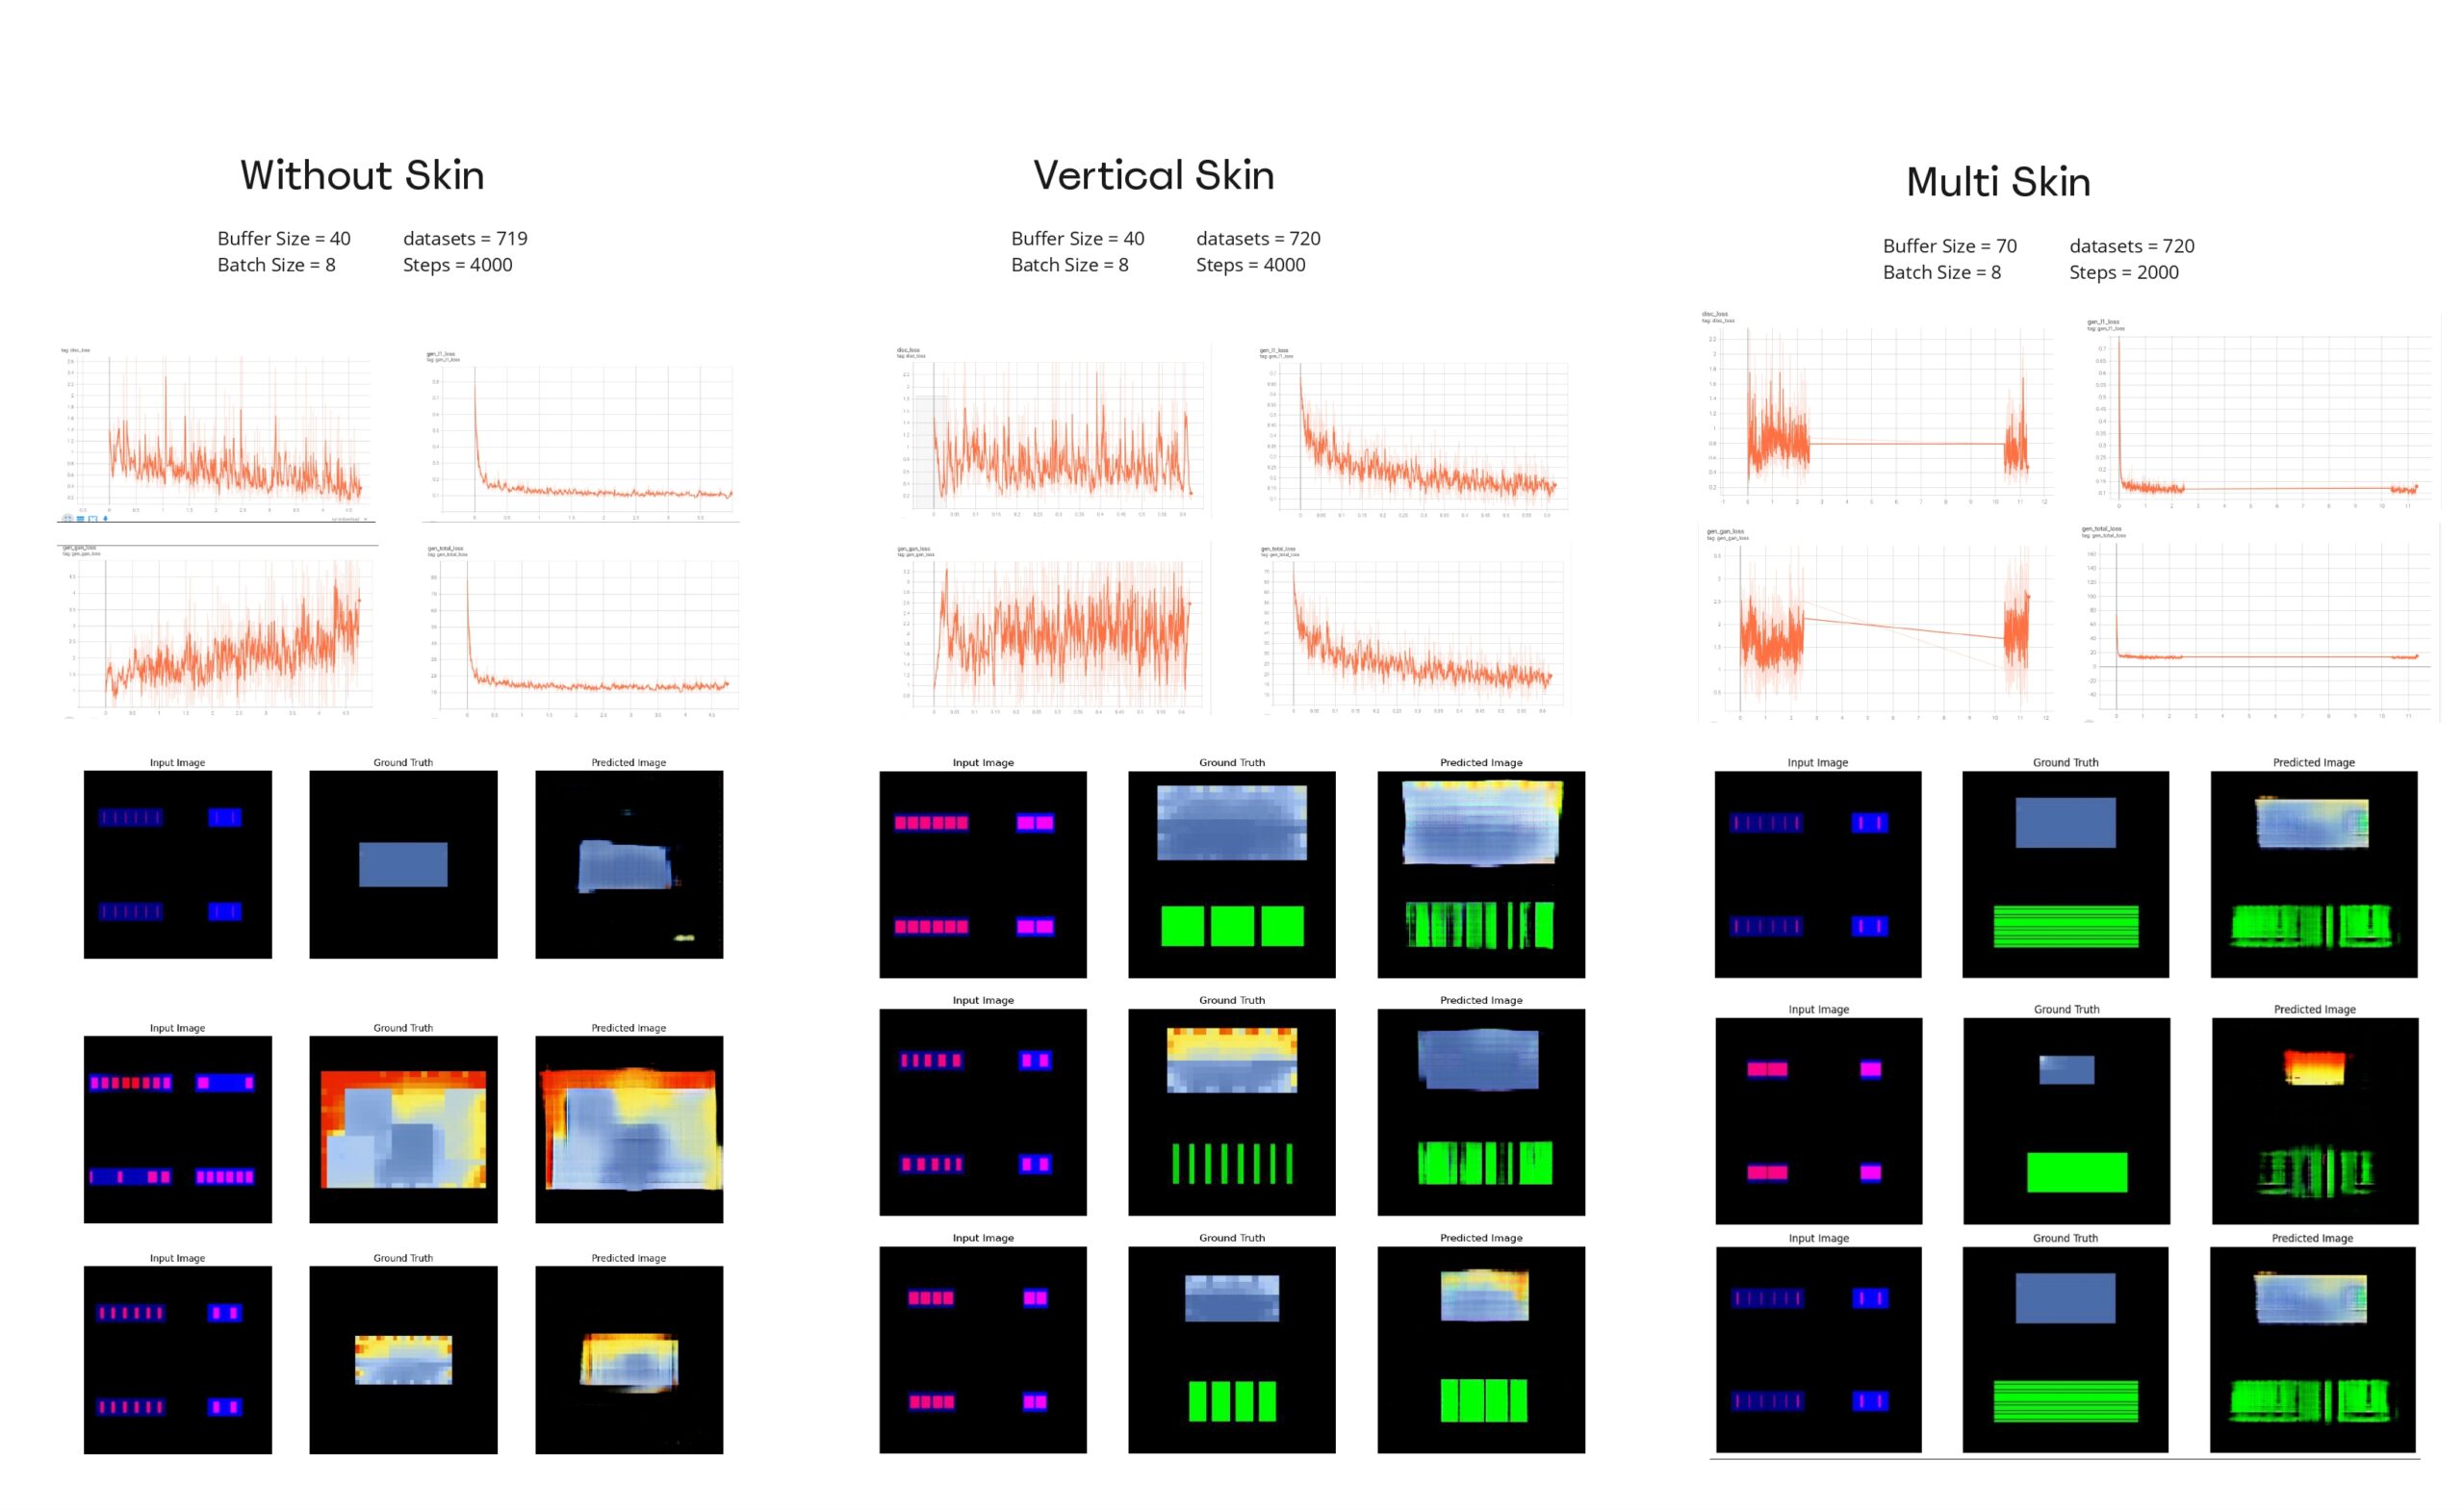
Diving into one of our models we experimented with a few samples like 650 samples having 4000 steps but the model showed signs of overfitting.
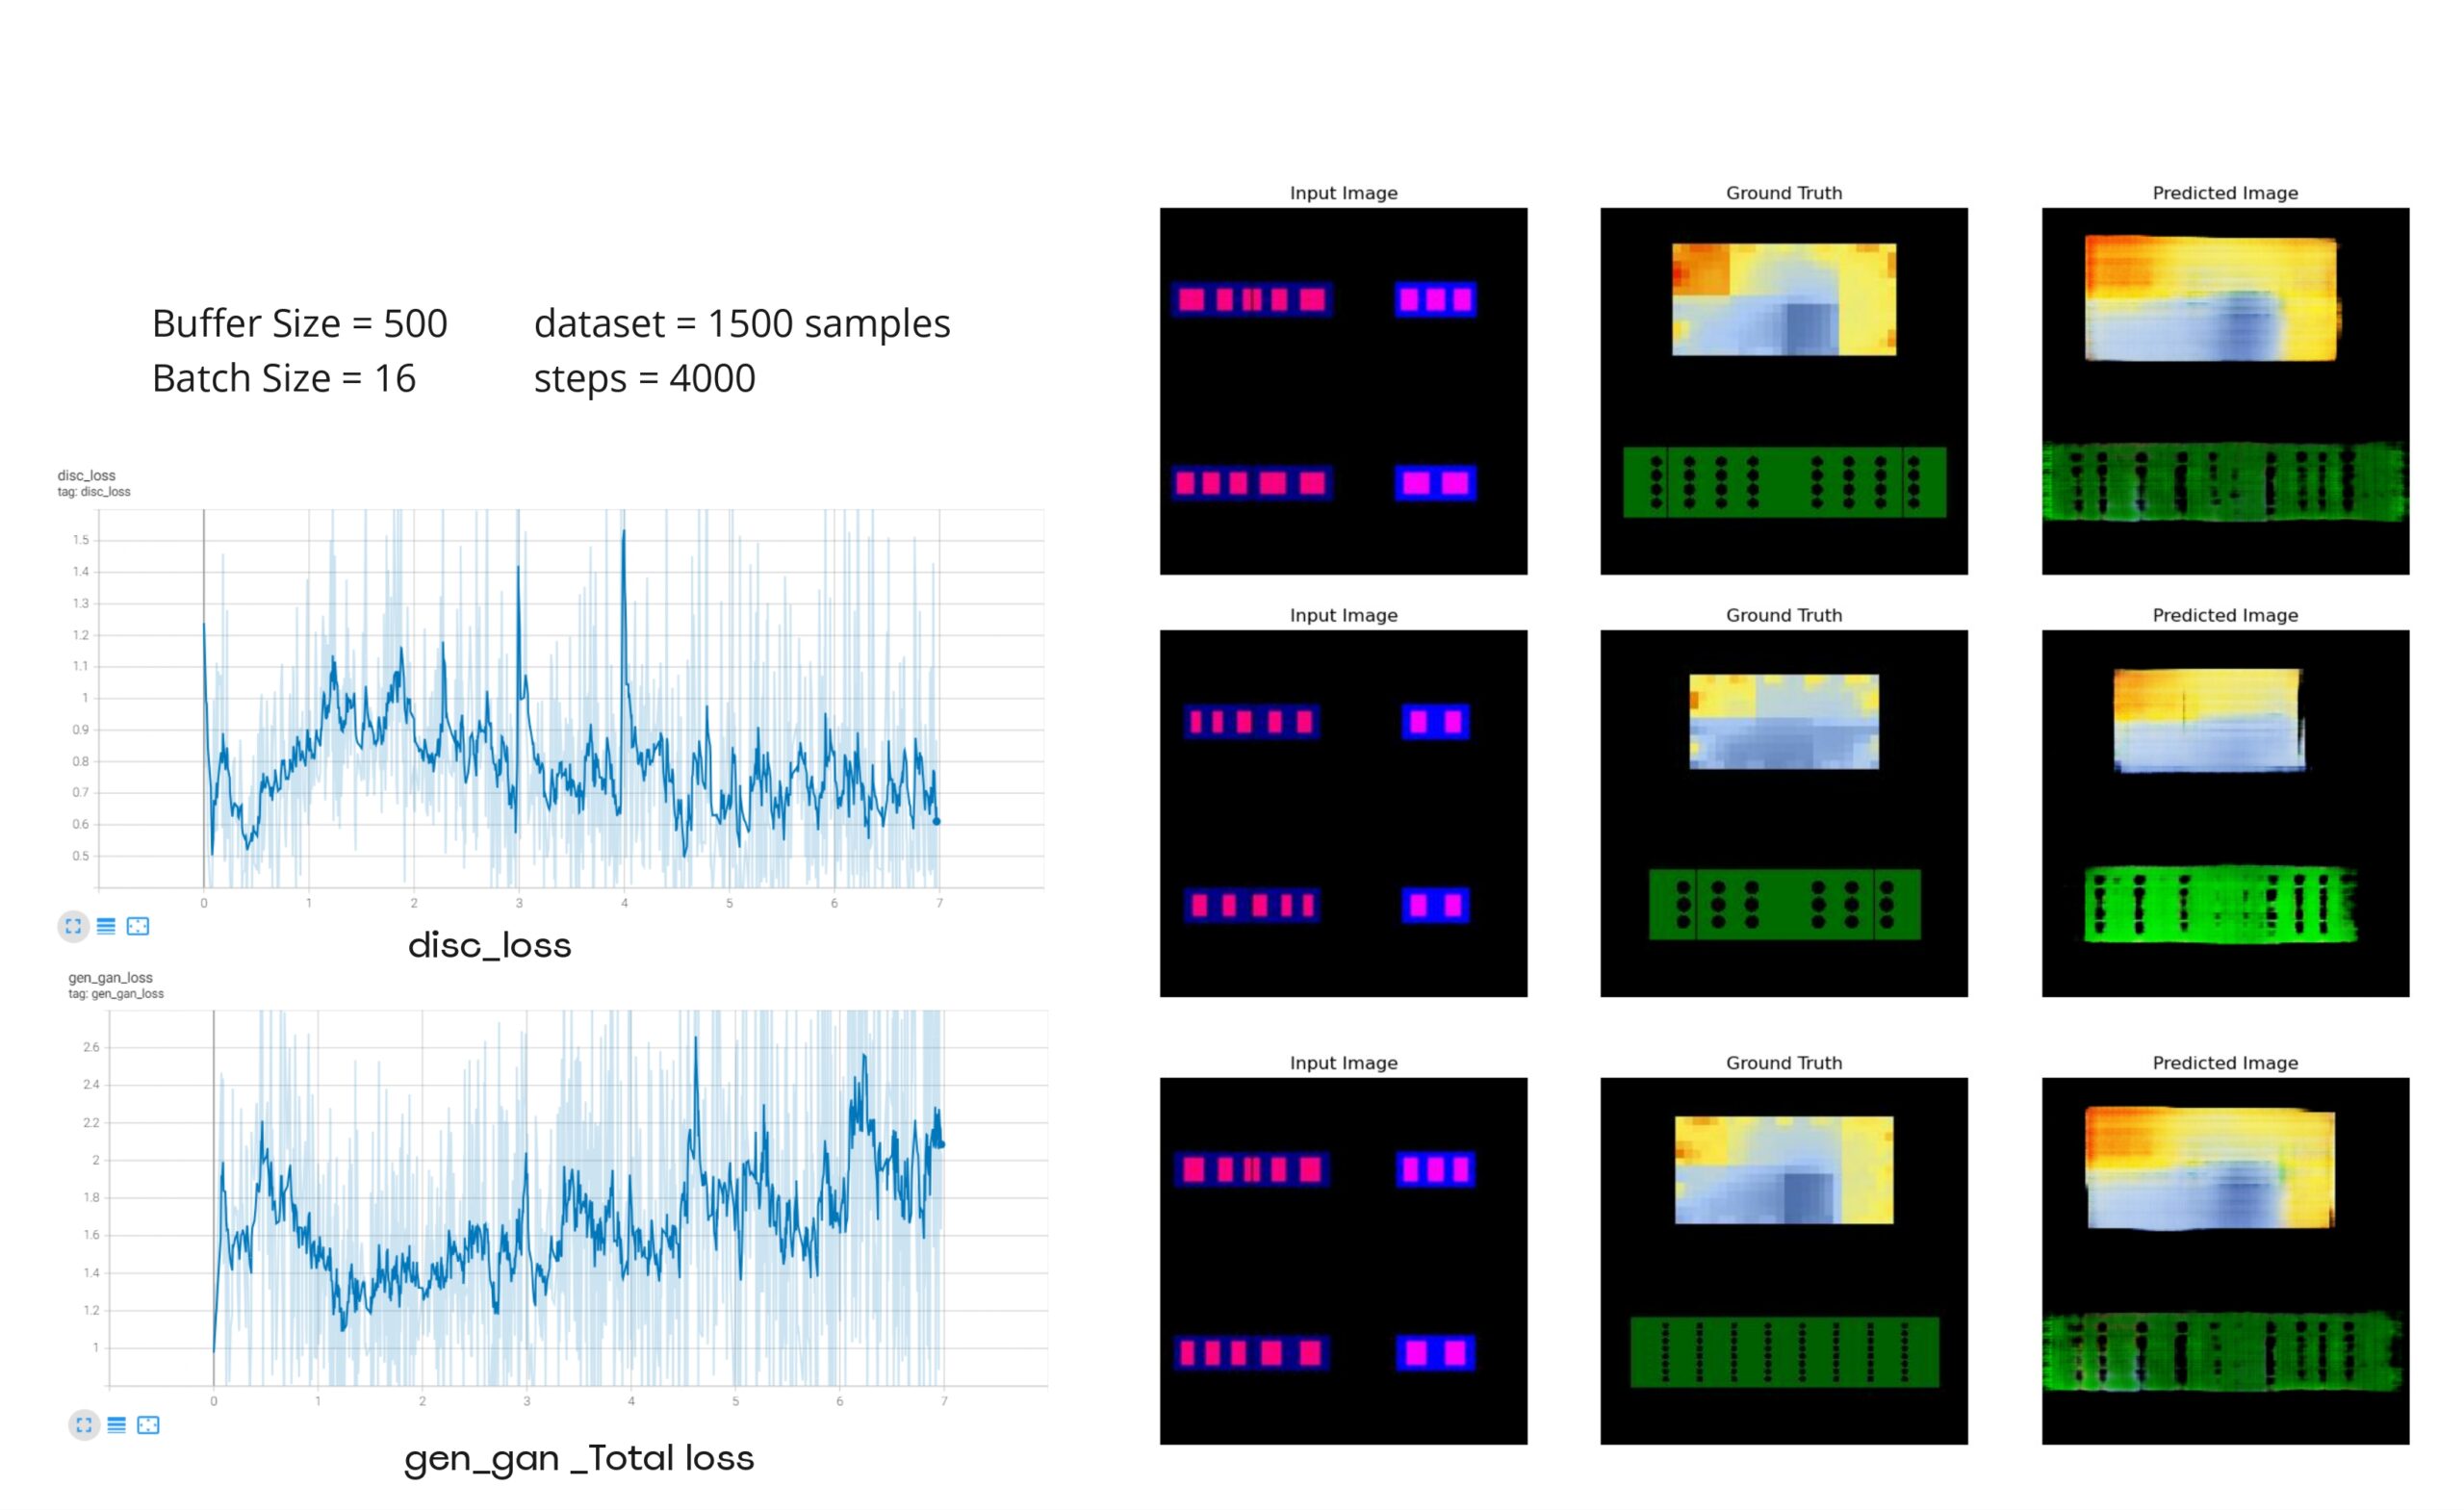
Then we Expand our dataset while also changing some of the parameters.
The results are not bad for the predicted performance map but for the predicted skin typology we can say that it still needs some improvements.
Similar training was applied for the no-skin model and the other skin typologies.
We also tried as an experiment to train a model having all different skin typologies, it created some interesting results by mixing skin typologies, but since the input data is too complex it might show more potential if we expanded our datasets (doubled or tripled).
Deployment
ِAs our application is triggered with a geometrical input it was better to have our app on Grasshopper as a plugin.
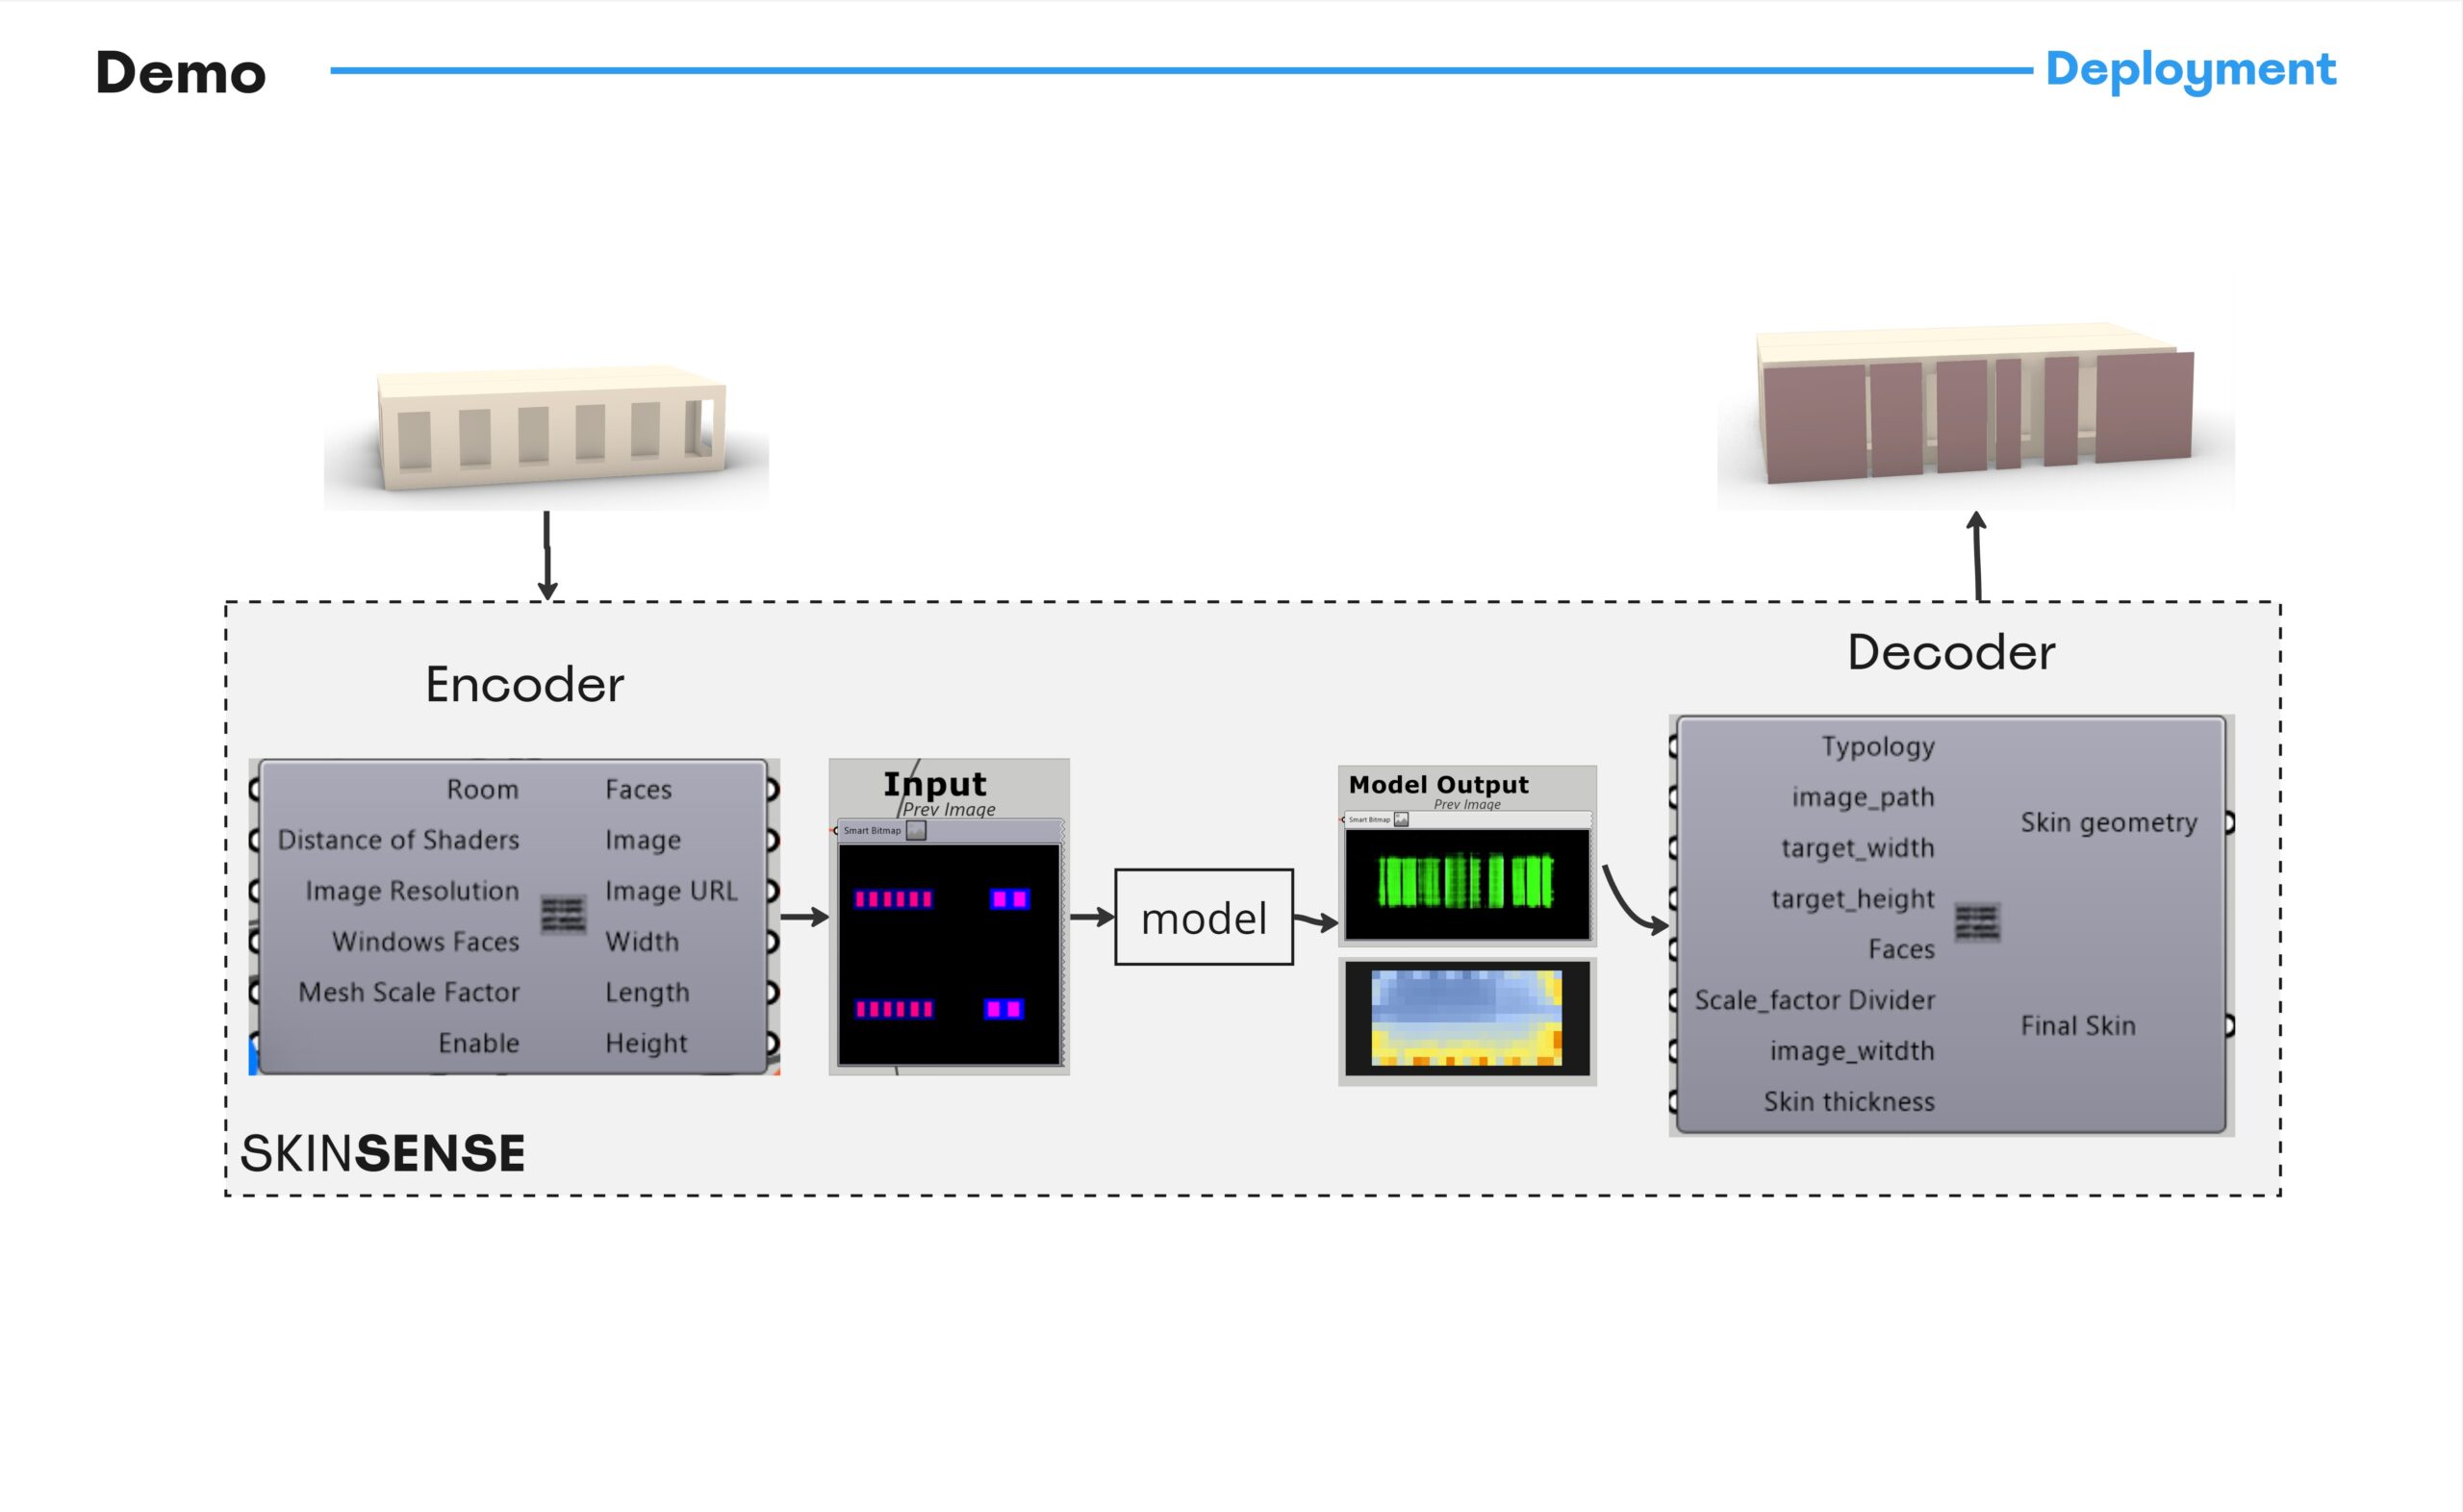
ِAnd finally, this is a Demo of how our app outputs some predictions.