DATA CENTER: A BOTTOM-UP APPROACH WITH MODULAR AGGREGATION
Data creation is exploding. With all the selfies and useless files people refuse to delete on the cloud, by the year 2025, there will be 200+ zettabytes of data in cloud storage. This explosion of data triggers the industry to streamline data management, security and storage, raising the demand for data center facilities, and accordingly, a 50% growth is expected by 2030. Due to this exponential growth, there is an immense need for new-aged data centers that not only satisfy the technical needs but can also be integrated into the modern urban environment as well as able to follow the dynamically changing requirements of the people.
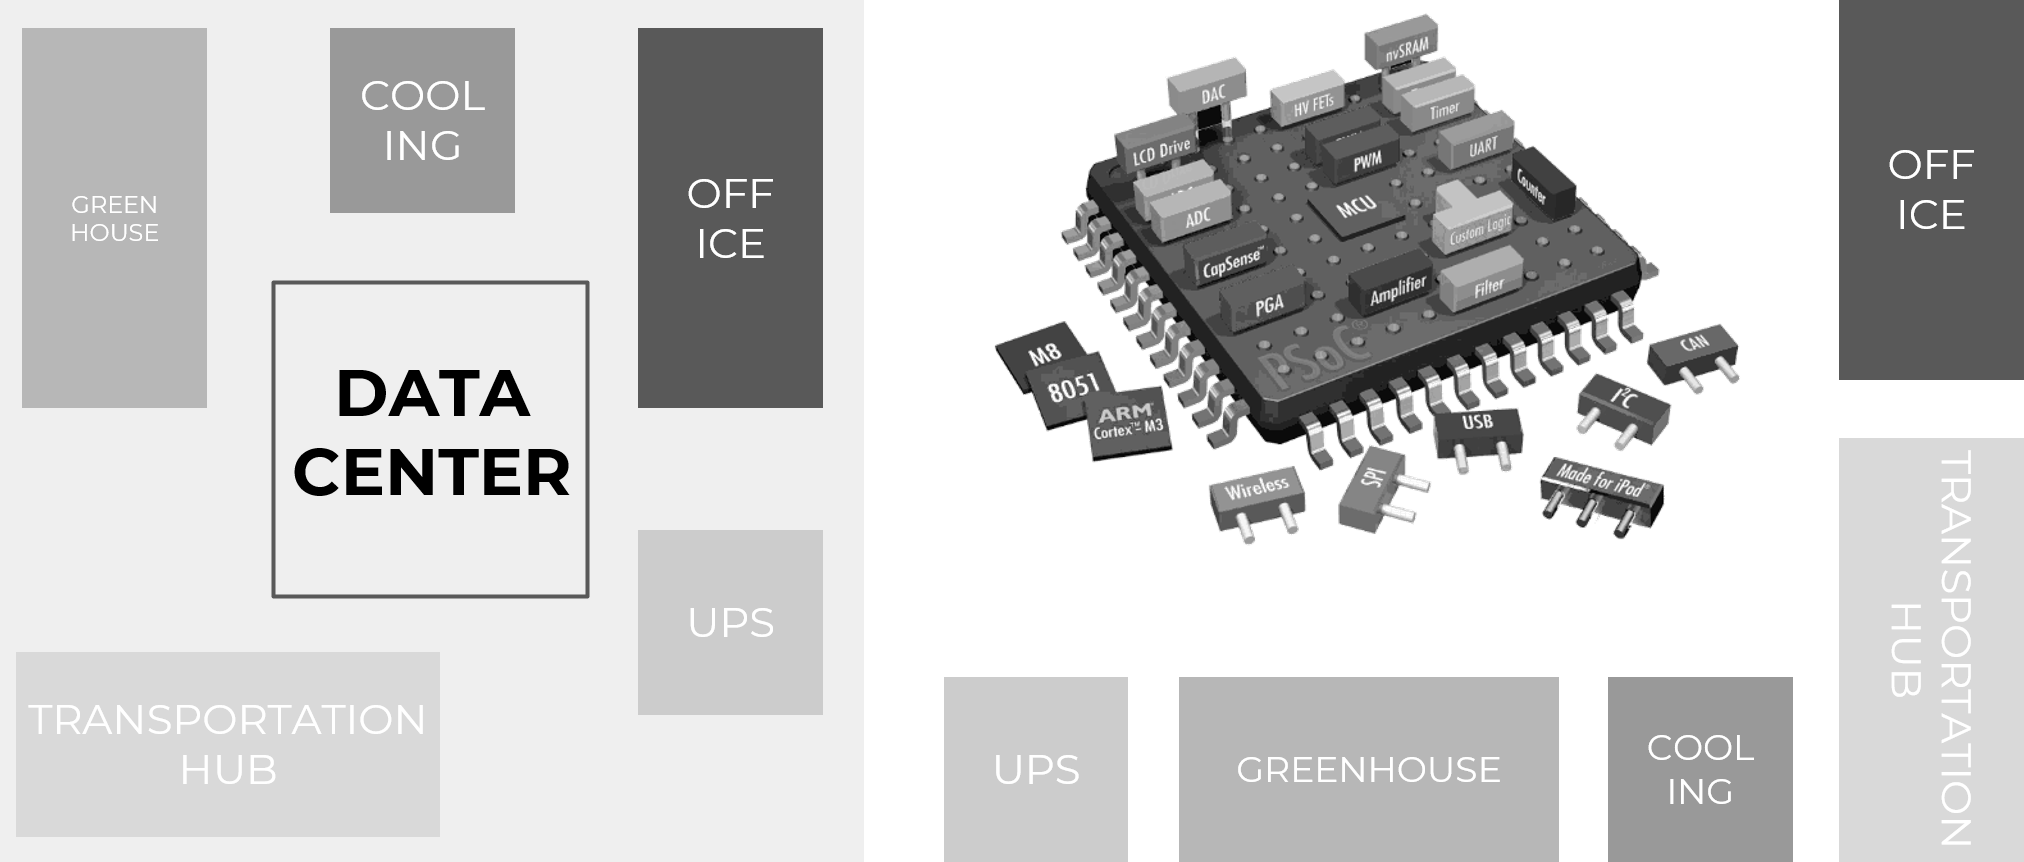
The term ‘System on a chip’ is essentially an integrated circuit that takes a single platform and integrates an entire electronic system onto it. Similarly, the architecture of our project follows a bottom-up approach in which small components start to define a bigger system, such as the chips that plug in – or plug out if needed – to a board necessary to run a machine. This approach has the benefit of promoting flexibility and adaptability, modularity, and repeatability.
The Concept
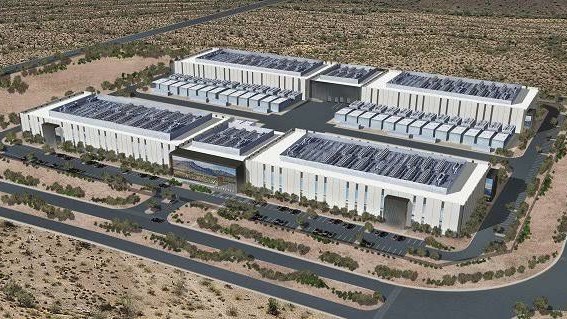
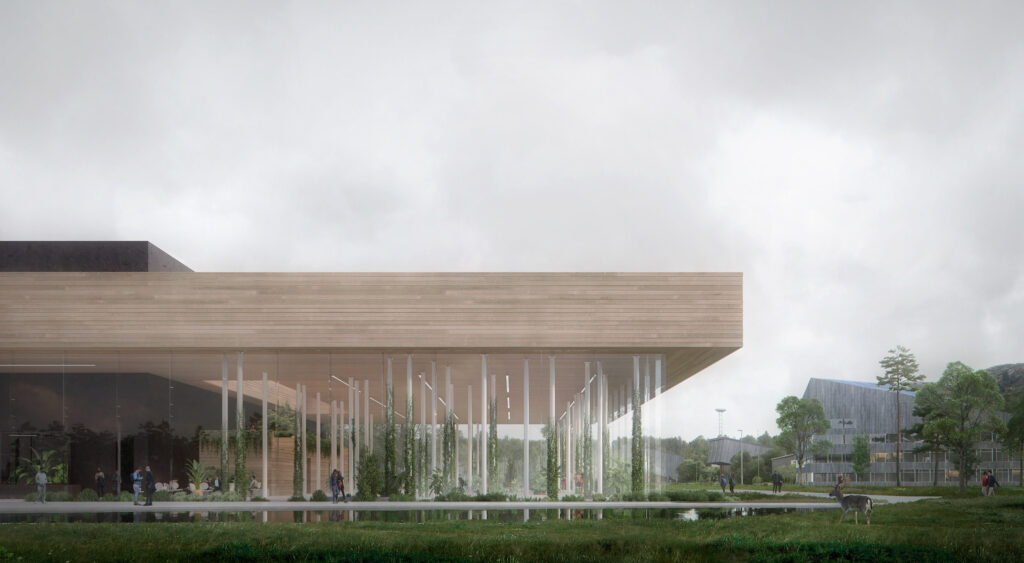
A data center is an extremely functional building, where good design is mainly measured by the extent of the profitable spaces (white space), while it also has specific operational needs that follow strict rules. Therefor the average data center is characterized as a large warehouse located in the outskirts of the city. However, with the expected growth of their numbers, expanding requirements, sustainability concerns this will likely change. The building needs to be integrated into the urban realm, has to cater for mixed typologies and operate with a lower environmental footprint. These are the parameters that drove the design of ‘The Spark’ by Snøhetta, reimagining the data center typology as an integral community-orientated part of the city, adding other typologies to the mix such as a spa for example, as well as utilizing the waste heat to generate energy for the community
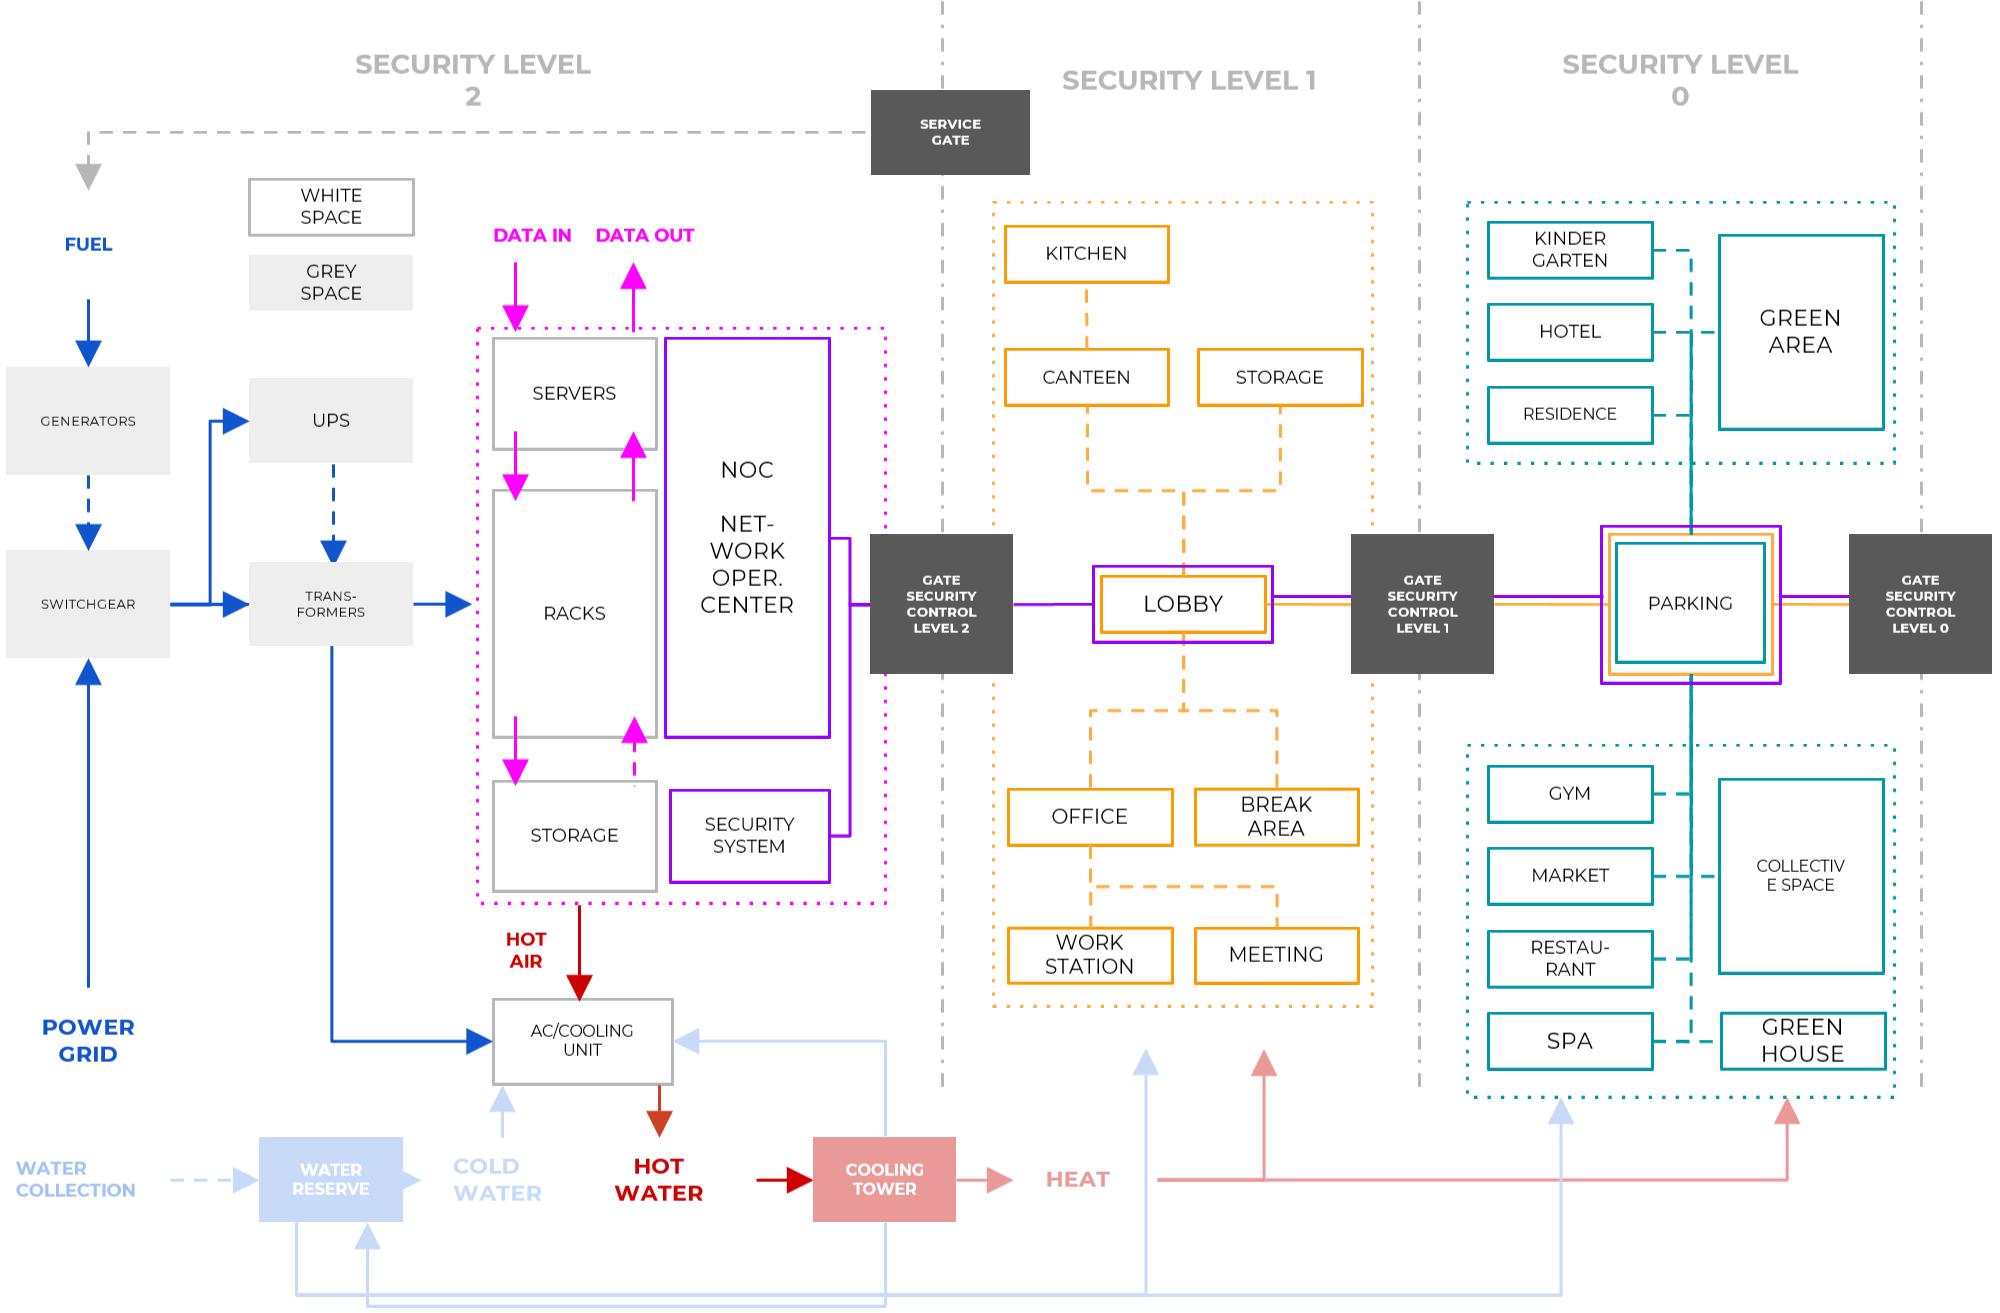
System on a chip is defined by the traditional components of the data center as shown on the topological map, which is the base of the modular aggregation strategy.
The modular system is developed focusing on easy assembly and disassembly, a uniform raster and a simple, but versatile steel structural system that can adapt to any kind of module aggregation. The connectivity to the main structural frame is achieved with inter-module connections. These structural components have good energy dissipating capability and offer good scaling opportunities. They also have efficient self-aligning/self-locating features, their installation require small number of tasks, easy access, simple tooling, are easy to disassemble and parts of the assembly can be reused. Locking devices structurally are less resilient, but much easier to assemble and disassemble, while bolted connections ensure load transfer with minimal distortion with moderate ease of assembly/disassembly. The IMC types can be freely customised according to the structural scenario and for any aggregation.

Our aggregation starts with a central core that spans in the long direction. At its base, we have the spaces that are accessed frequently as part of the daily operation such as MEP rooms or storage, that allows support to the modules for data halls, offices, and operational control rooms to be plugged in to this supporting core.

The core logic of the space program allows seamless expansions both horizontally and vertically.
Challenges
The building generation process is guided by external and internal challenges specific to data centers. External conditions include plot characteristics, topography, access points, setbacks, and maximum height, which define the building’s position and density. The structure can adapt to different FAR requirements and climatic conditions, leveraging prevailing winds for natural ventilation. An IT capacity target, the key benchmark for classifying data centers, can also be set. This is tied to data hall size, server density, and cooling capabilities, regulated by the air cooling density parameter.
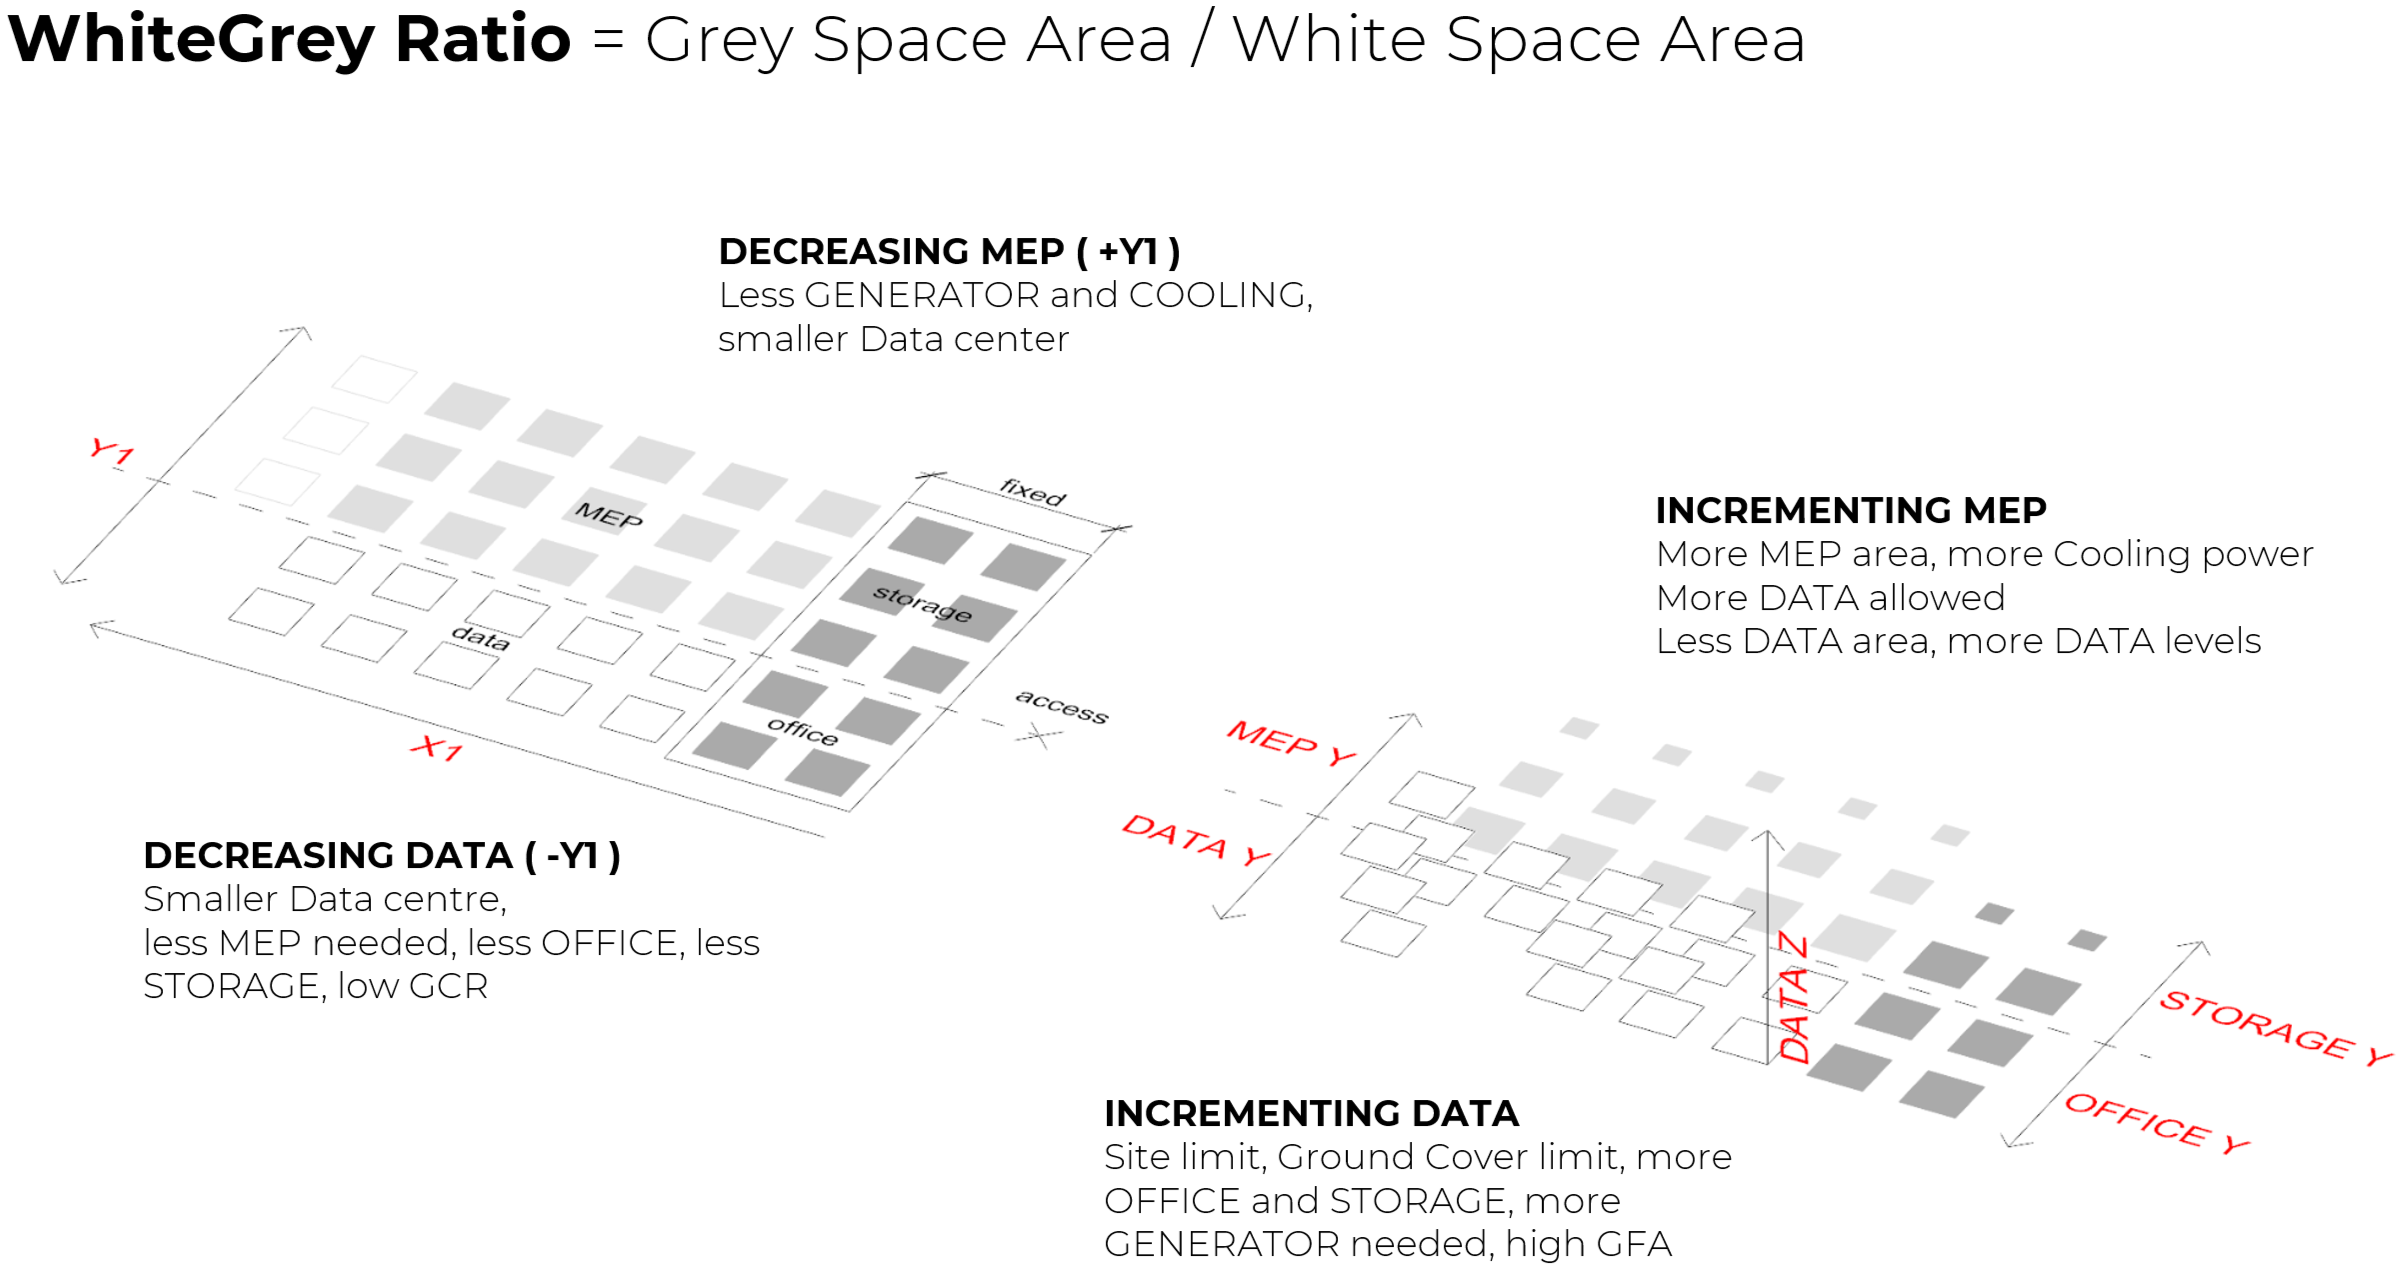
Two unique metrics define a data center’s functionality and efficiency. The first is the White-Grey ratio, targeting a value above 1, with higher ratios (1.2–1.5) achieved in Hyperscale Data Centers through density optimization.
The second is PUE (Power Usage Effectiveness), measuring Total Facility Energy versus IT Energy, with our design targeting a PUE of 1.2–1.5 for good energy efficiency.
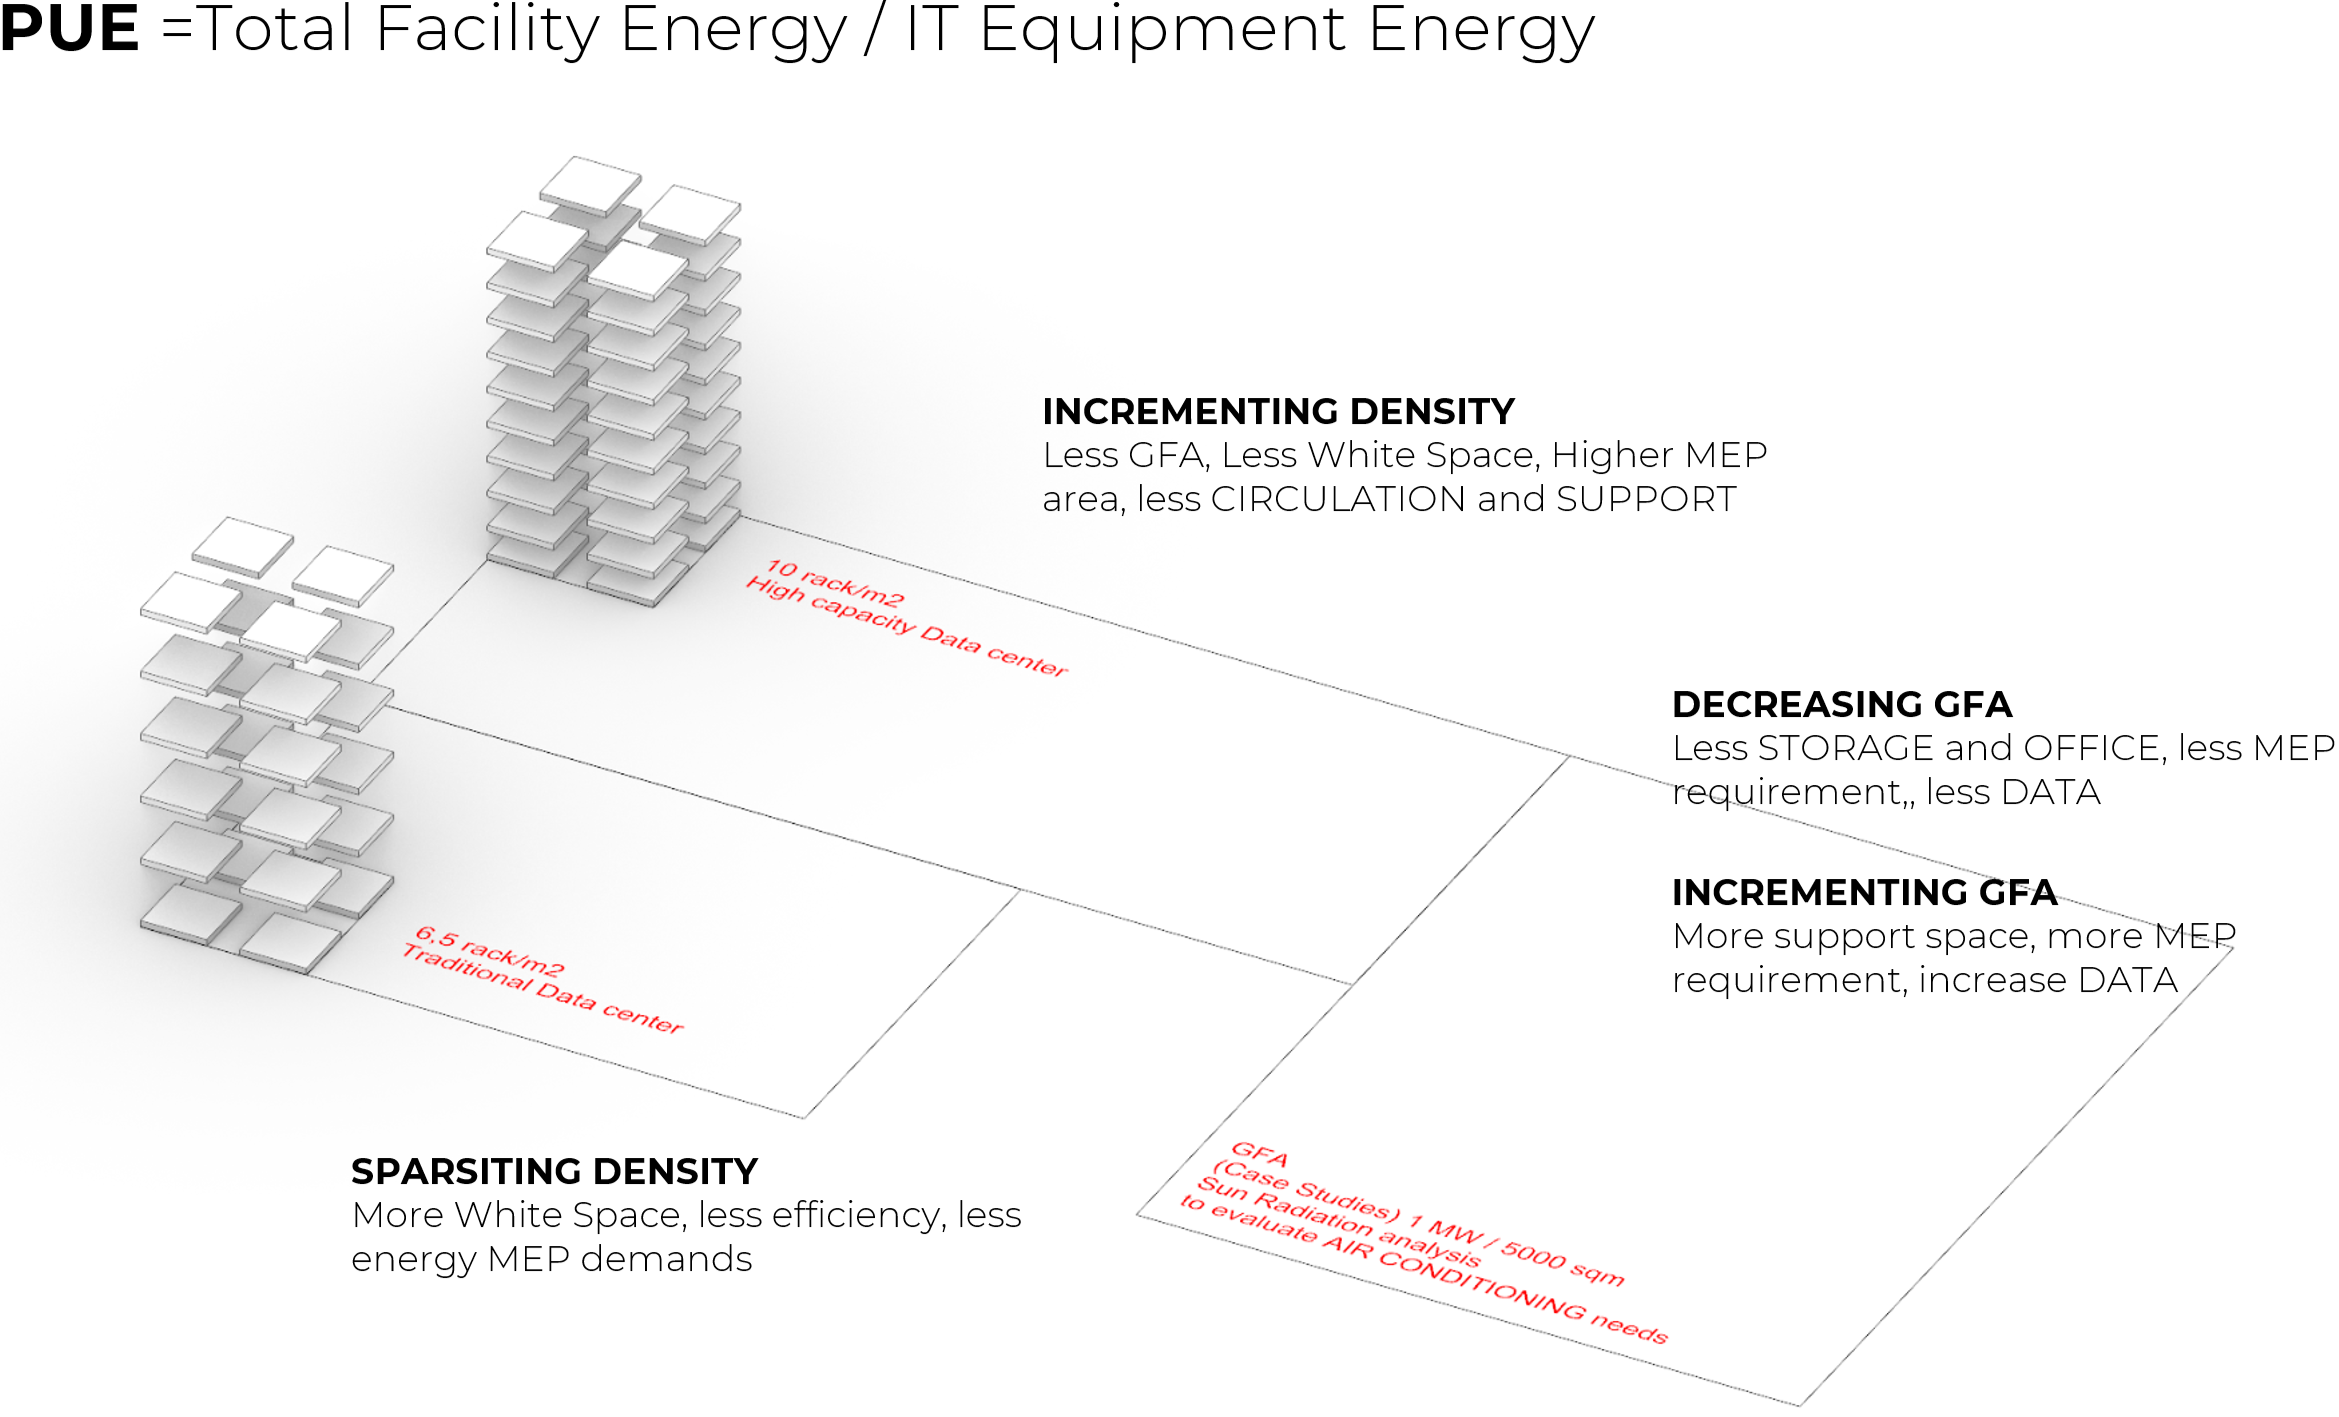
Finally, IT capacity cannot exceed cooling capacity, ensuring a balance between energy demands.
Workflow – Pseudo Code
The building generation starts with inputs such as plot surface (flat or sloped), FAR, setbacks, and maximum height, which define its position and density at the urban level. Optionally, IT capacity can be set to determine the scale, with the resulting output being the building’s boundary for further steps.
After wind analysis, the building’s orientation is adjusted to fit the plot shape and slope. The axis can also shift to align with entrances or specific site conditions, producing a Direction Line that guides development.
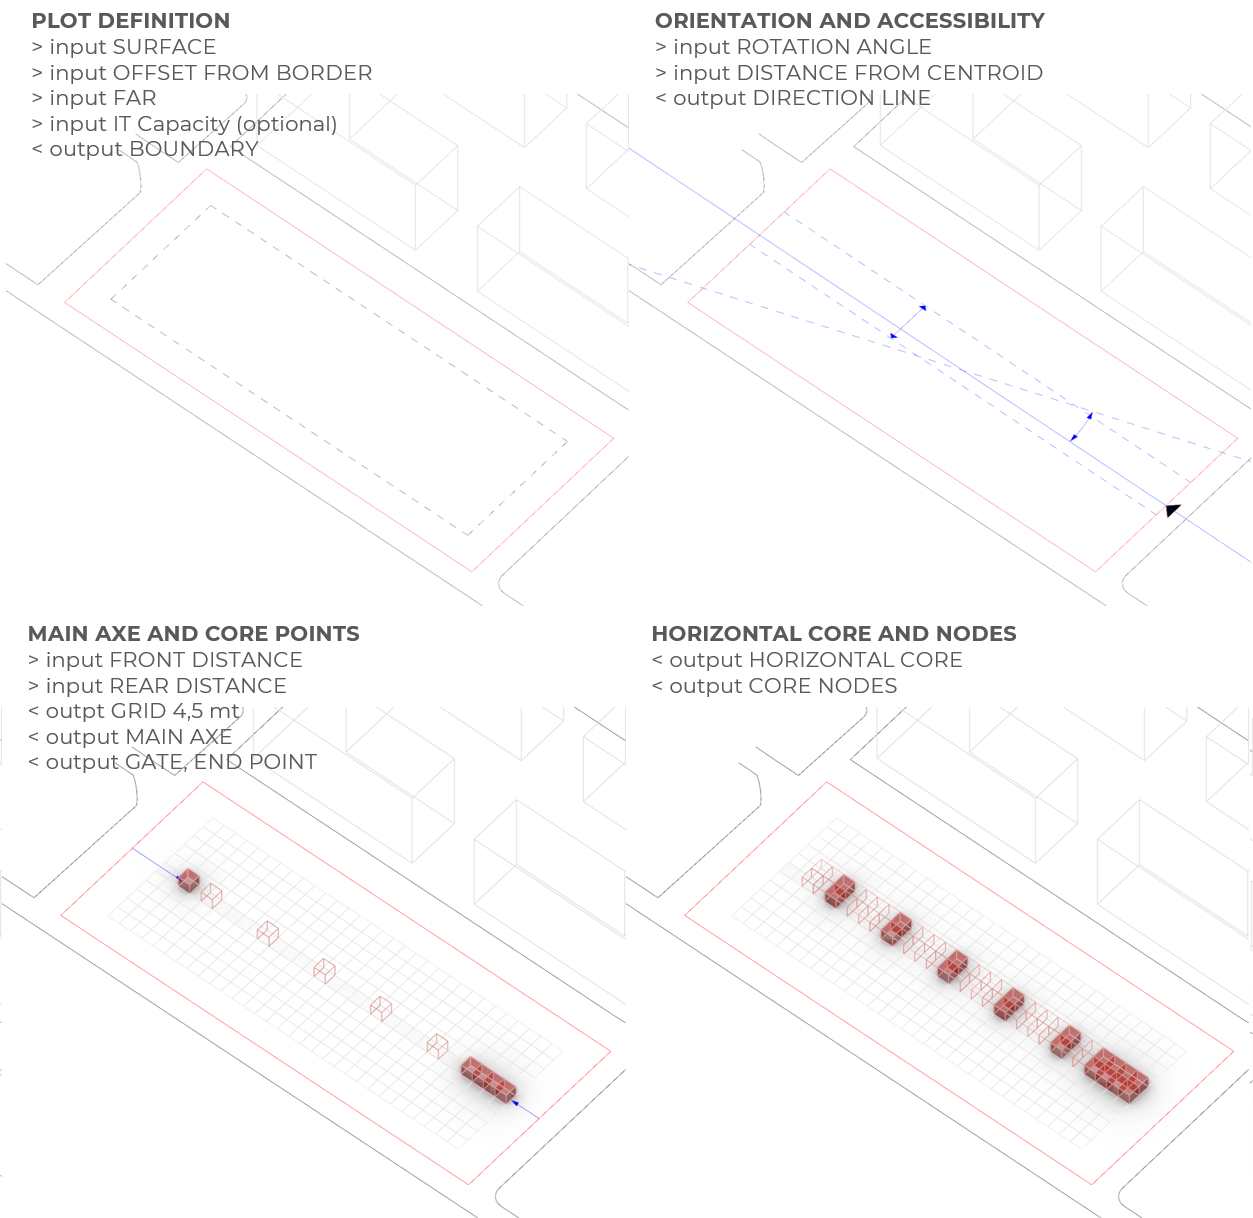
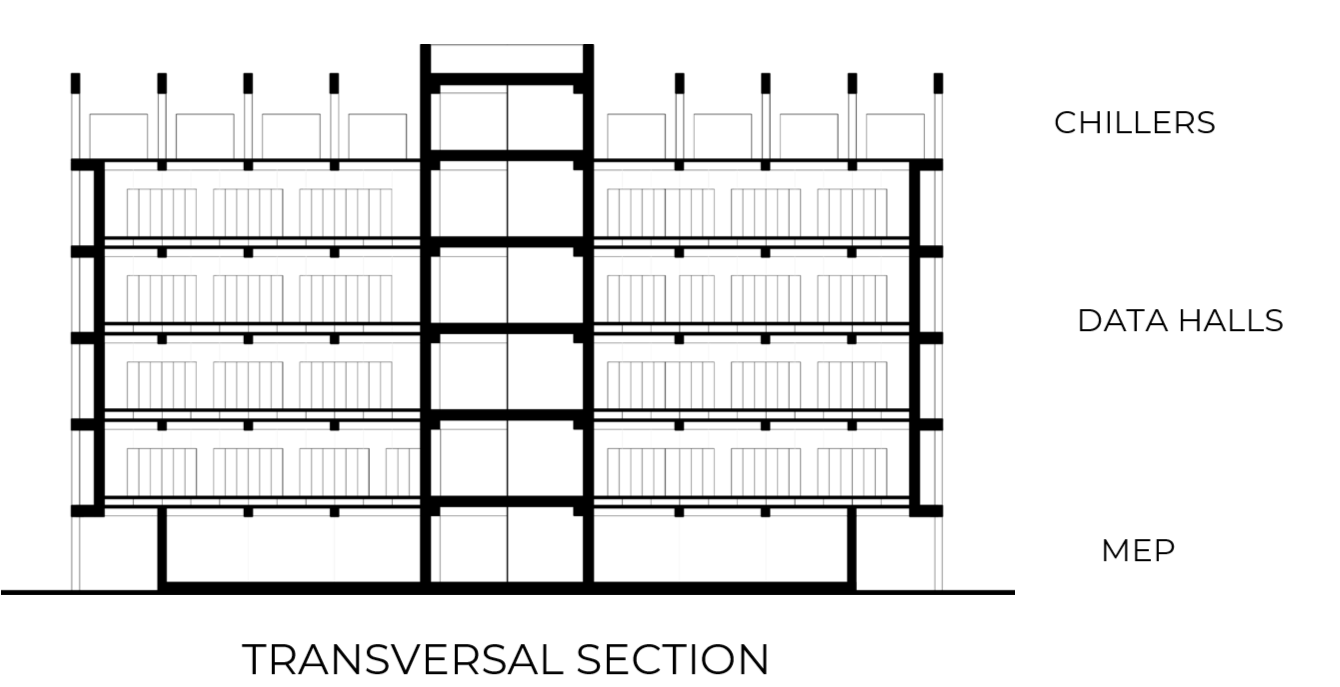
Using this line and a 4.5-meter grid, we define the horizontal core as the structural and circulation backbone, with nodes acting as connection points for vertical circulation and MEP systems. Main functions branch out horizontally, with MEP on the ground floor for heavy machinery, the data hall from the first floor up, and air cooling equipment on top. Control rooms, storage, and offices are linked to the gate.
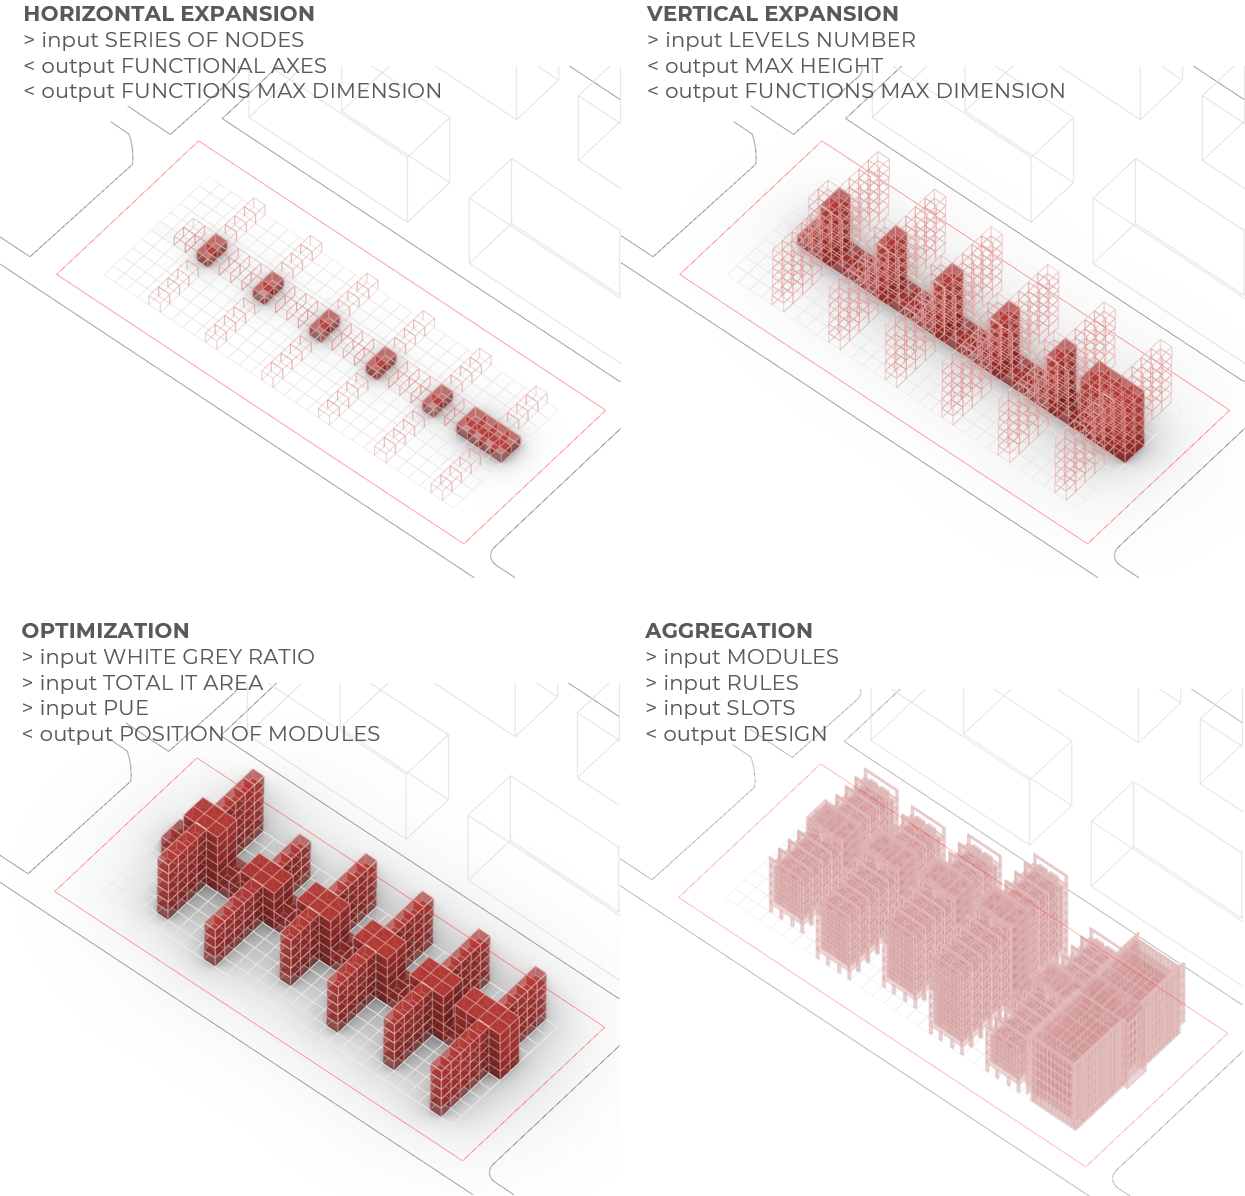
Finally, Monoceros aggregates the modules based on rules, ensuring a functional and valid configuration. We used Monoceros not as form finding tool, but as a very efficient Module placer, and the Rules serve as validation of the result.
Module Catalogue
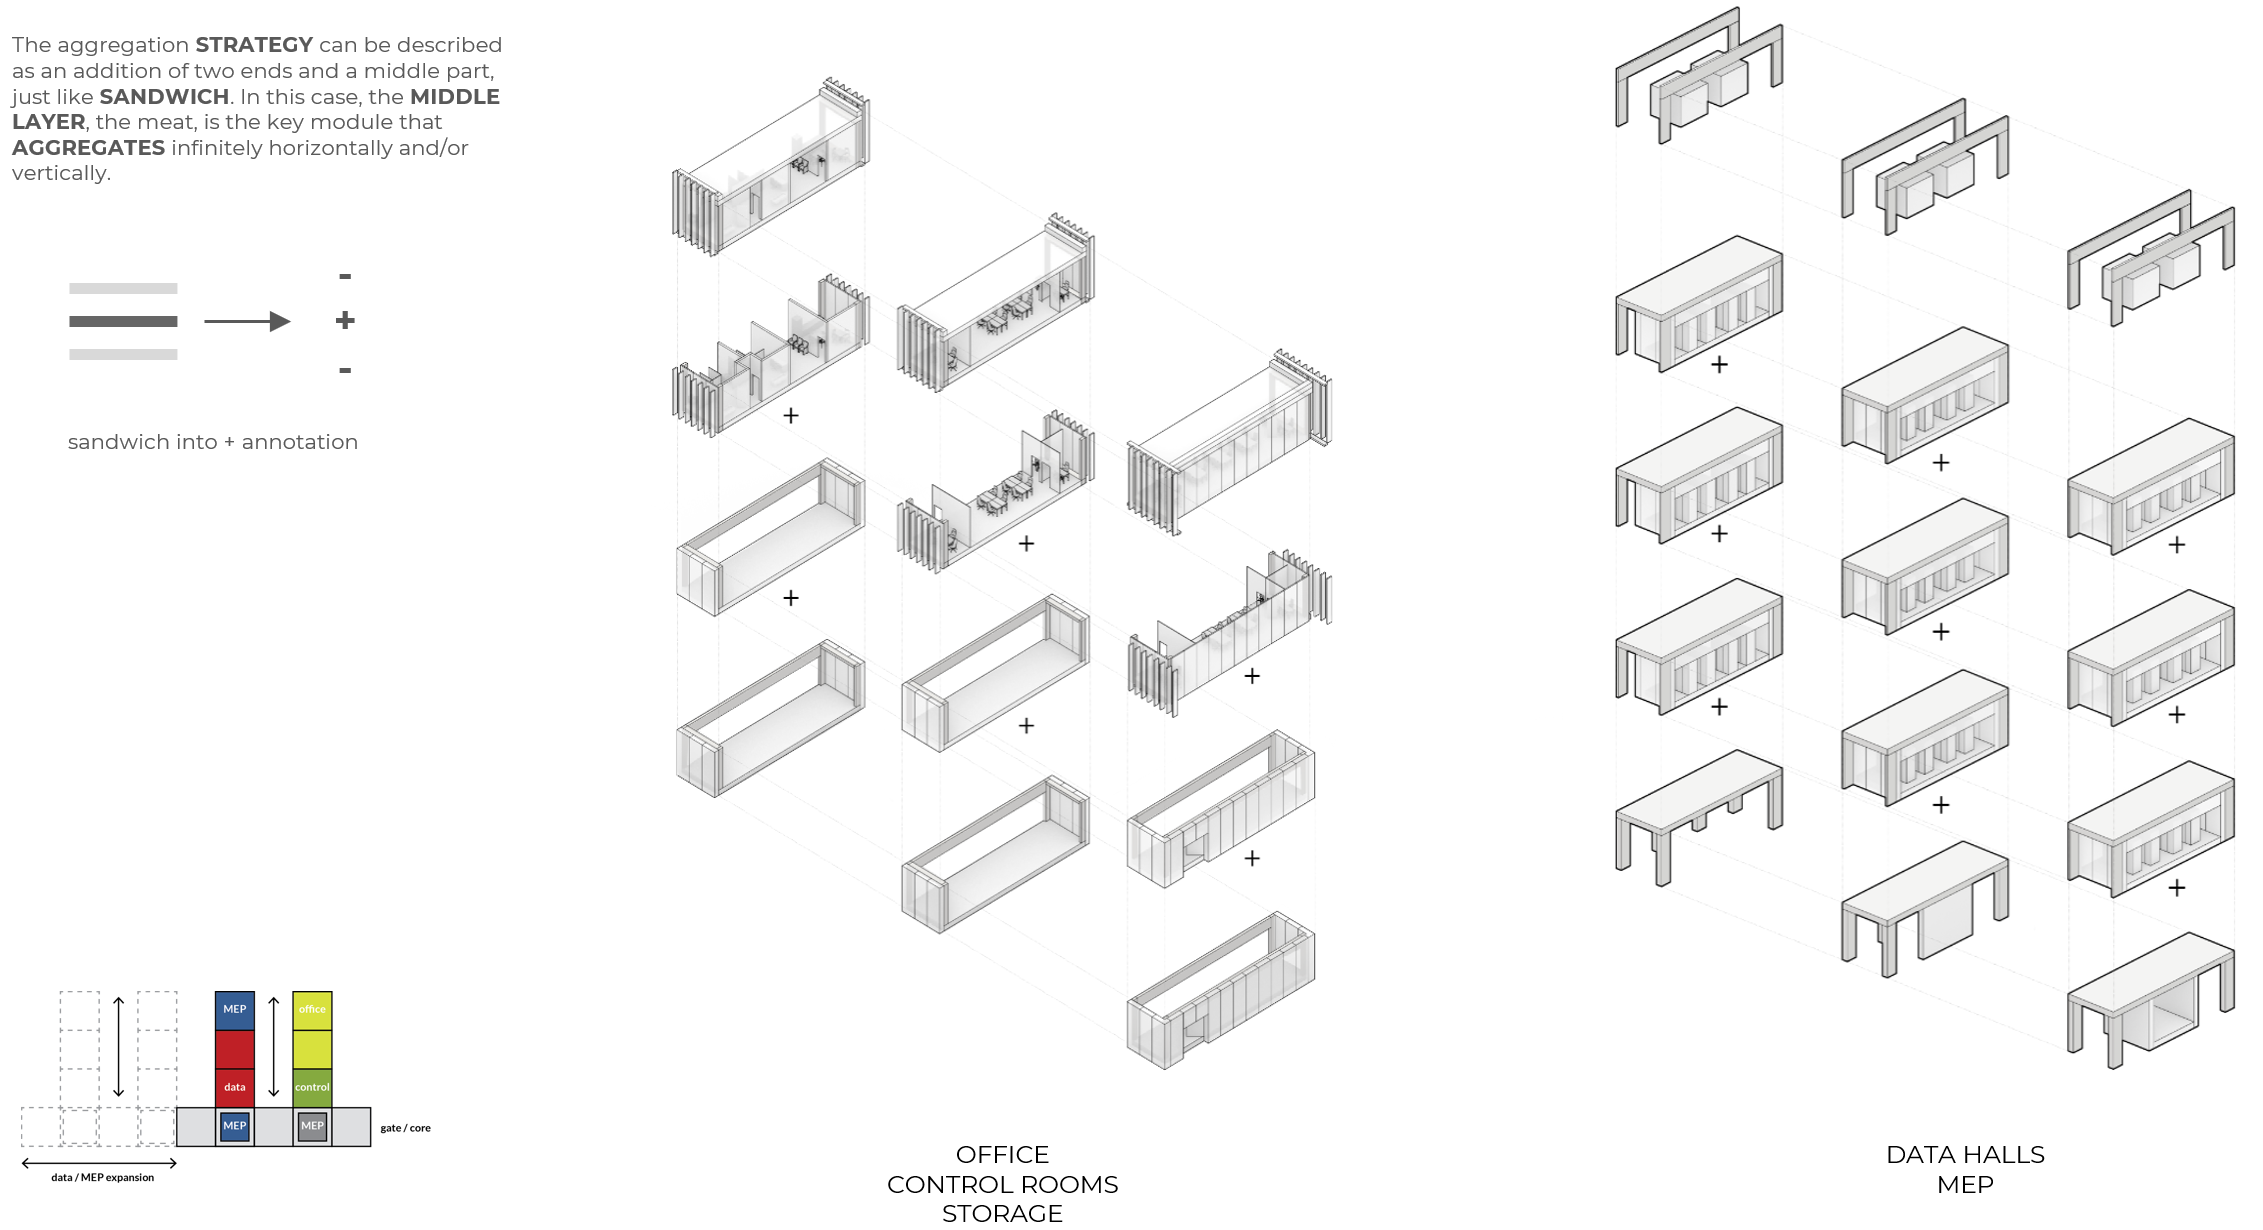
Following our topological map, we defined our aggregation strategy for the main modules in our building. Here we can see how the different program modules work together. With a support gate and core corridor spanning the long direction of our site, we branch off perpendicularly with data halls, MEP, and offices, control rooms, and storages.
Our logic for module aggregation can be compared to a sandwich, in which we have two end pieces (the bread), and a middle layer (the meat). The module end pieces are fixed, and the middle layer modules are designed to be aggregated indefinitely in the horizontal and vertical direction. In these figures, those are identified with a plus sign.
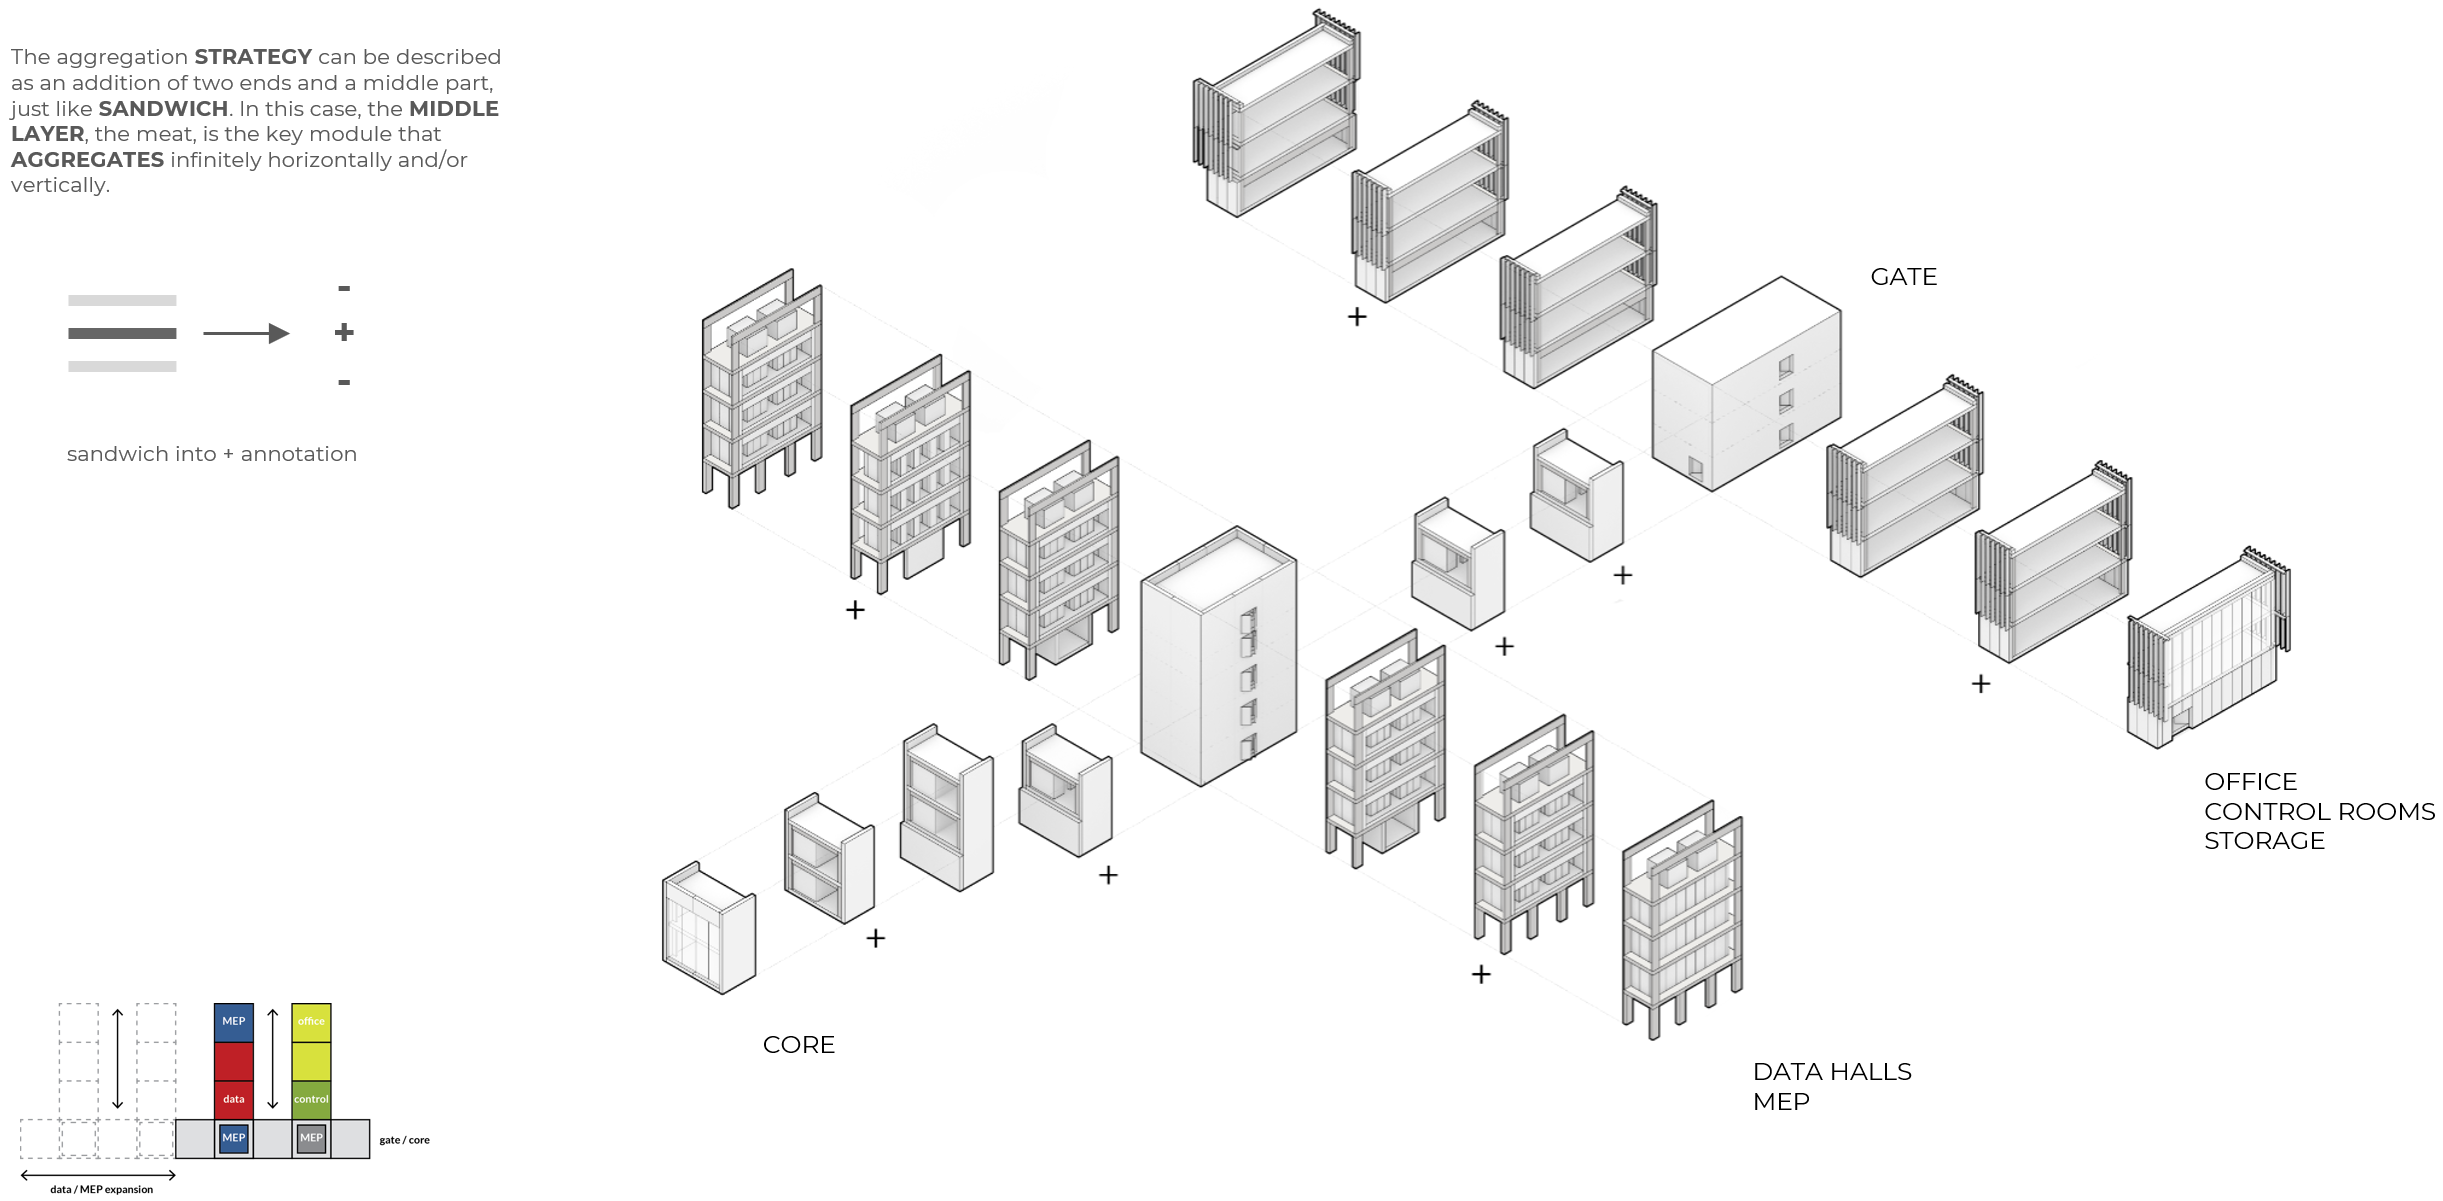
The same sandwich strategy follows the modules at a smaller scale, now we see how they aggregate to form individual programs. Again, the middle layers, identified with a plus sign, can aggregate indefinitely under the support of the end pieces.
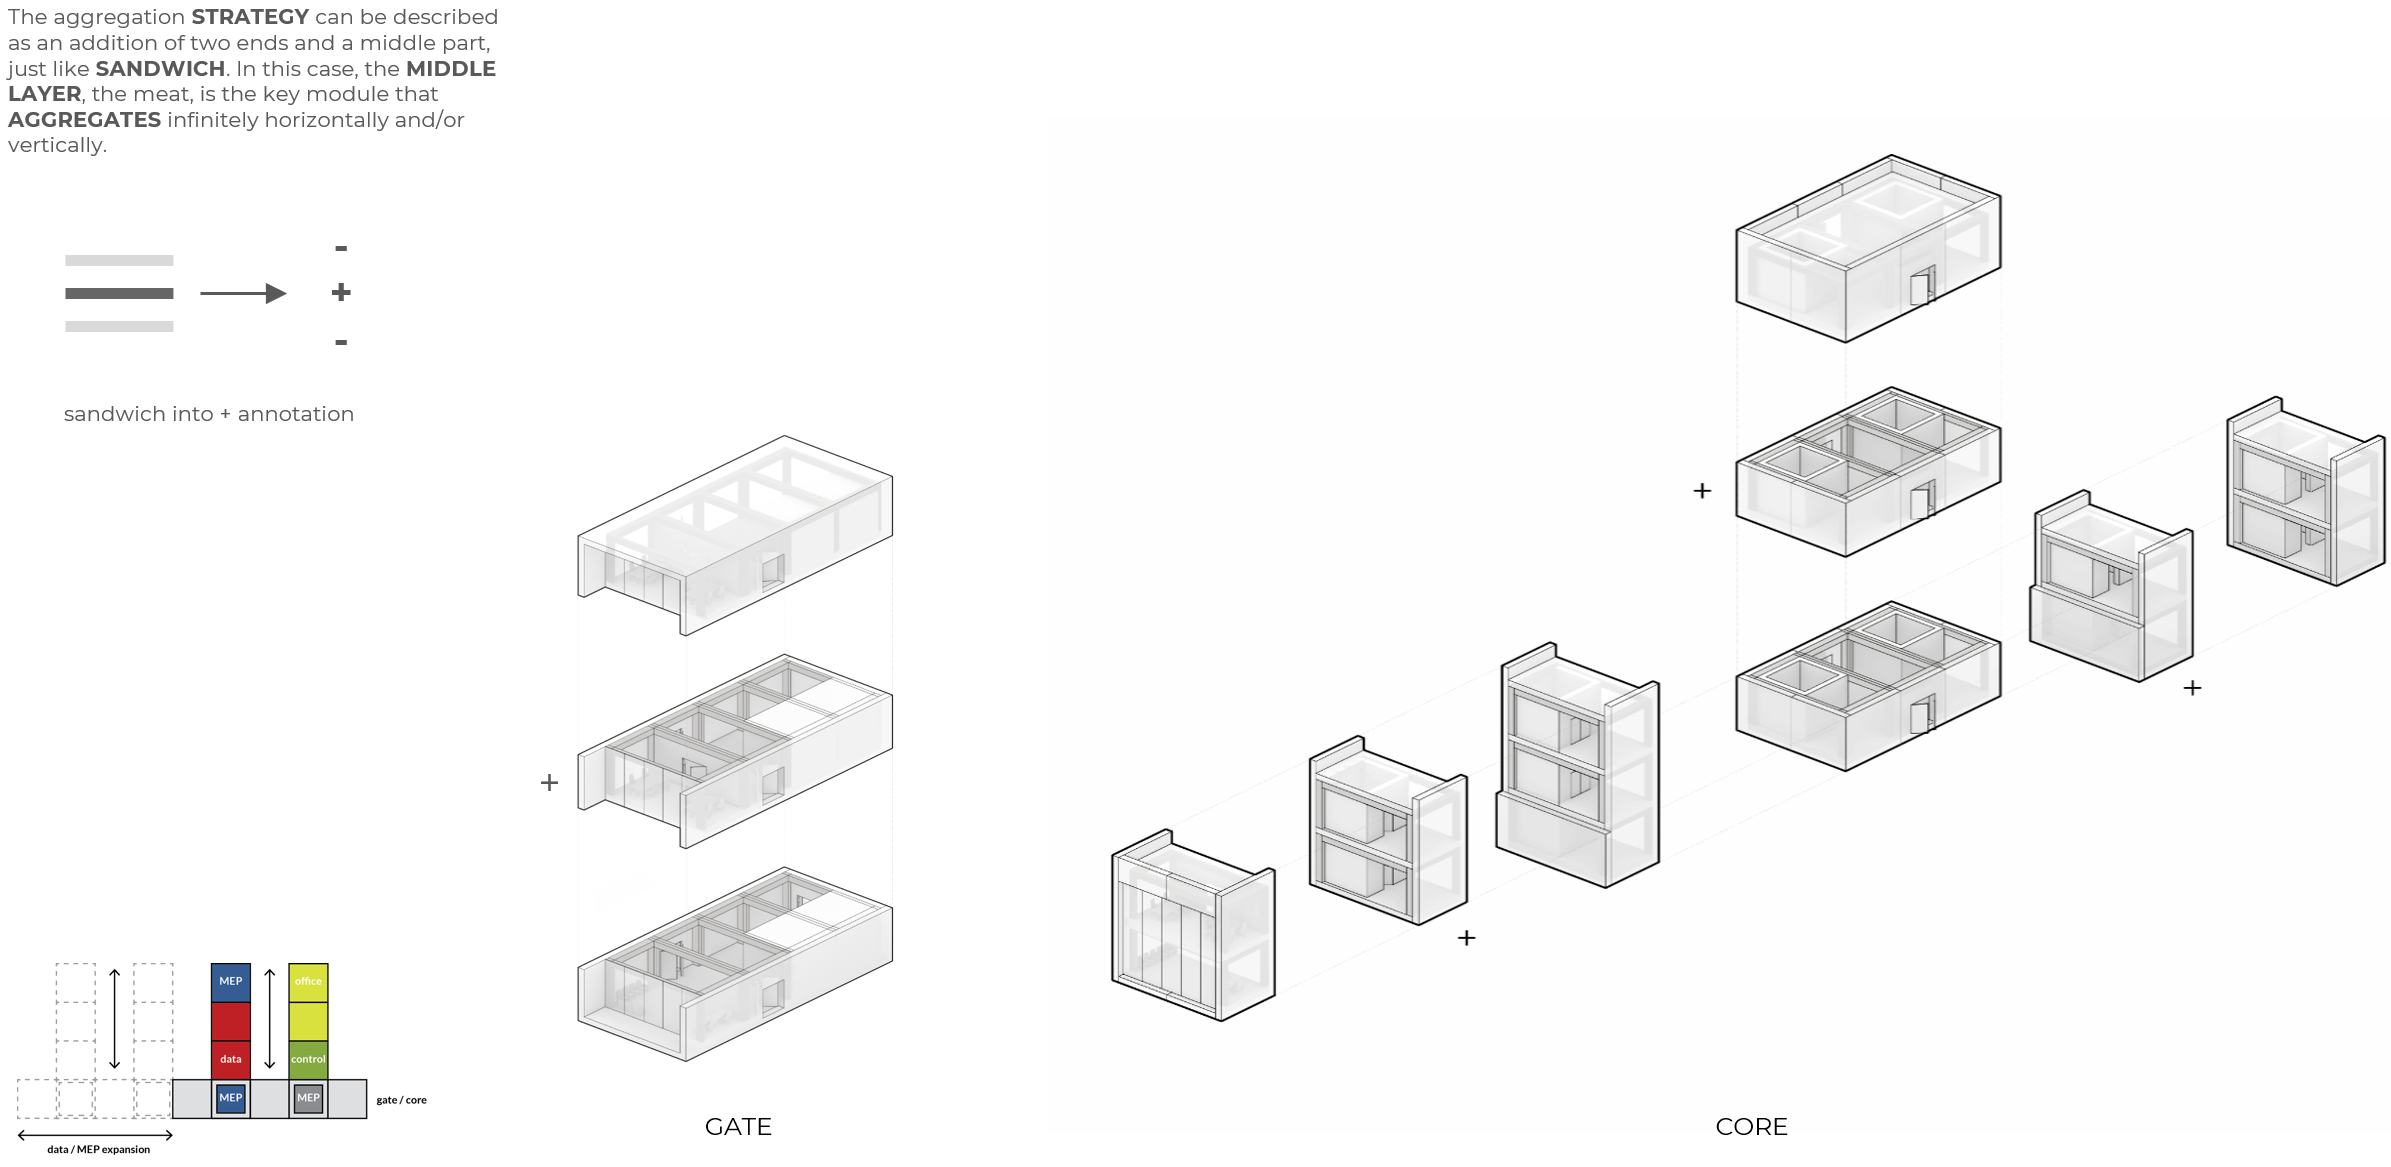
Now we see this strategy incorporated at a slightly larger building scale.
Design – Hyperdata
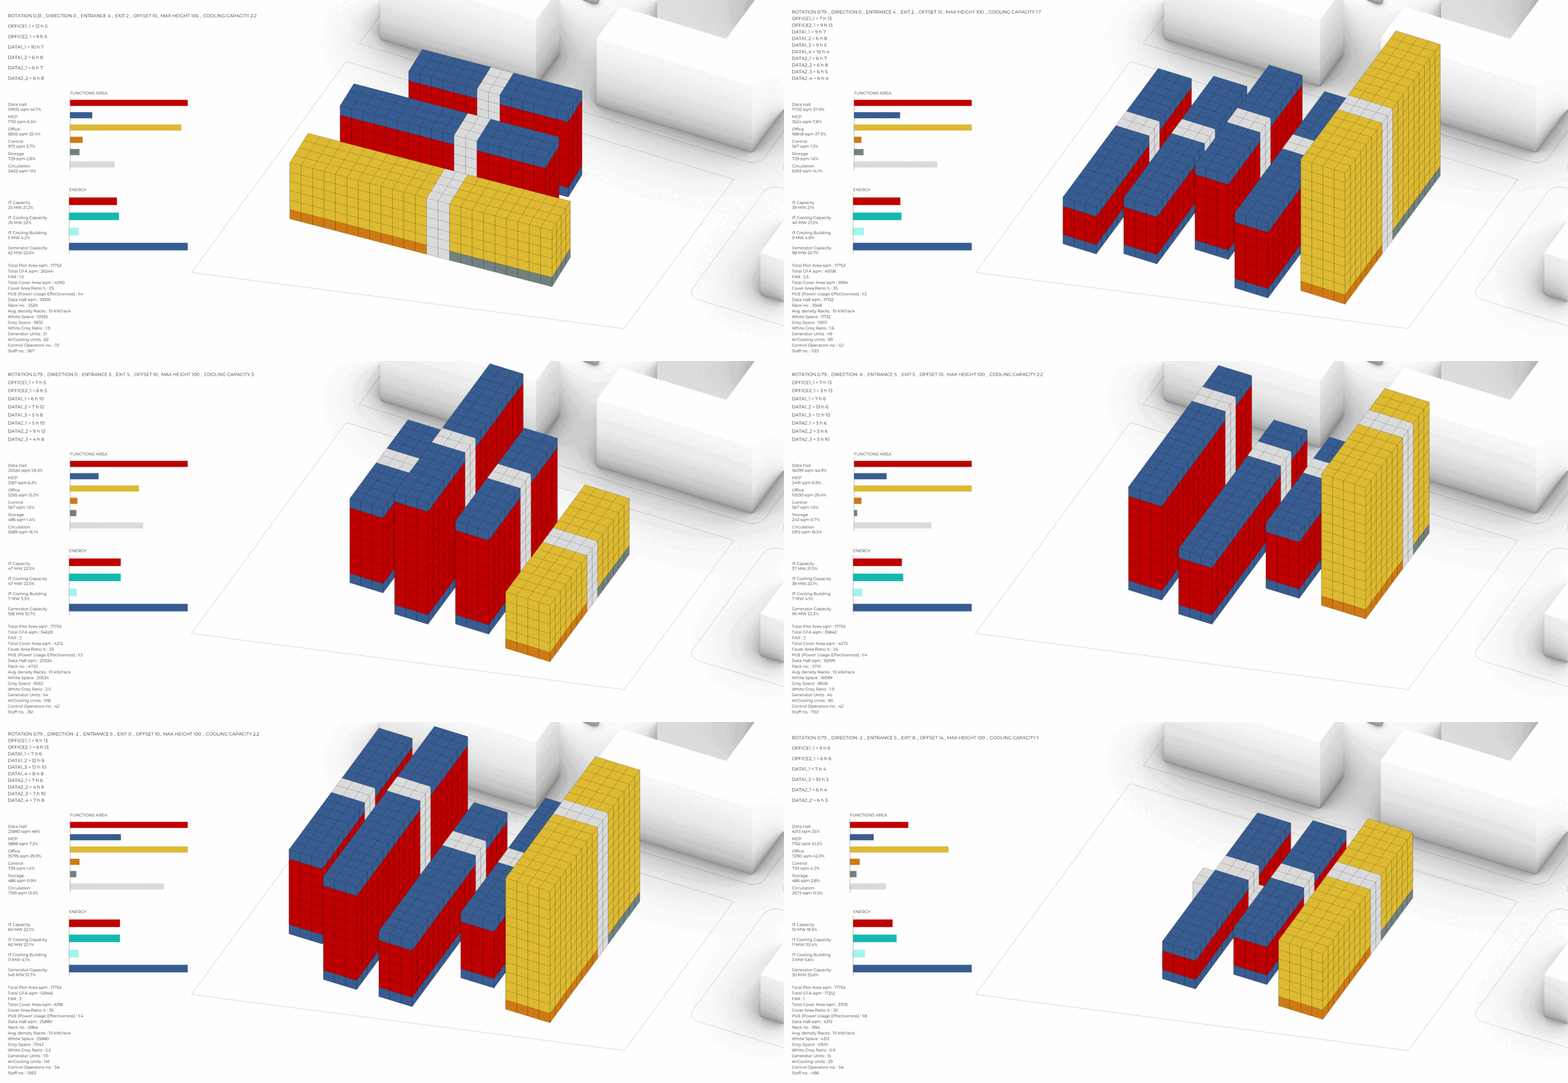
The aggregation definition rely on several parameters that we can control. The position of the central line, its rotation and direction, the position of the entrances, the offset, maximum height that can be set and the cooling capacity. We also have all the data that help us to retrieve this particular condition. With the numbers of modules and each of their height, before the aggregation with Monoceros we are able to control the whole functional area – the percentage of the data halls, the MEP space, the office space, the control room, the storage and circulation.
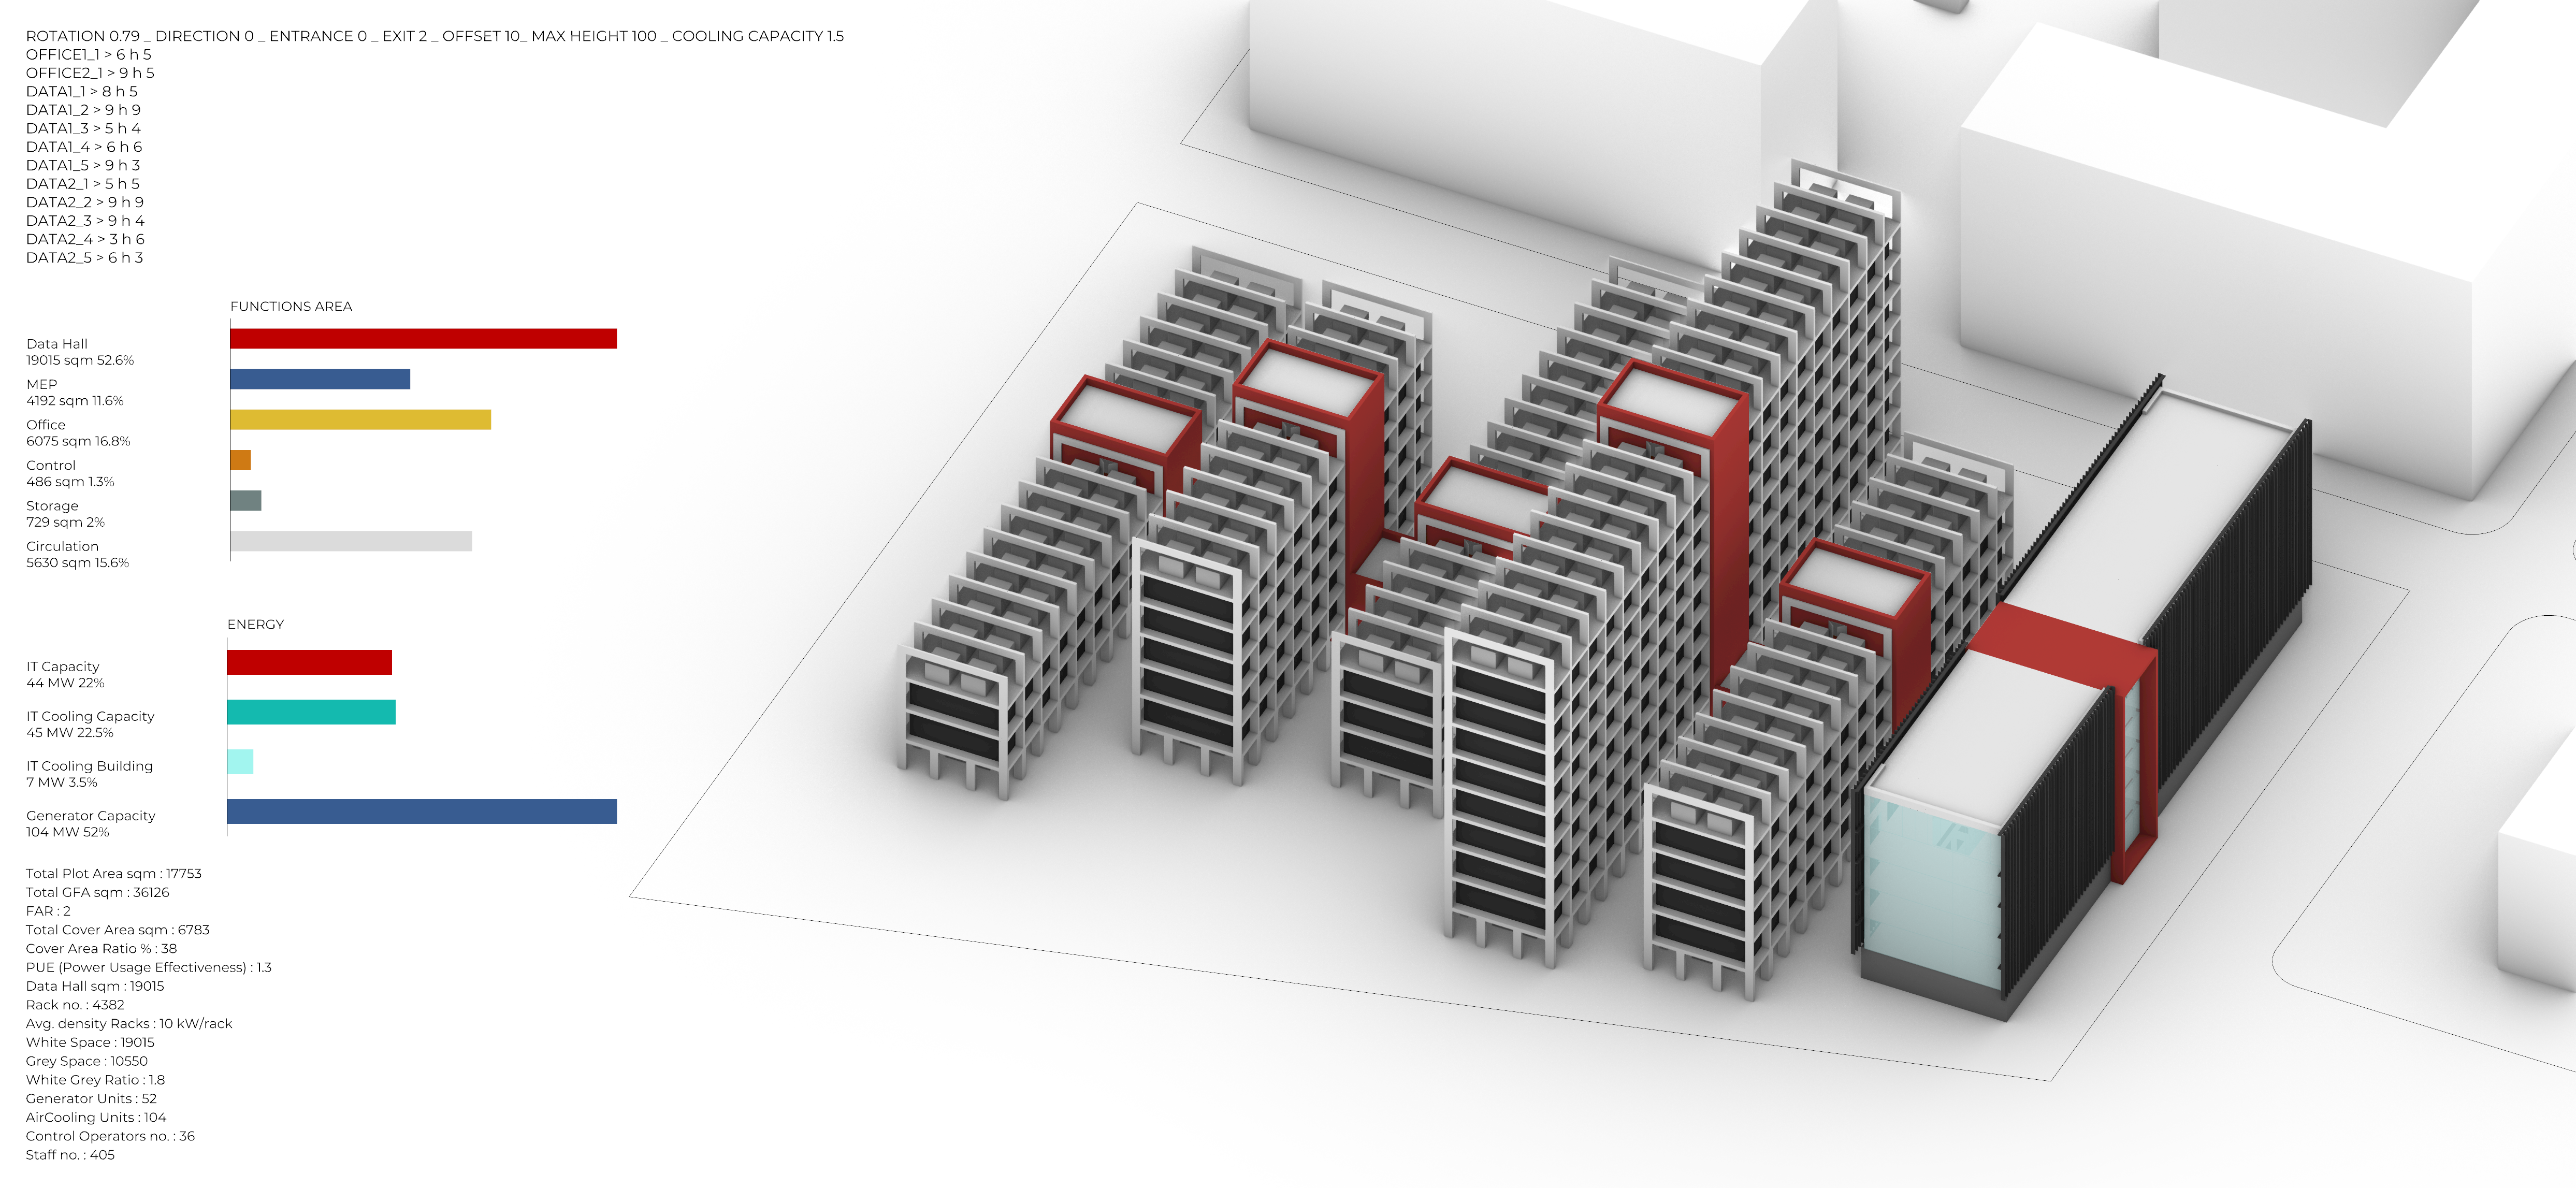
We also control the energy. The IT capacity has to be less than the IT cooling capacity. We considered that there is an IT cooling capacity for the entire building that we evaluated as 1 MW per 5000 SQM, the FAR, the white and grey space ratio, the number of generators that we have, the number of chillers that we need and how many control operators can sit in our space.
Iteration with Data
The iterations show the potential expansion of the facility, how it can react to changing FAR conditions, changing of white and grey space ratio or office floor area, while controlling the energy capacity.
Sorting results
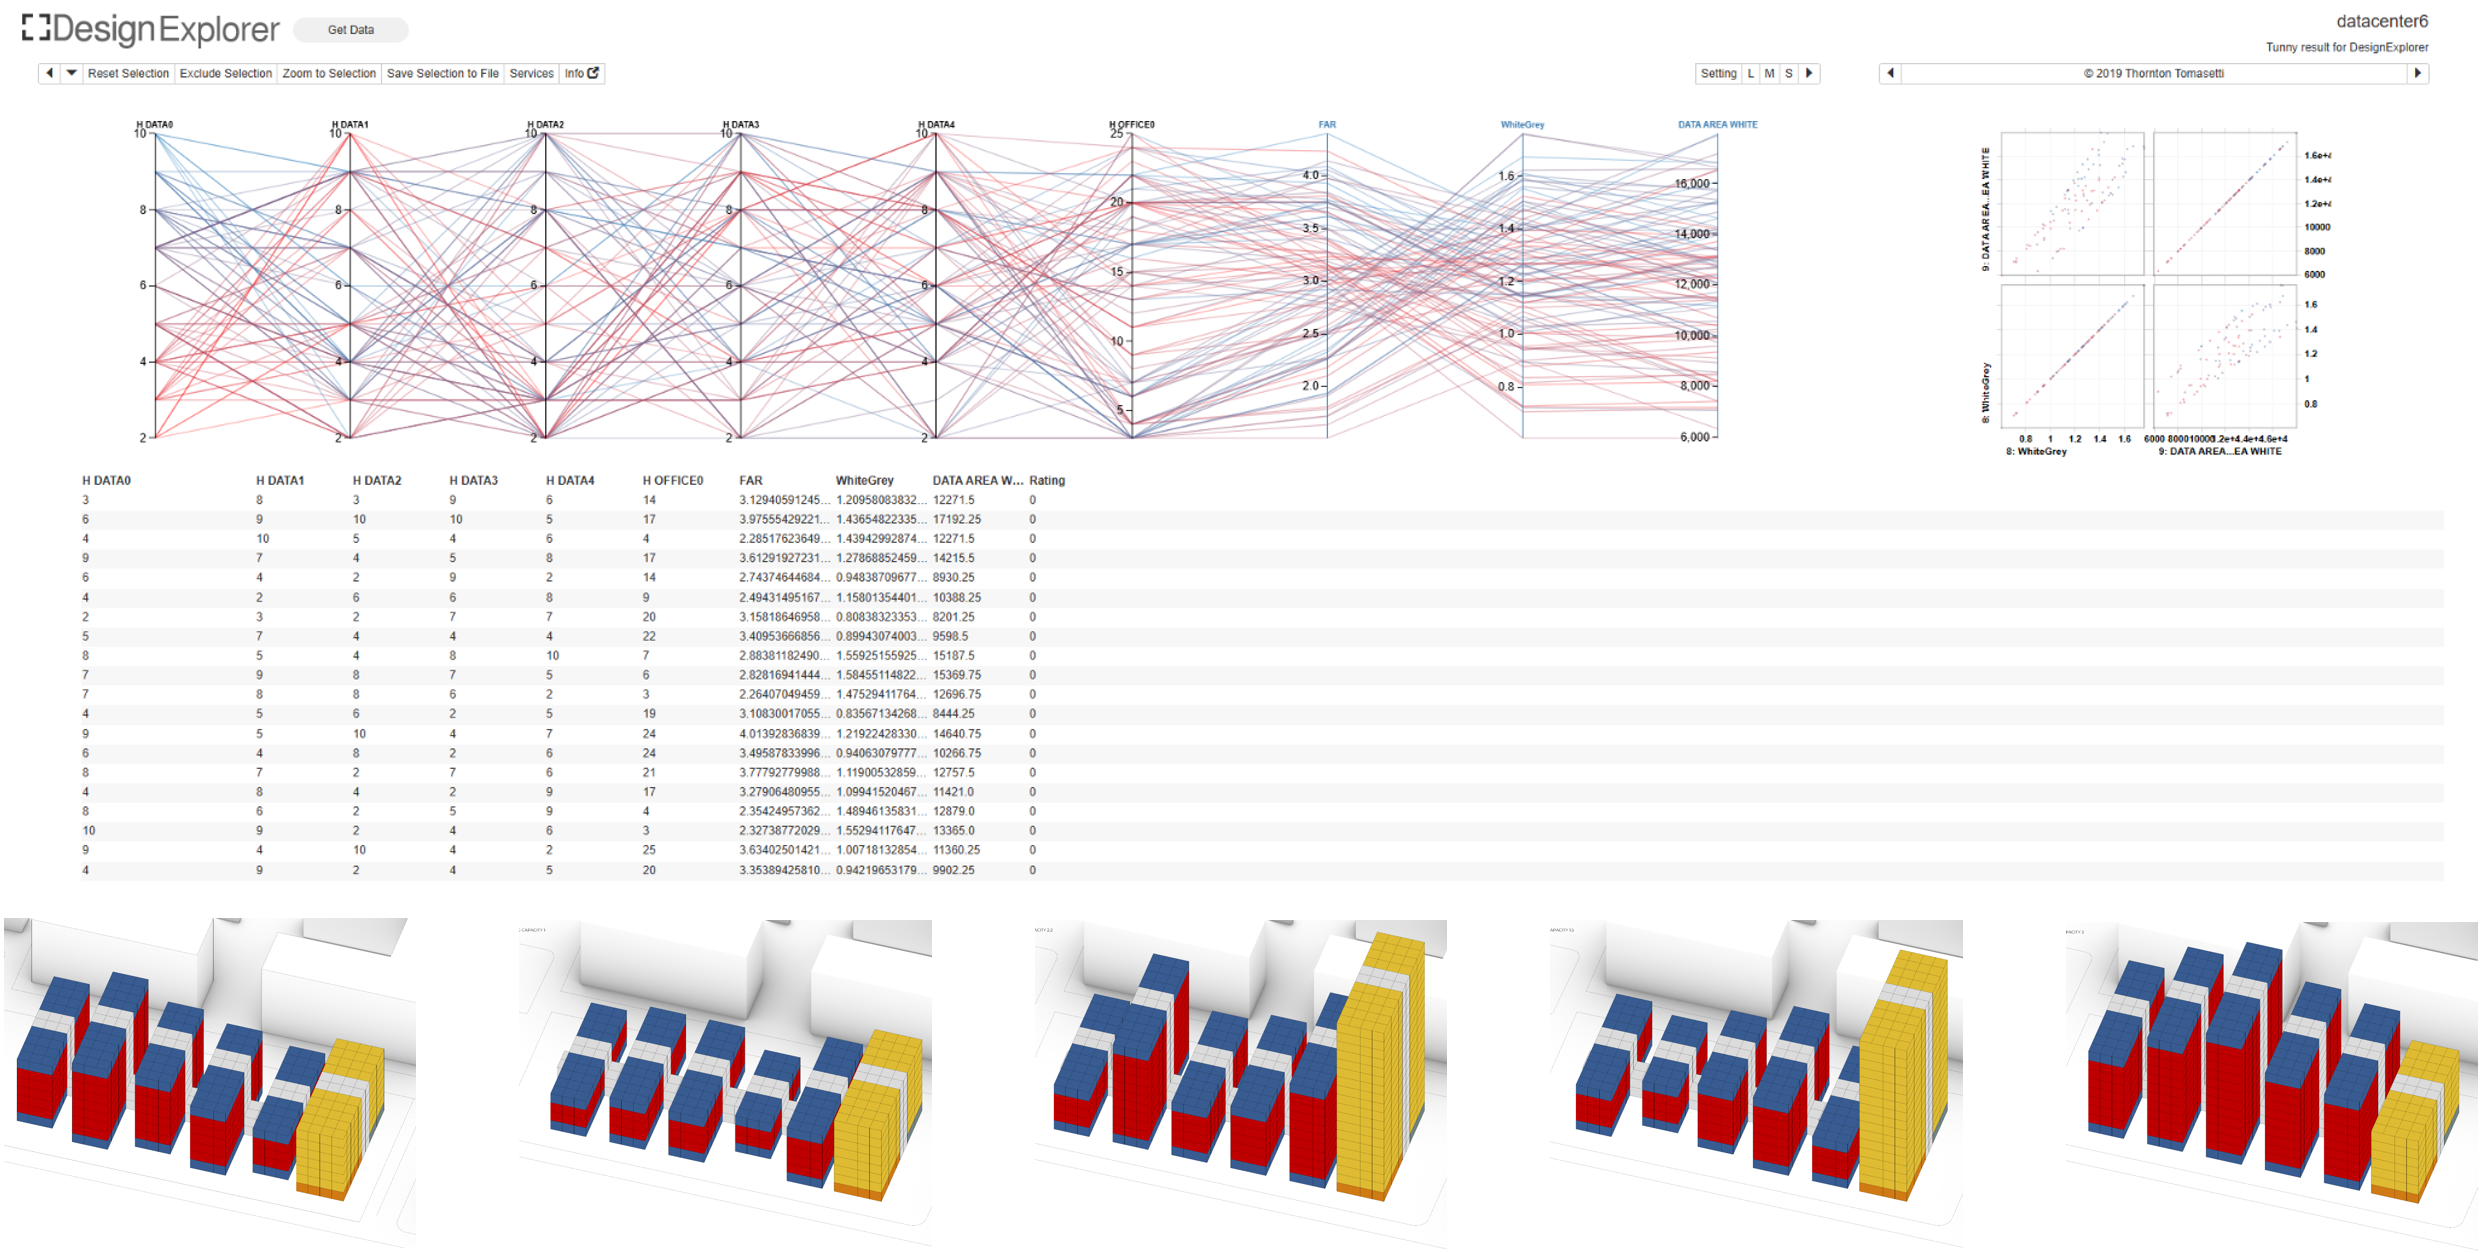
Using Tunny and Design Explorer, we evaluate and sort the desired options. After running 200 or more iterations, we begin to understand how to achieve the specified targets and how they relate to functional areas and the two main metrics: White-Grey ratio and FAR in this case. It’s important to note that this is not a pure optimization process. In the case of a data center, constraints related to power generators and equipment significantly limit the possible expansion of the data hall.
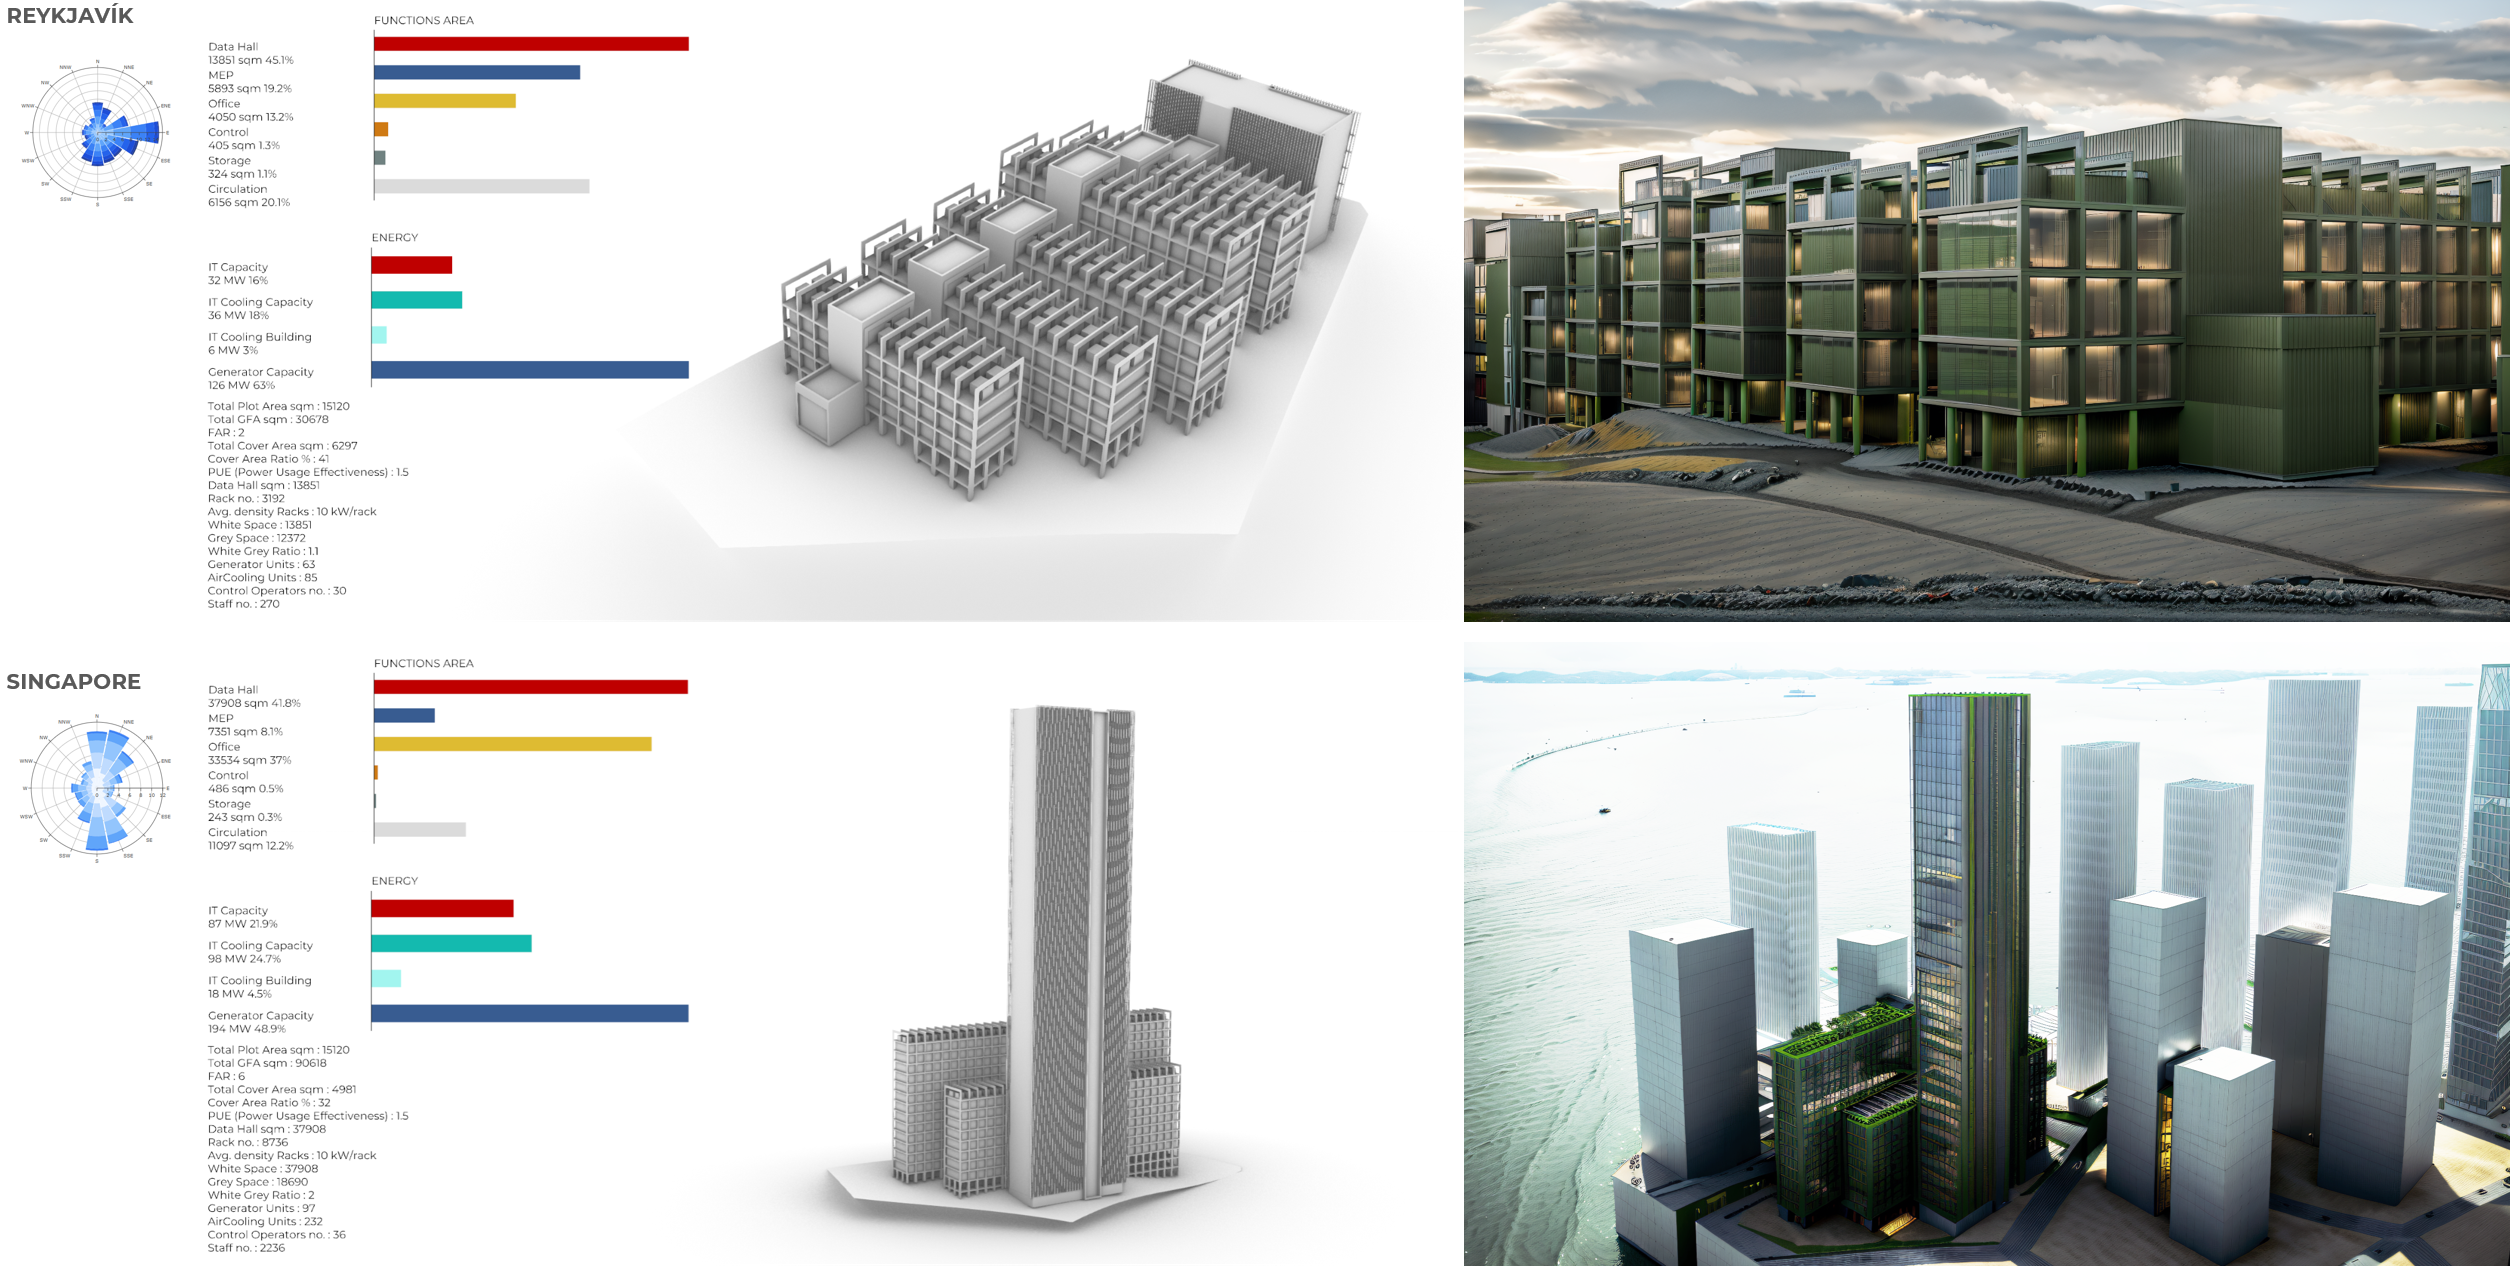
We also aimed to be as realistic as possible, considering metrics that rarely intersect with the architectural definition of a data center, and we find this as challenging as rewarding for the control we were able to obtain on the overall design.
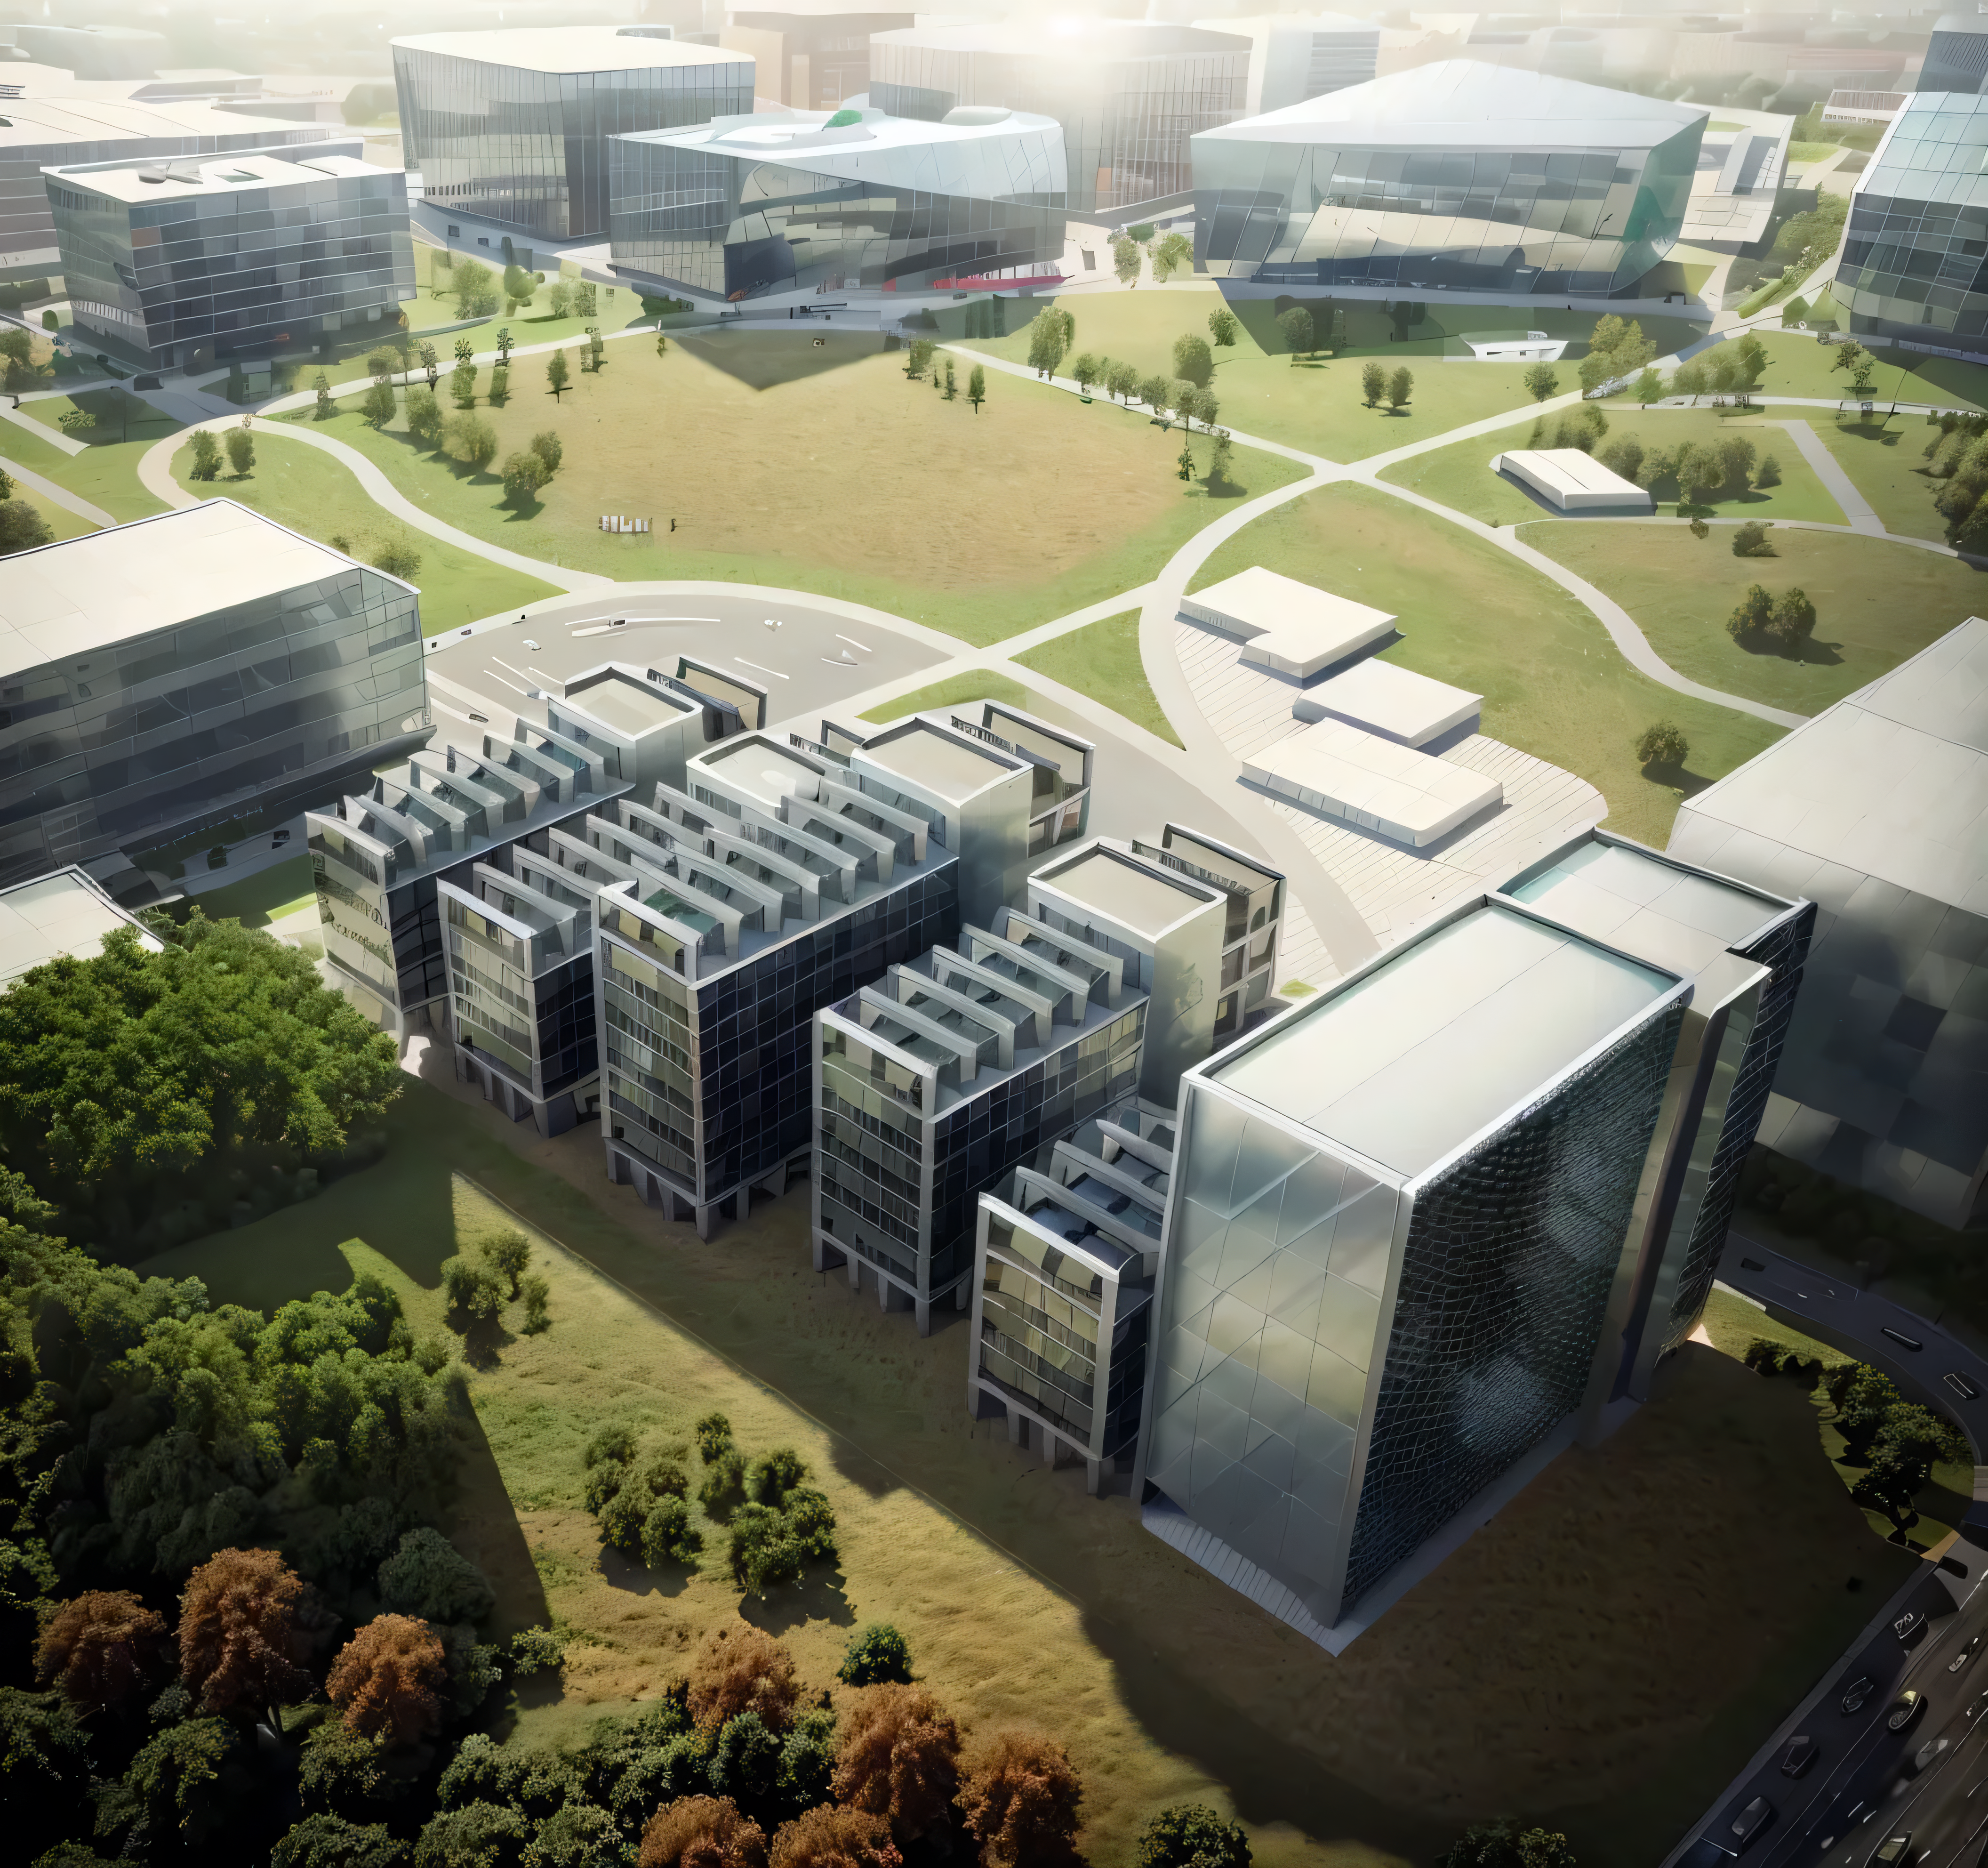
For the common plot in Singapore and Reykjavik we chose to show two completely different configurations, taking into consideration the different direction of the wind and the slope.
Plans and Sections
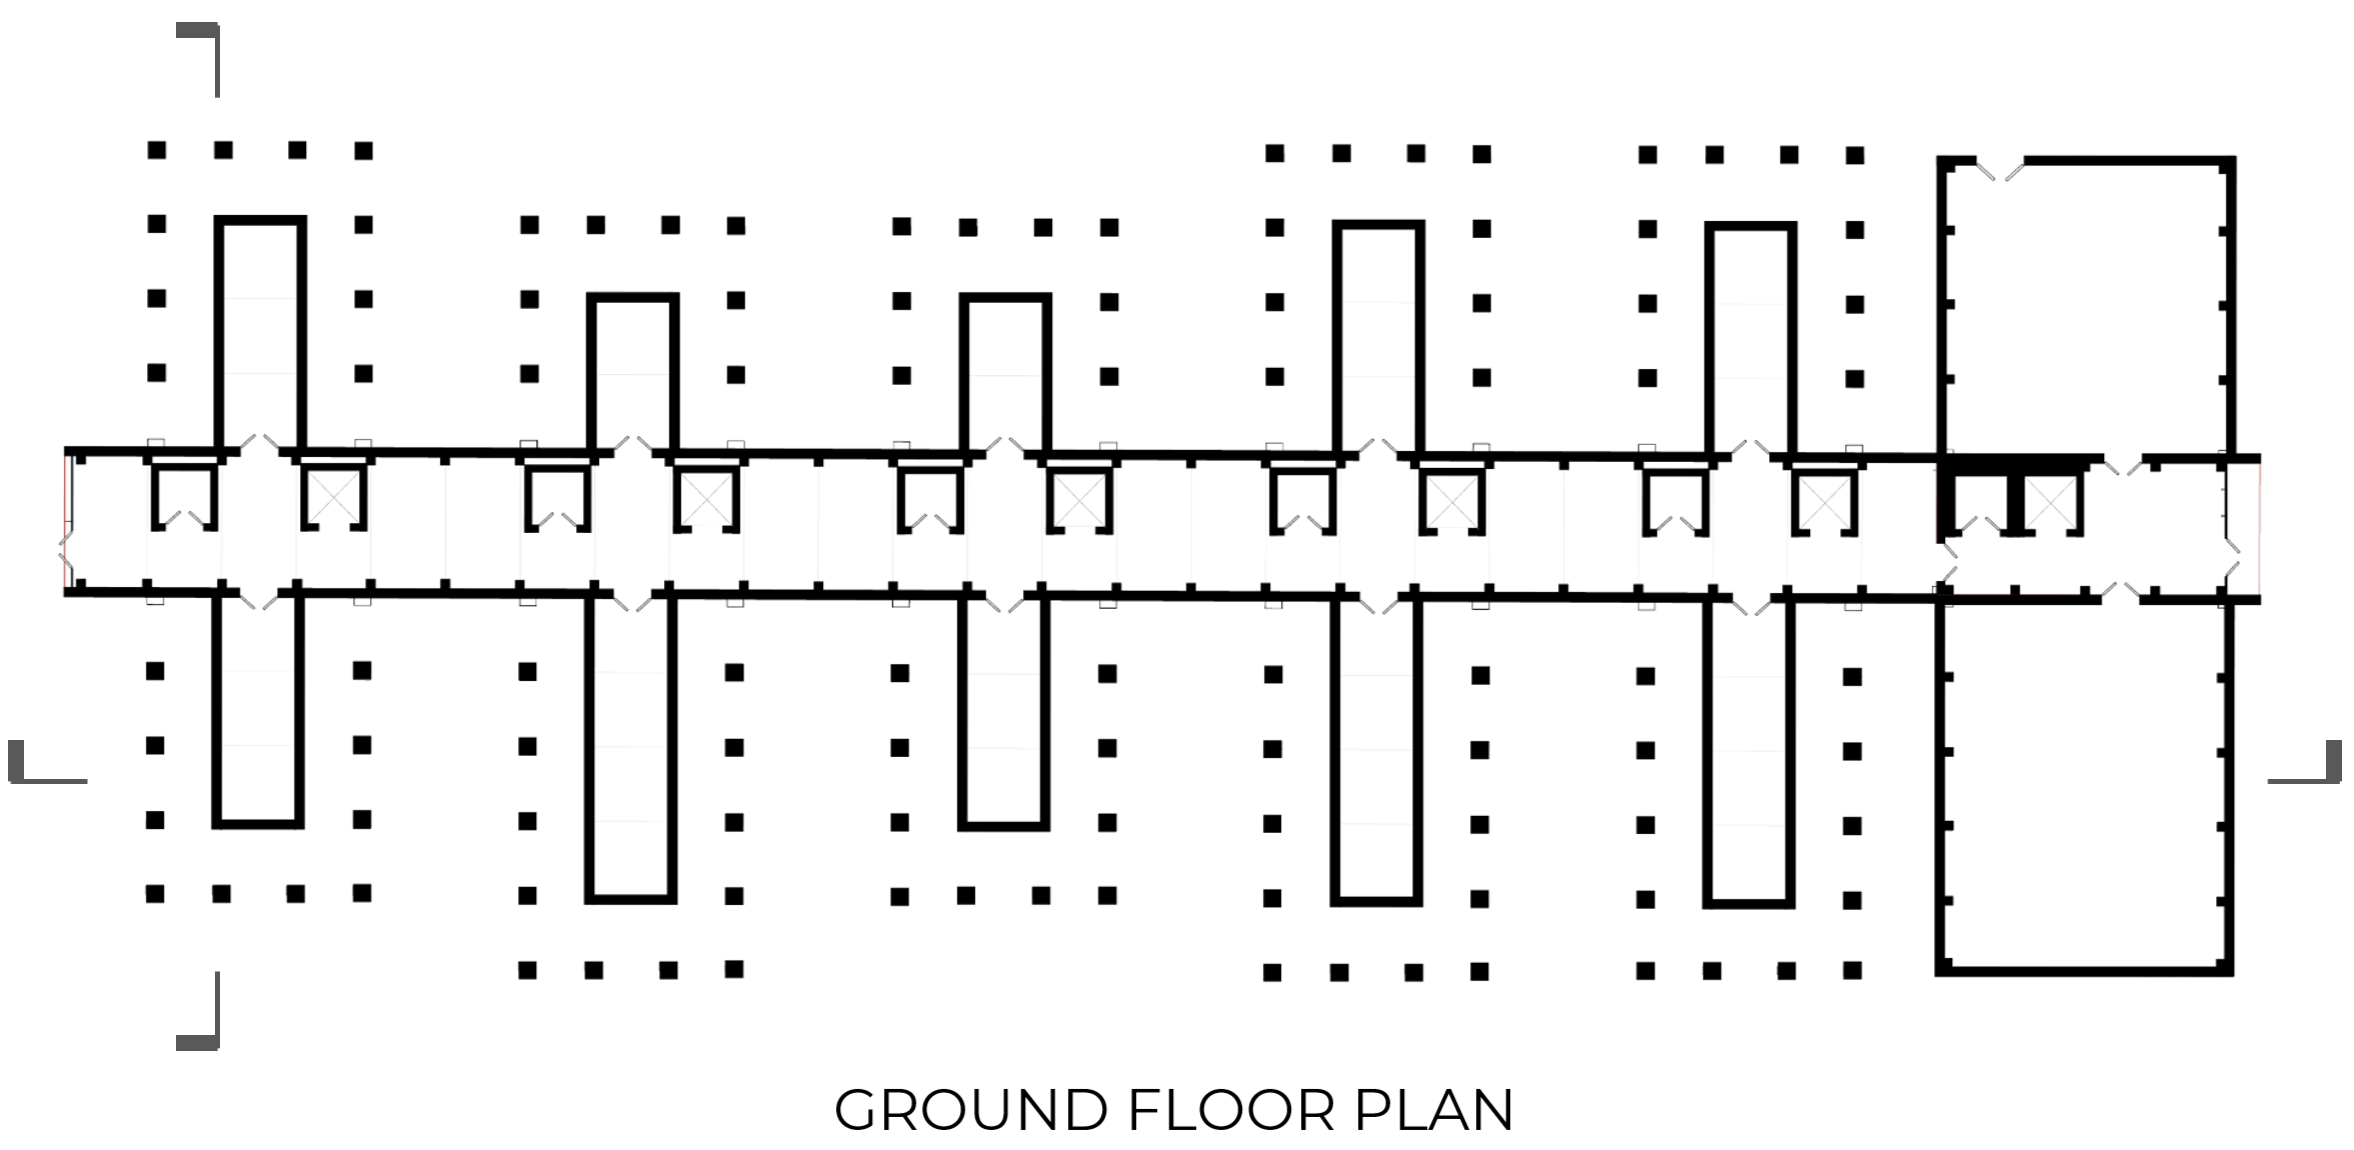
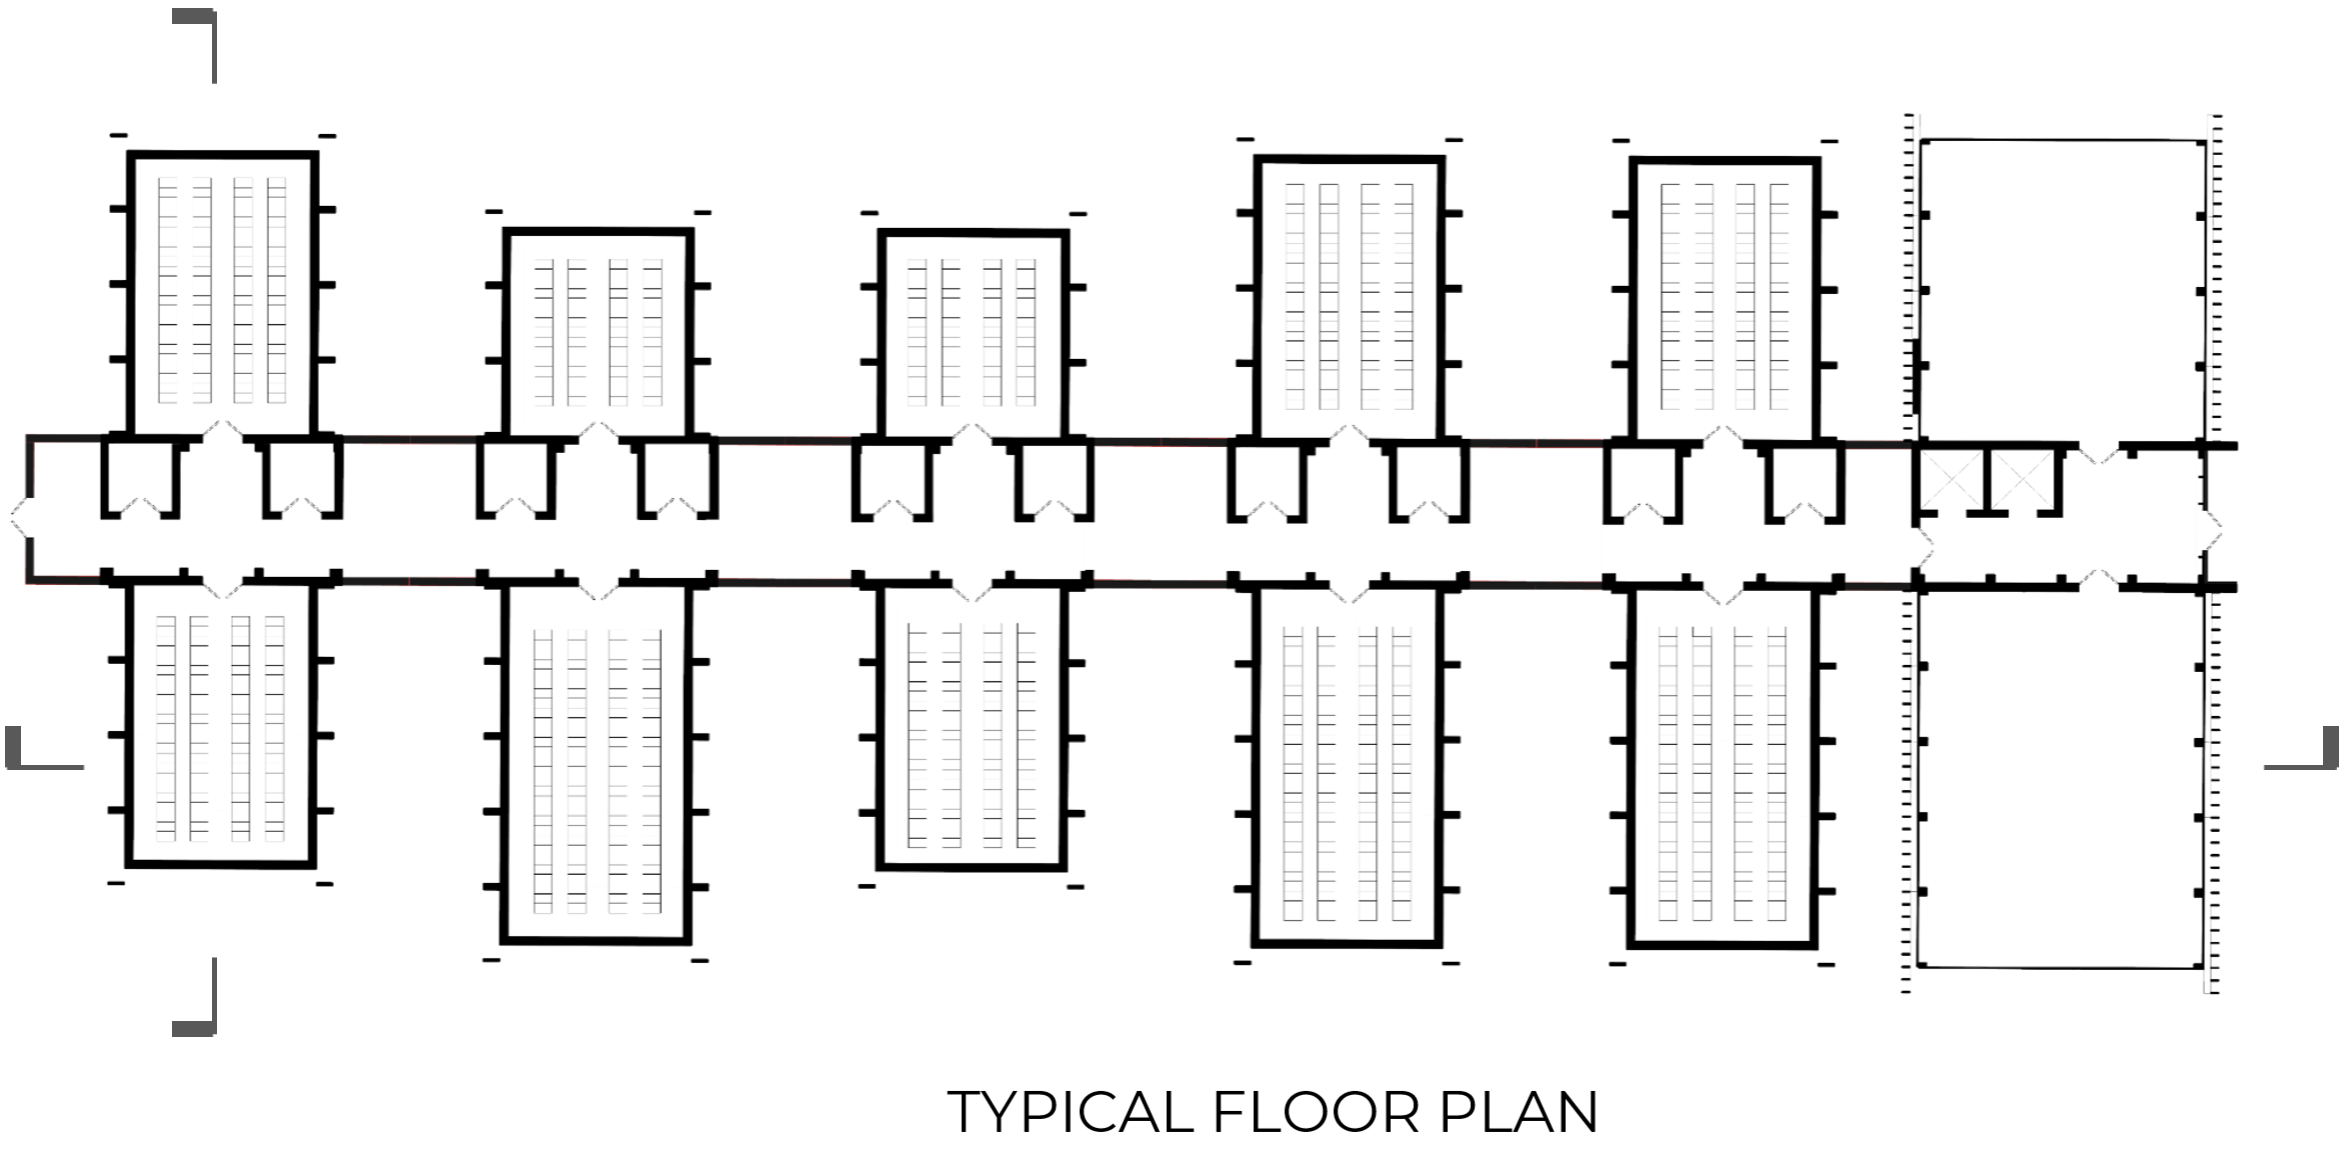
Considering a typical building aggregation, our ground plan follows our concept of a host core with program from which other programs can plug into and expand. At the ground, we have a structure working together with MEP and storage. Above, shown in a typical floor plan, we have our data halls and its necessary office and operations control.
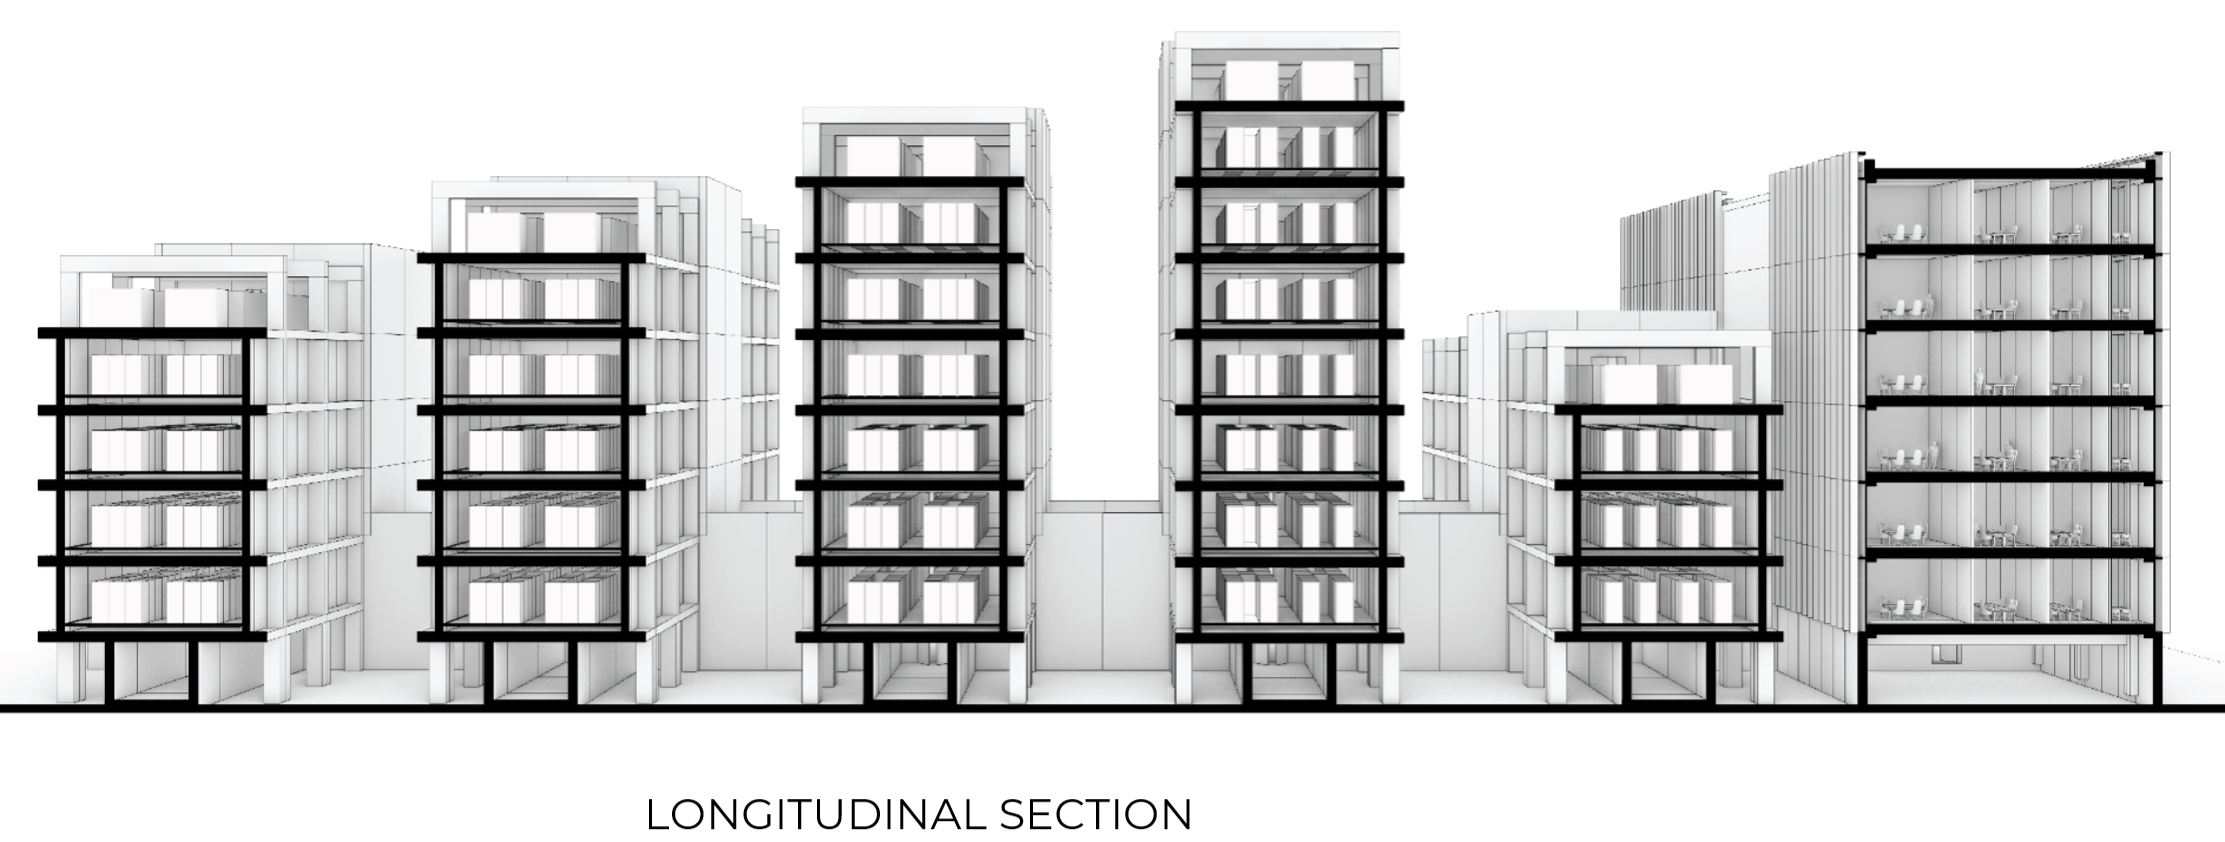
Our sections as well reflect this system with a supportive structure/program at the bottom, allowing for its vertical expansion.
