
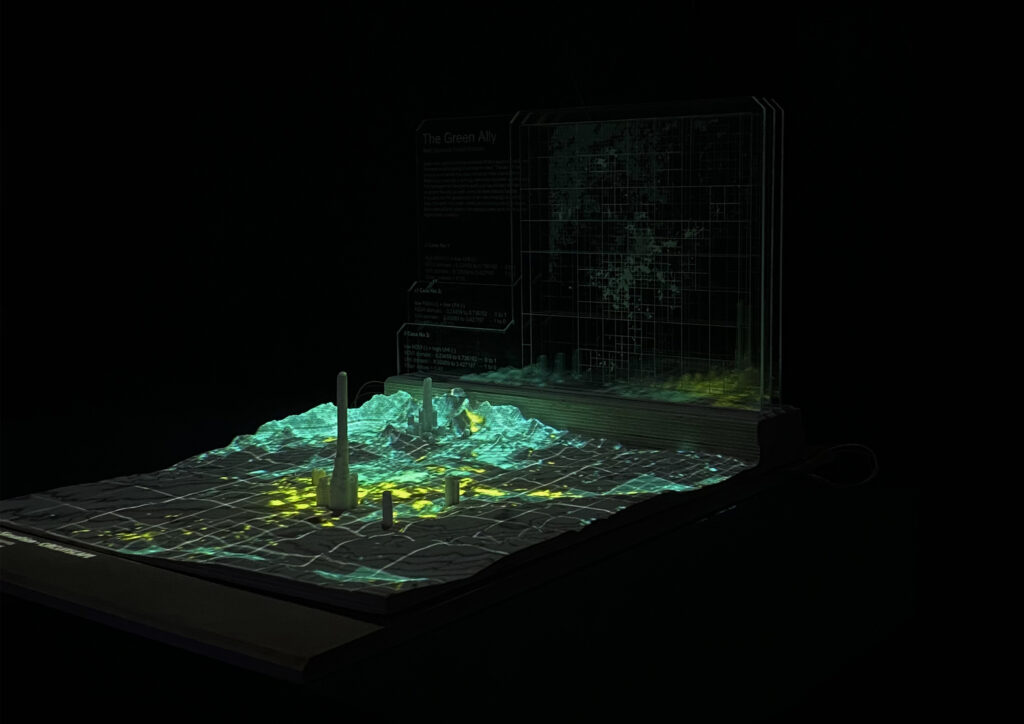
The “WILDLIFE PATHWAYS” is based on the “GREEN ALLY” project, that was developed at IAAC in the framework of the Master in City & Technology program, during the Internet of Cities Studio directed by Mathilde Marengo, Eduardo Rico, and Iacopo Neri. It provides a data informed approach that helps to integrate ecological needs within the design process and develop more precise design strategies to mitigate the impact of human activity on natural landscapes. “GREEN ALLY” is actually a digital tool that can make us rethink the territorial scale of Madrid from a more than human perspective.
– INTRODUCTION –
Over the last years, Spain experienced record-challenging heat waves, which have led to severe droughts and wildfires, causing immense landscape degradation and consequently contributing to habitat fragmentation and habitat loss, which decreases biodiversity and alter species ranges and interactions. Additionally, land transformation, due to the rapid pace of urbanization, has led to a significant change in localized urban microclimates, contributing to the emergence of the Urban Heat Island (UHI) effect and exacerbating the already burdened conditions in cities. Both humans and biodiversity are facing significant threats.
Red squirrels are native species in Madrid and the last years they have faced the threat of extinction. However, squirrels play a significant ecological role, especially in the forest ecosystems: while foraging for food, they gather seeds, bury them, and when they return to retrieve them, they are often unable to remember the location, therefore leaving them to flourish unintentionally having planted the seeds. Over time, this caching behaviour not only changes the composition of a forest but can also be fostered for ecological regeneration purposes.
– METHODOLODY –
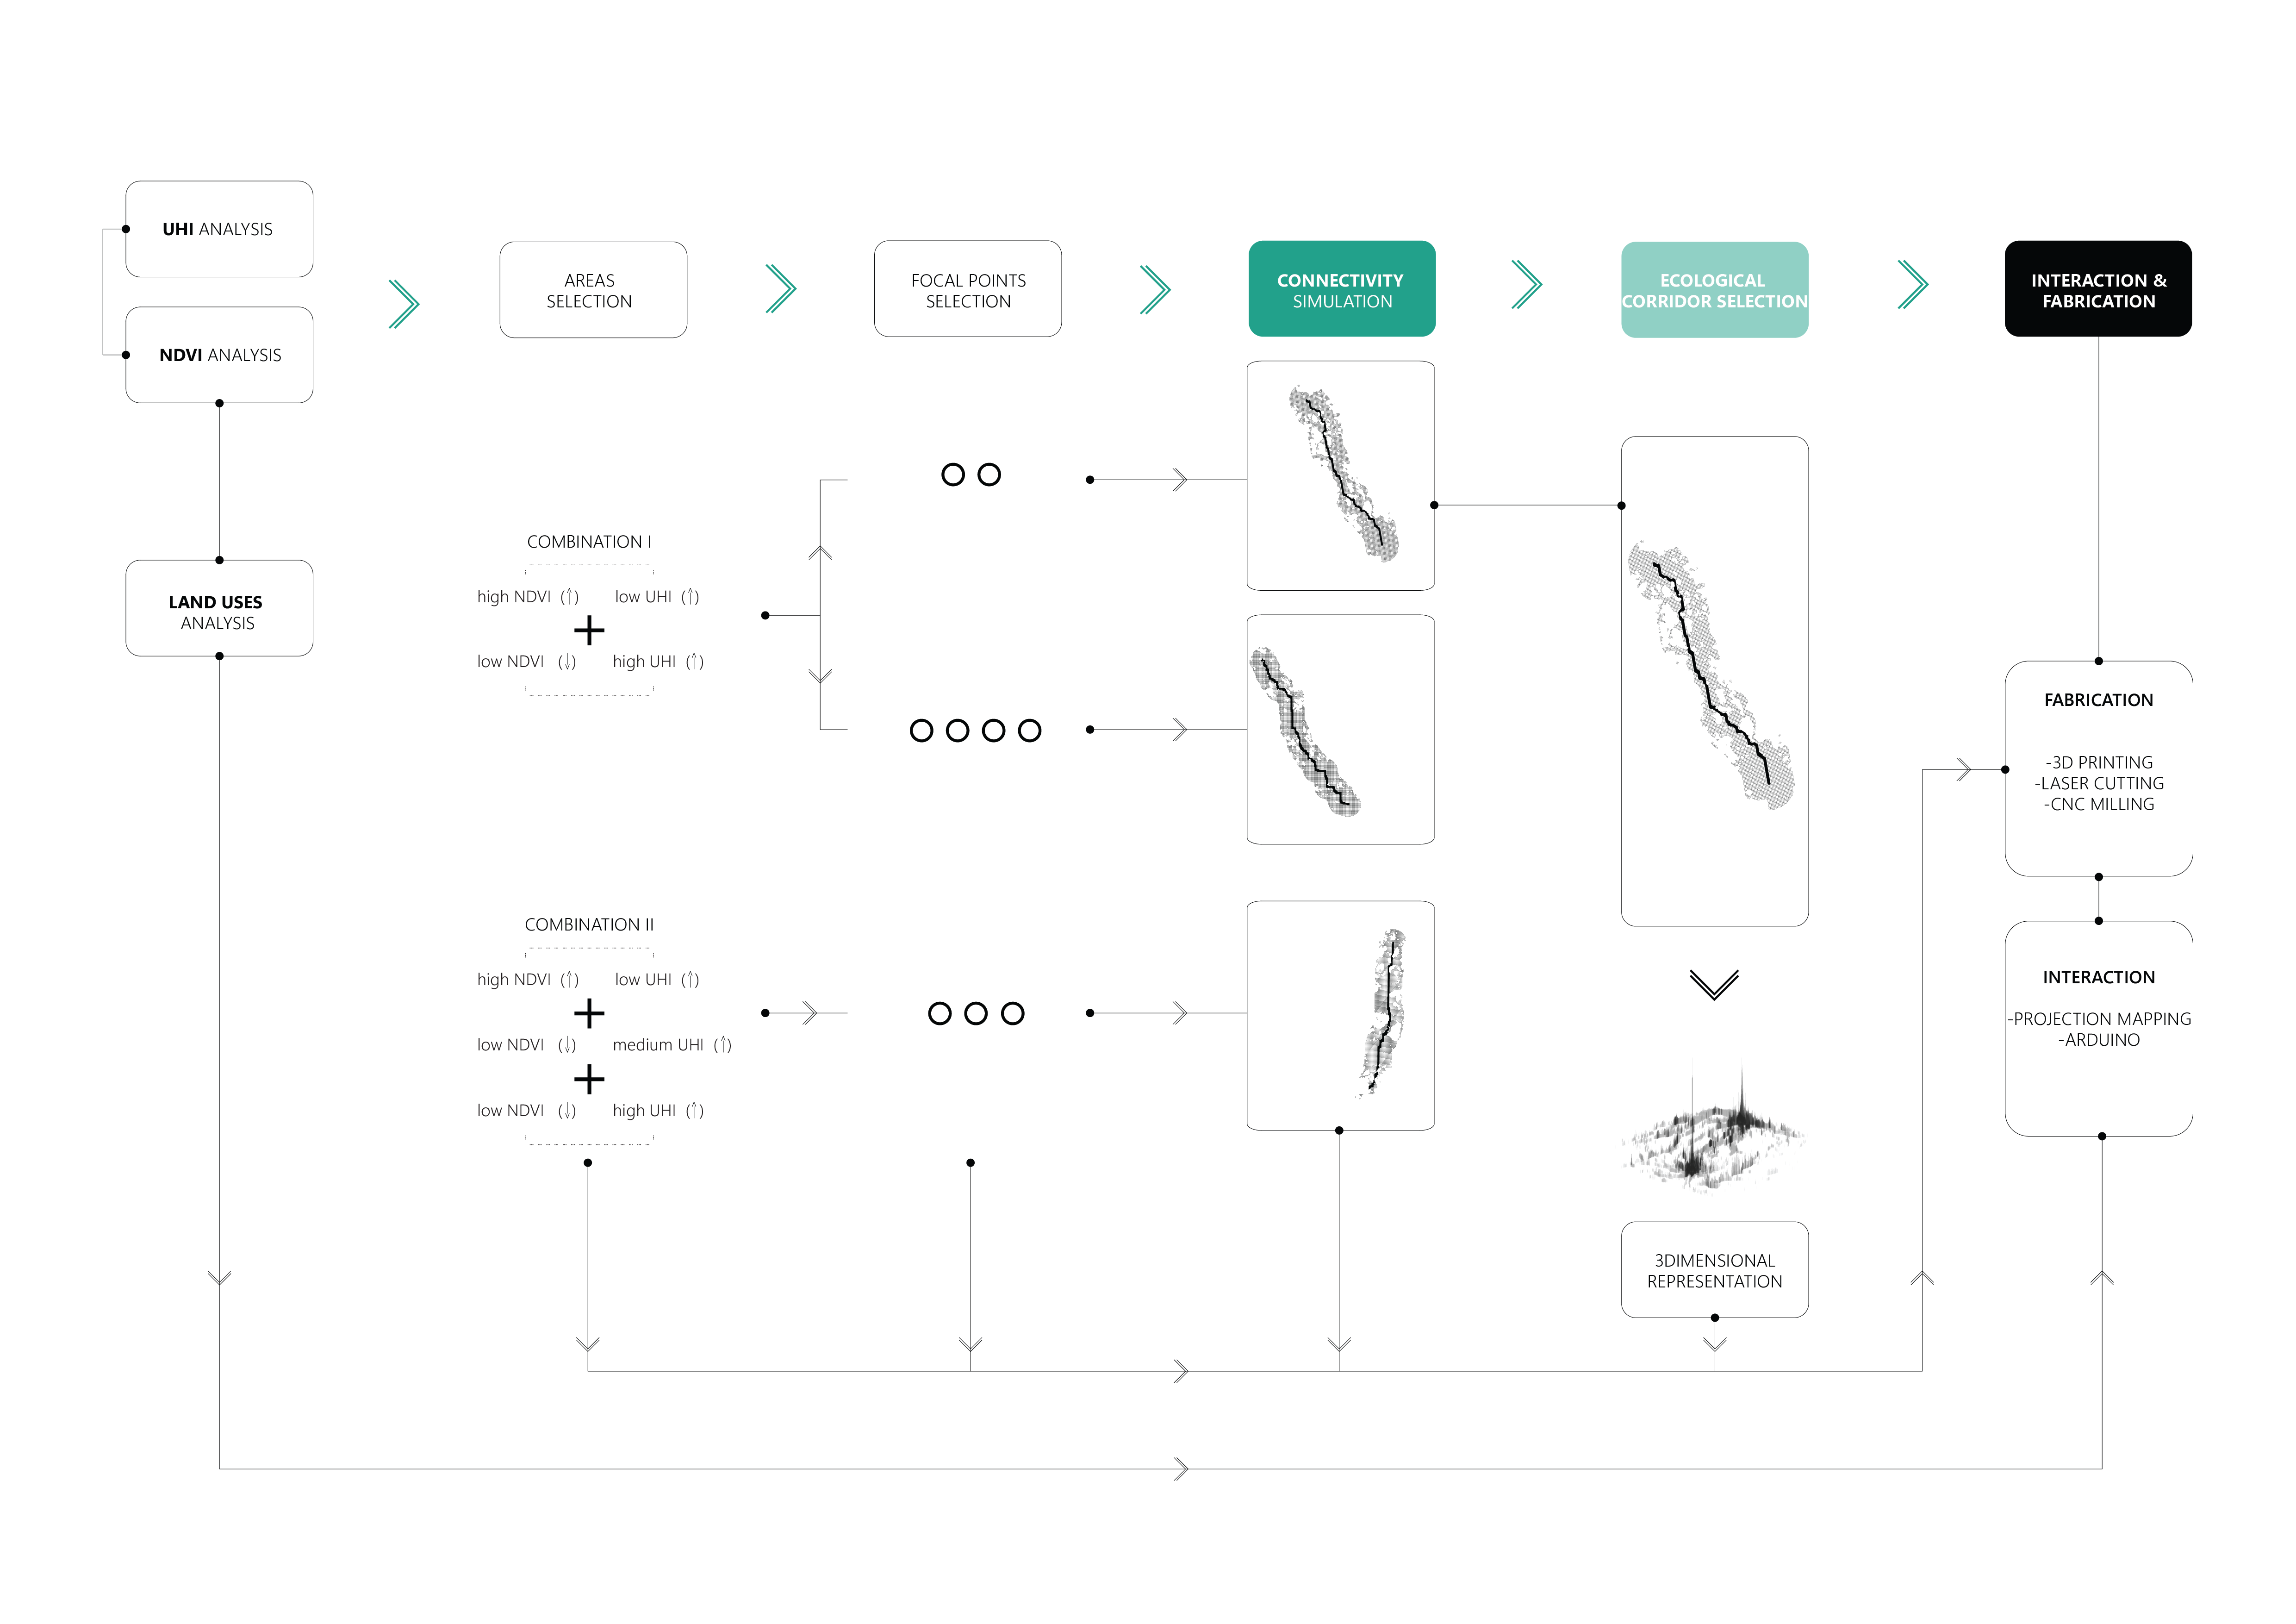
The methodological approach of the “WILDLIFE PATHWAYS” project can be divided into 6 main steps. The objective is to detect and identify ecological connectivity on the territorial scale of Madrid. The process begins with a comprehensive understanding of Madrid’s urban environment’s specificities by analyzing the UHI-NDVI along with land uses. It defines 3 case study areas and proceeds with two strategic steps: the selection of different combinations of identifying areas and the selection of the number and location of focal points. These parameters form the input for the 4th step, which involves connectivity simulation utilizing CIRCUITSCAPE between the focal points. Different resistance values are assigned to red squirrels. After identifying areas of higher connectivity, the most optimal one is selected based on specific criteria. This selection forms the final output, projected and represented in the model volumetrically, where the height indicates the level of connectivity.
– UHI / NDVI ANALYSIS –
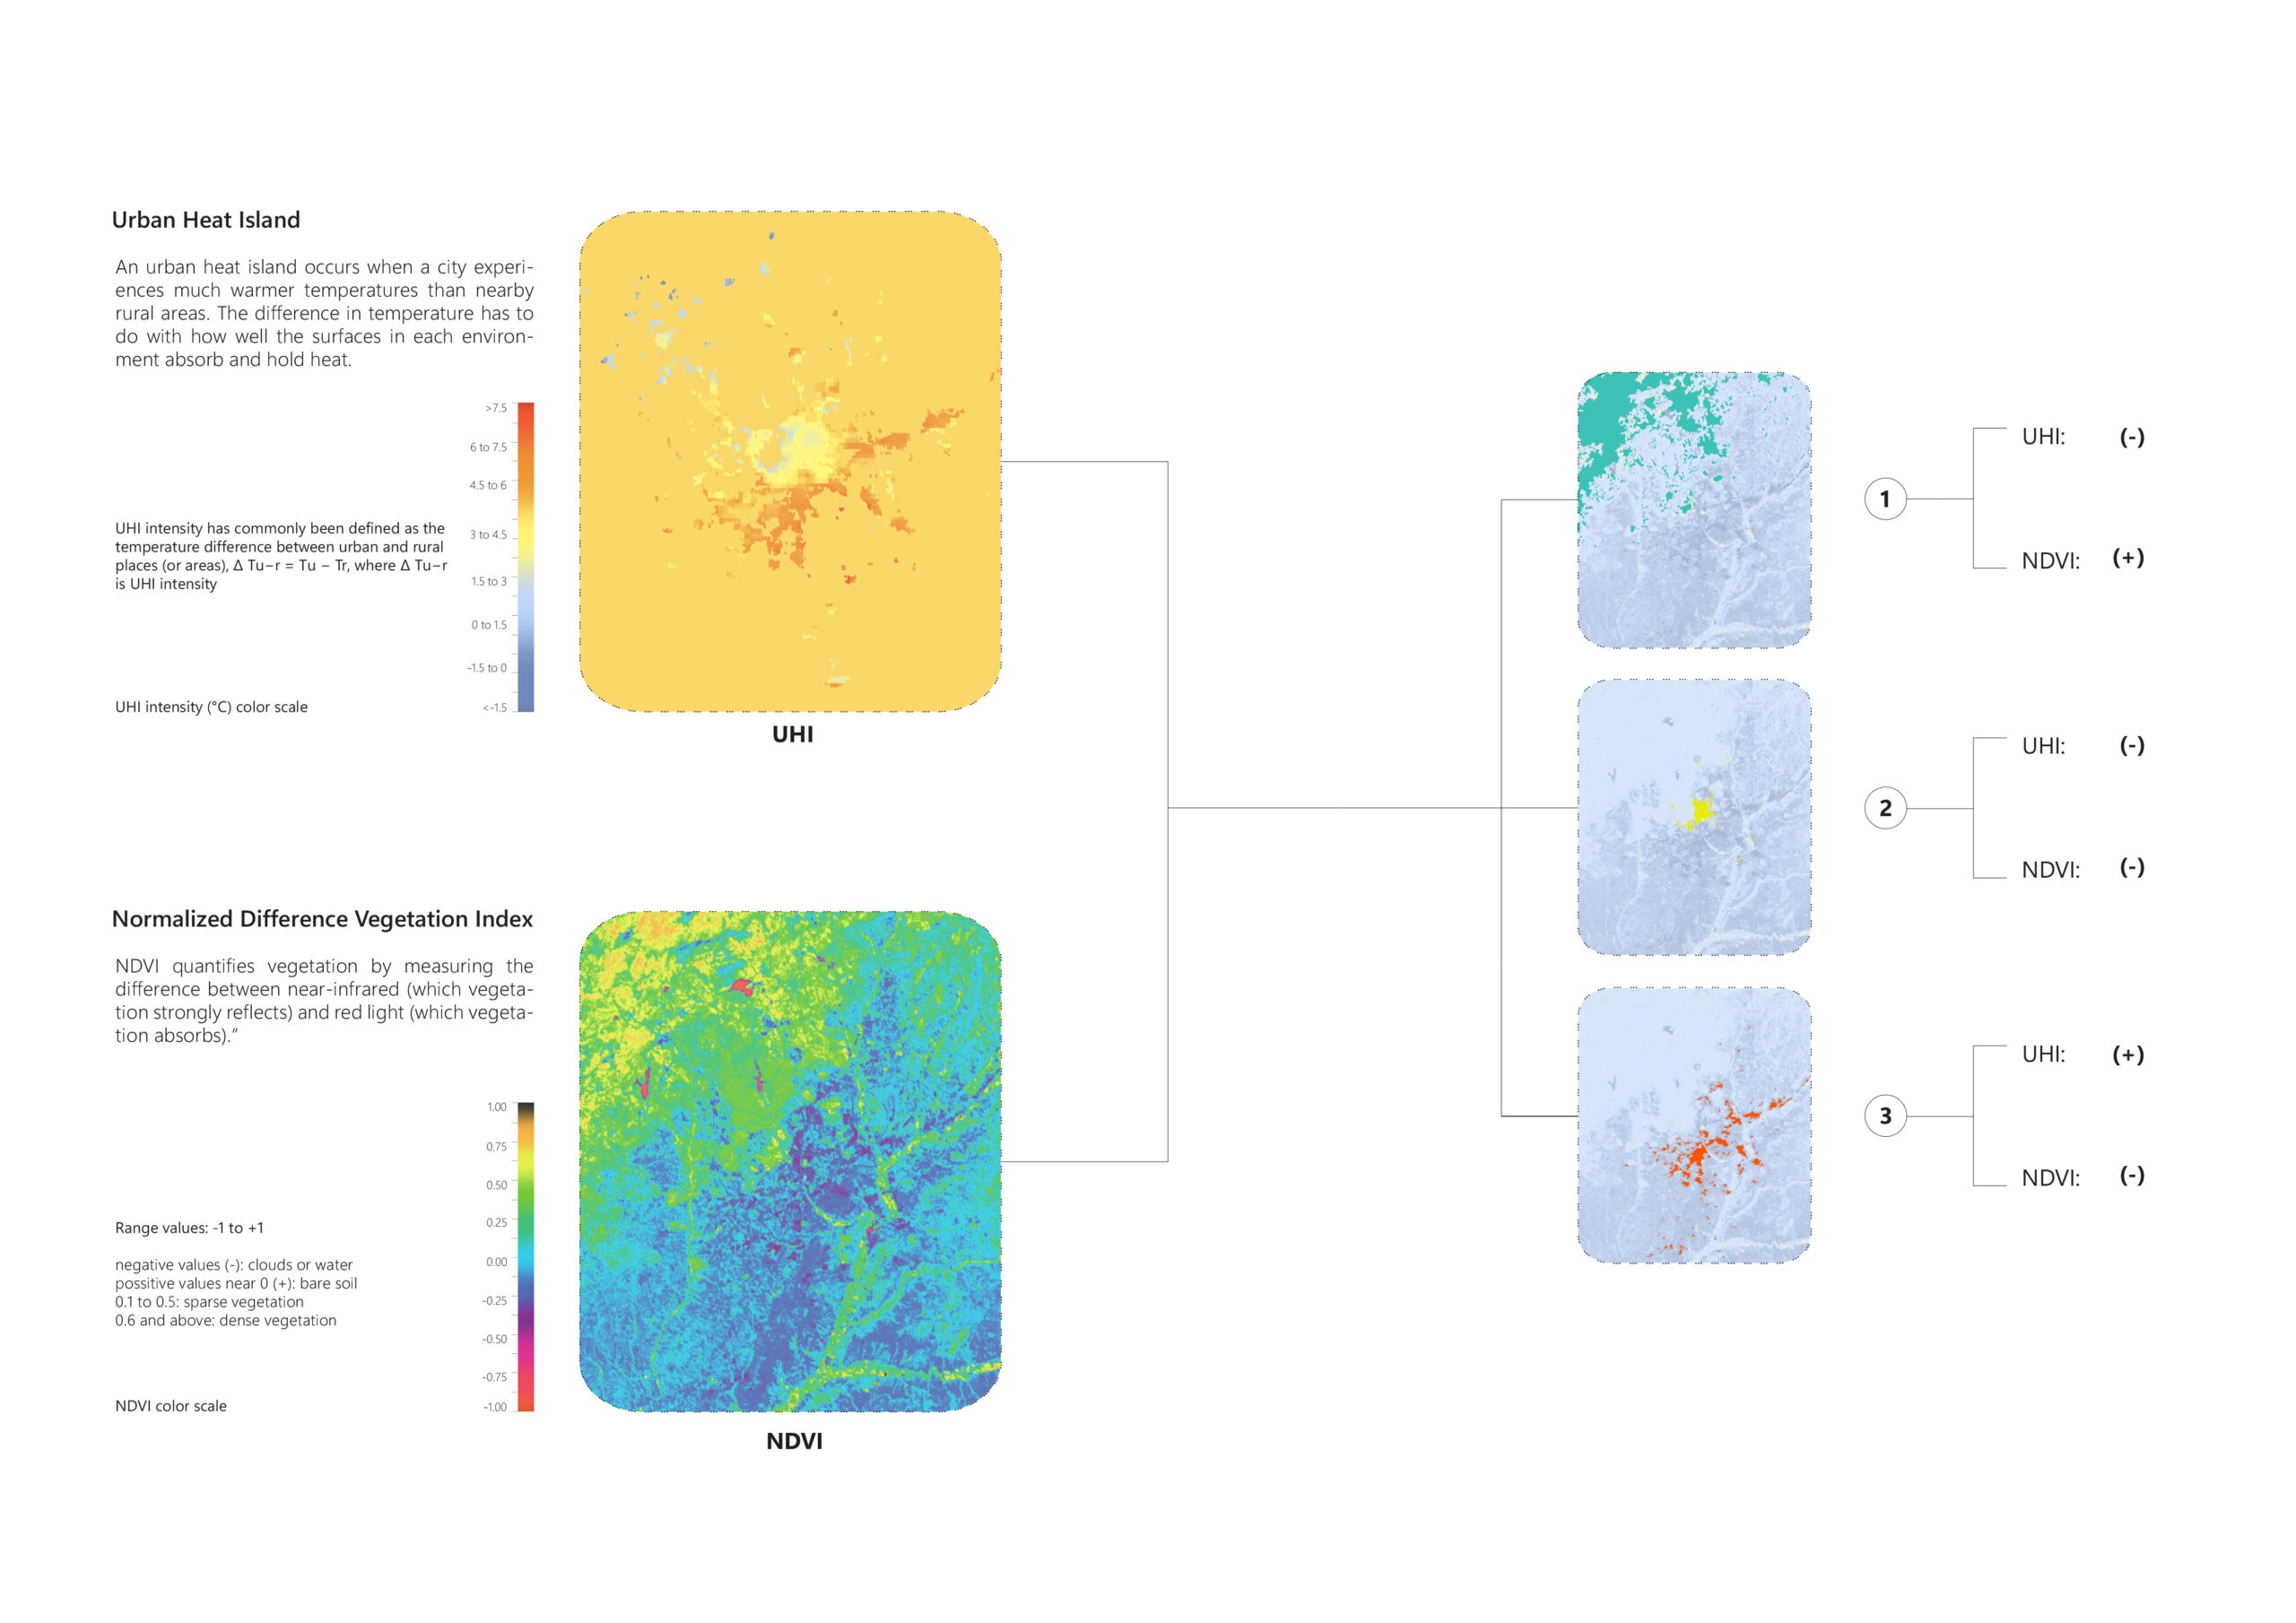
A data-driven analytical methodology was developed to test the applicability of the remote sensing geospatial datasets of GGE as a tool to explore the interrelationship between the presence of natural vegetation and Urban Heat Island effect. By comparing, combining and filtering the UHI and NDVI in GRASSHOPPER 3D, utilizing a new plug-in, a toolkit that allow as to import, spatialize, process and calculate geospatial raster layers through EARTH ENGINE API PYTHON library and via HOPS, the urban specificities of Madrid were discerned.
A decreasing temperature gradient was shown as we move from the dense vegetation cover in the north, through the city center with fragmented green spaces, and finally to the quasi-barren peripheral area in the south. Indeed, three areas of incremental risk can be defined. The best-case scenario in the northwest of the city partly surrounded by forest patches; followed by the route of action, the densely populated city center of Madrid in which the dense tree canopy in the streets substantially minimizes the urban temperature; and finally the area of concern in the southeast of the city, that experiences the highest temperatures due to the combination of a dense urban fabric, with fragmented green spaces and underutilized or degraded land. The correlation between the severity of disconnect between green spaces and the temperature gradient unveiled the importance of defragmentation to mitigate the UHI effect.
– CONNECTIVITY ANALYSIS –
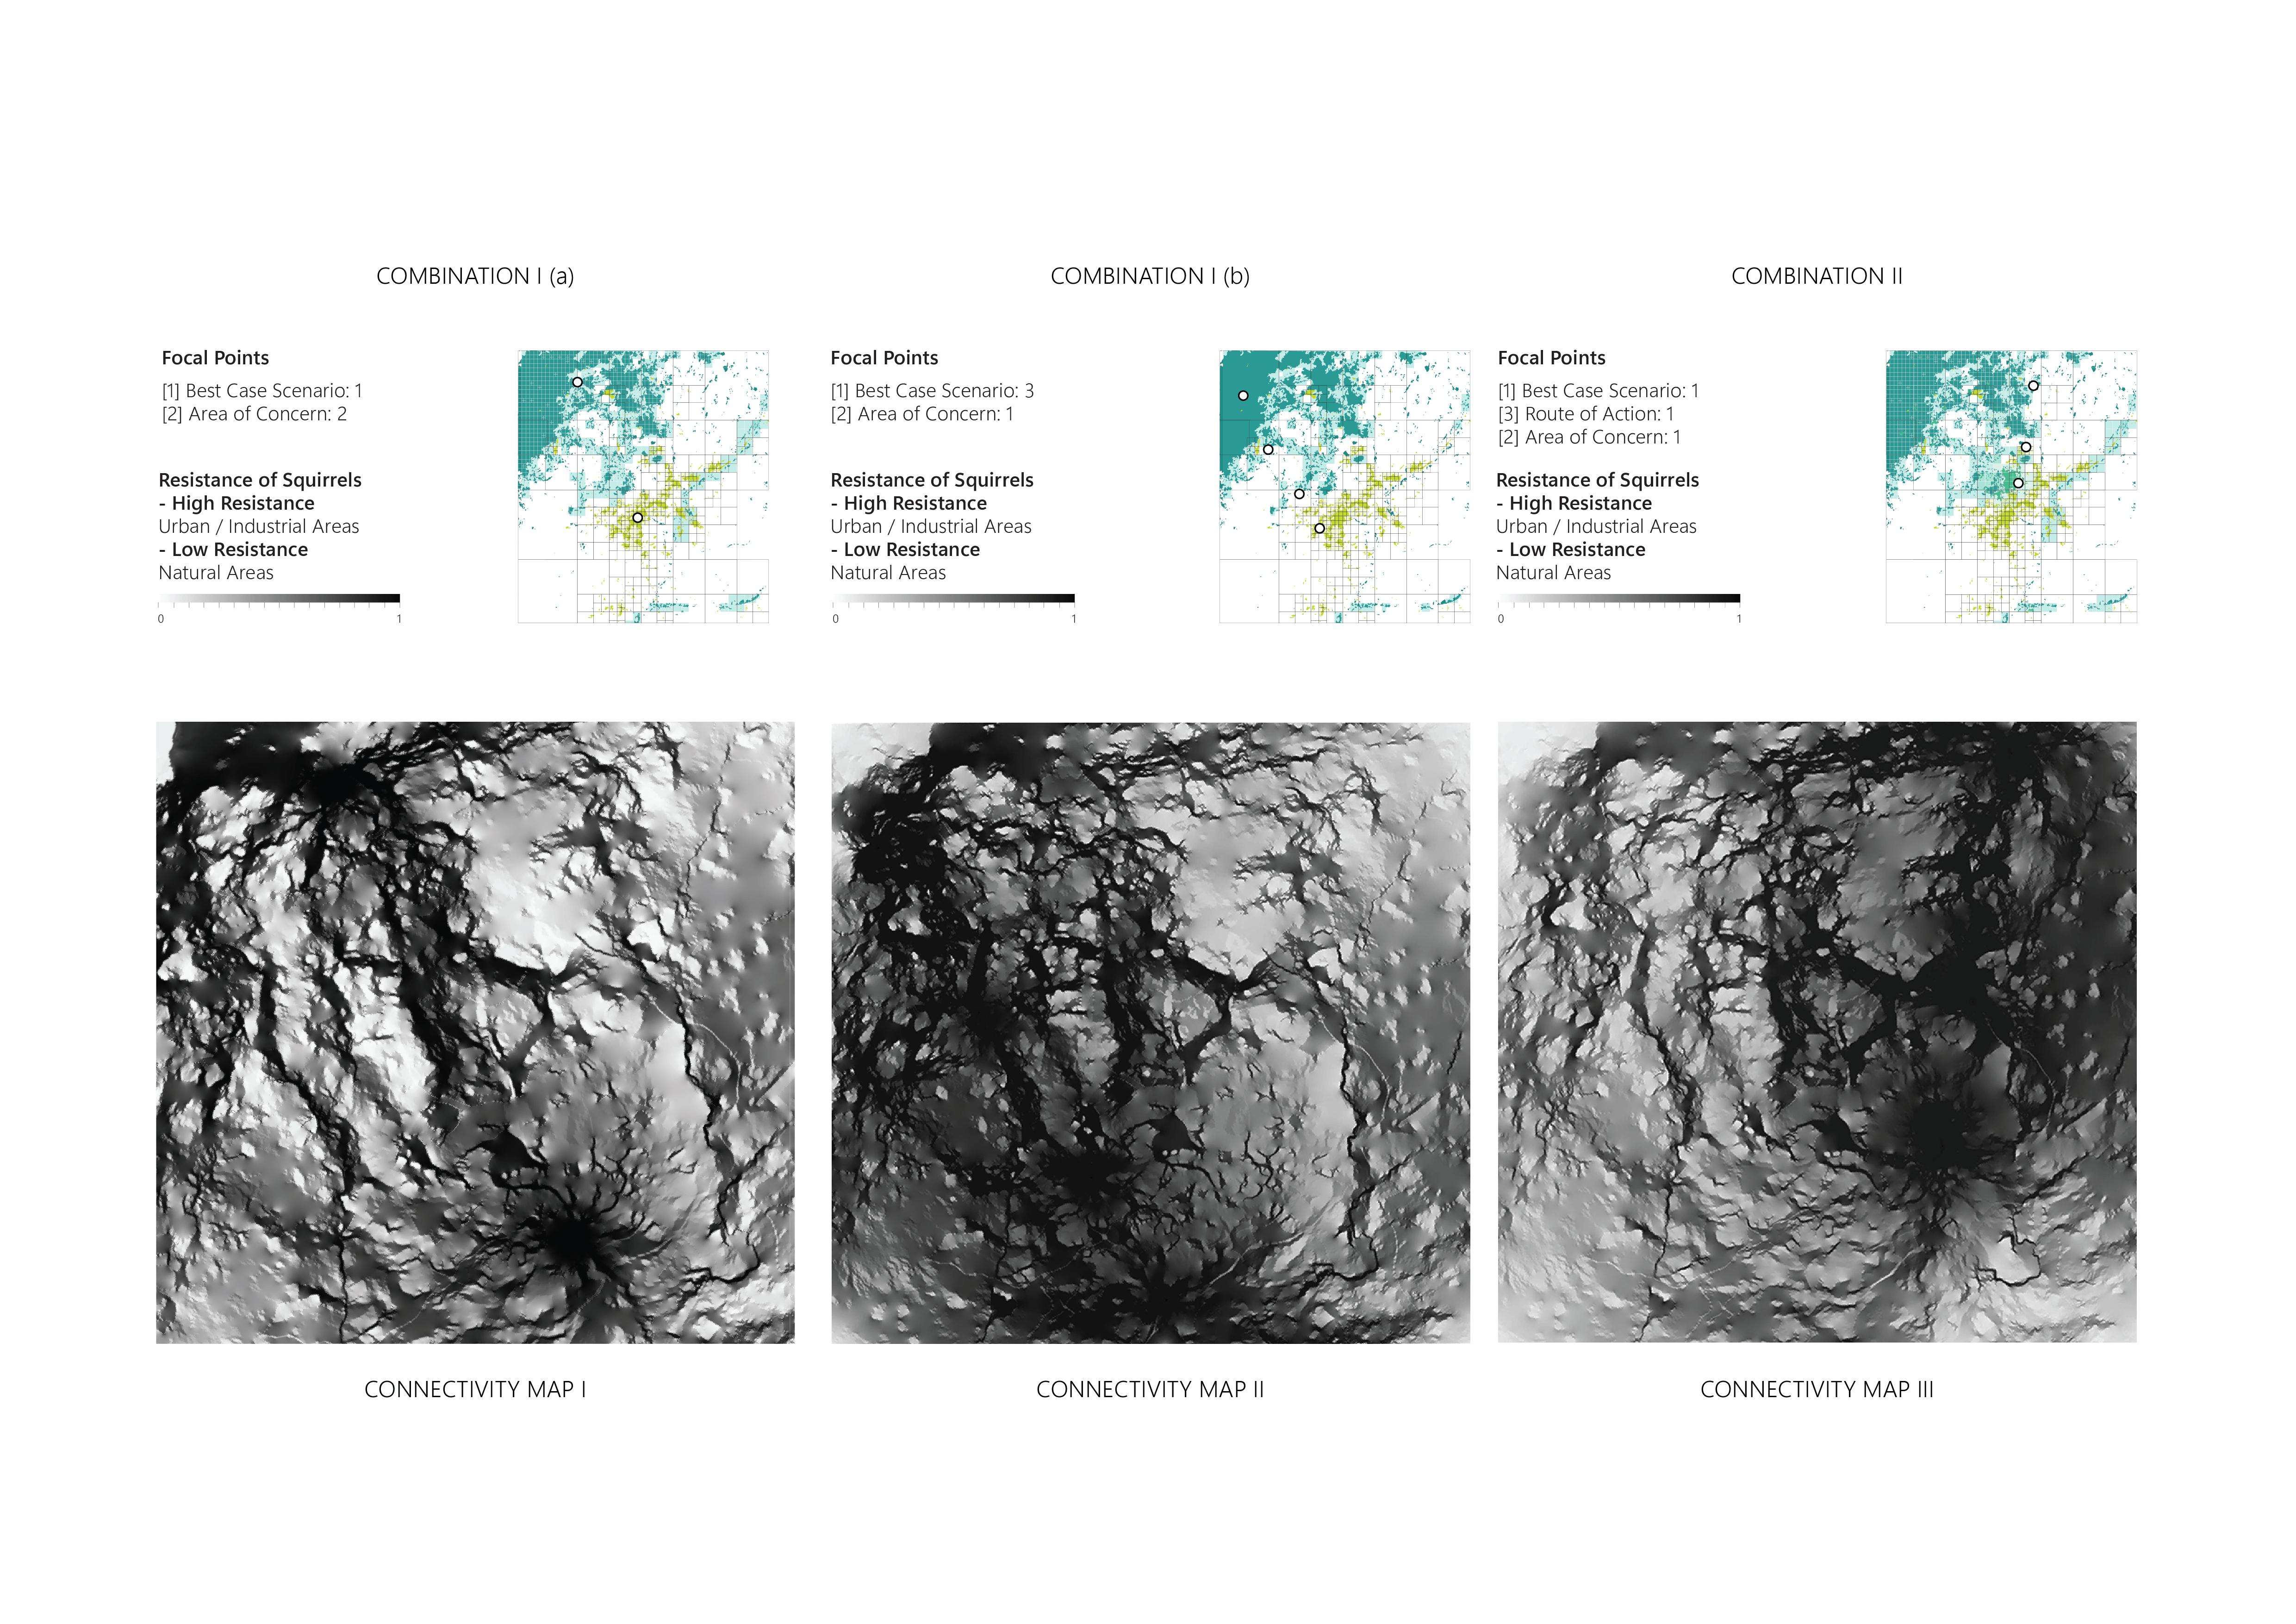
The study culminates in the synergy between red squirrels and humans fostered by an ecological corridor that connects the green nodes in the city, and activates the previously identified underutilized spaces. In order to identify the area of intervention the Circuitscape software was employed and a connectivity analysis was run by assigning different resistance values for the red squirrels to each land use of the Corine Land Cover 2018 GeoTiff in QGIS. Three connectivity simulations were performed. In the first combination (I), the two focal points derived within the best-case scenario and the area of concern were selected. Transitioning to the second combination (II), the same strategy for selecting case areas was retained, but the number of points was adjusted to four, with three in the best-case scenario and one in the area of concern. Finally, in the last combination (III), the connectivity simulation traversed through all three cases, with a focal point chosen within each. The objective is to identify the squirrels’ movement, defining the connectivity intensities between the areas and generating the new ecological map in each case.
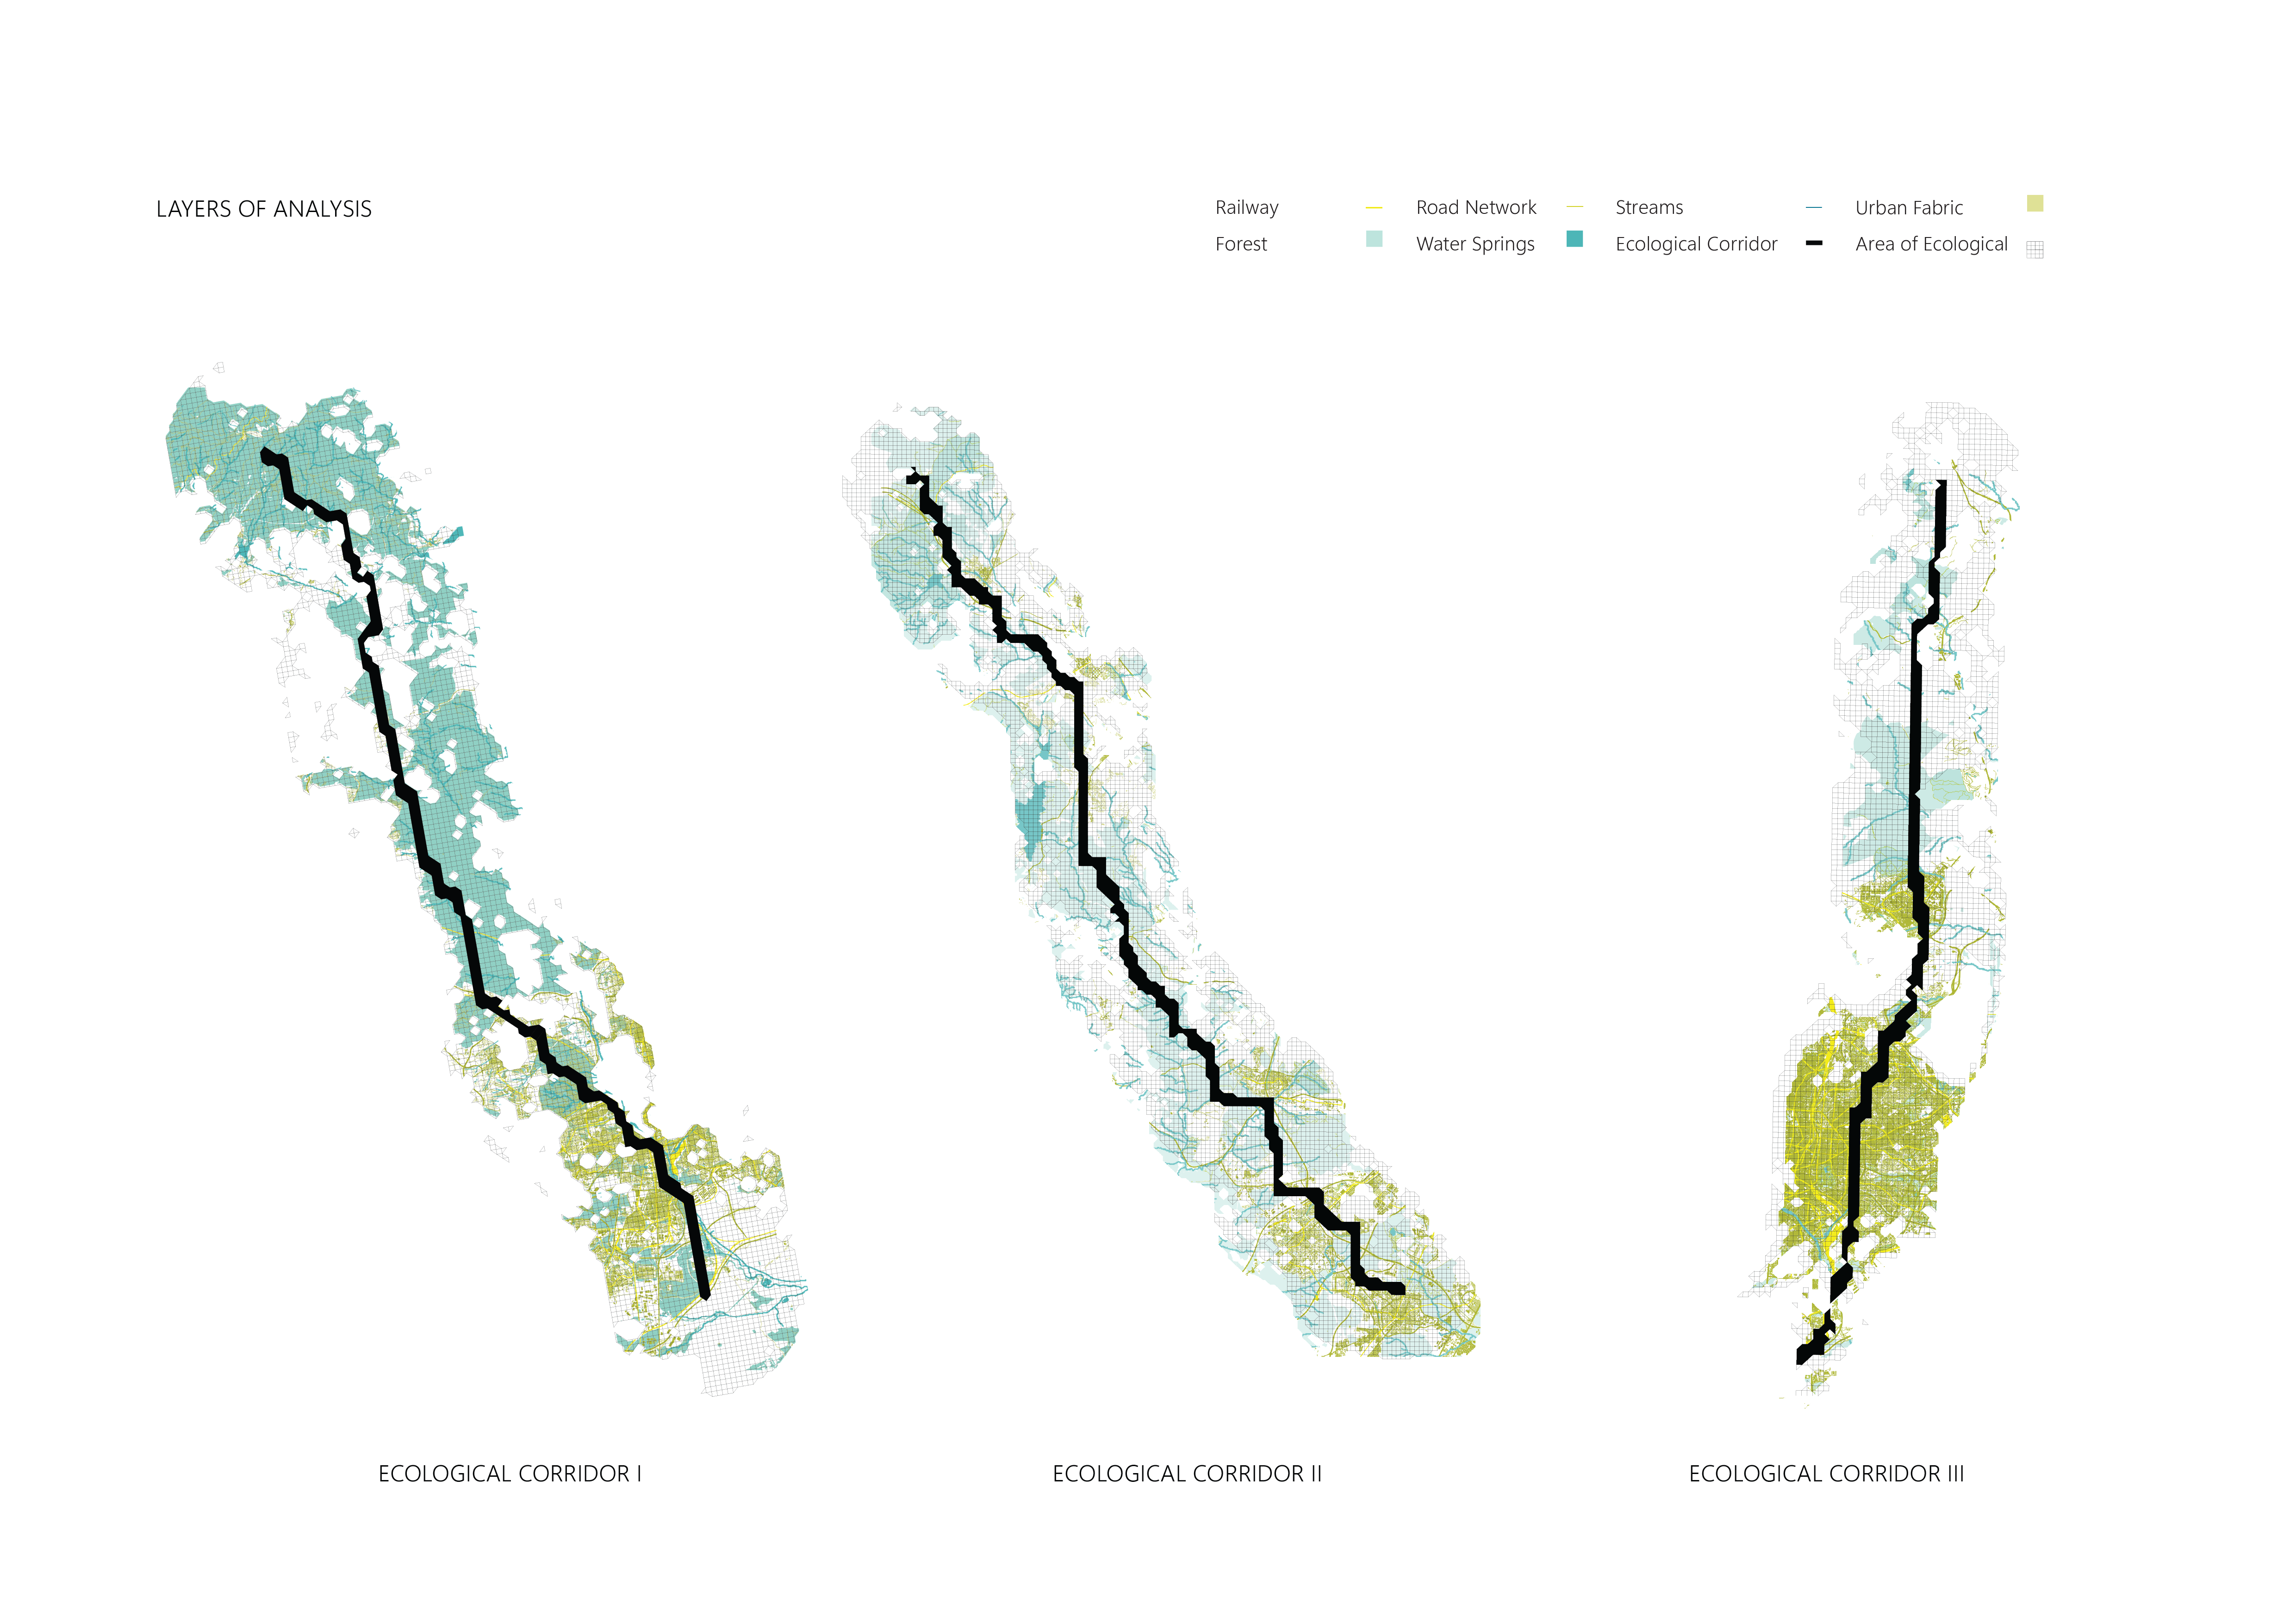
By filtering and overlaying it with other spatial layers, we can observe that:
- In the first scenario (Combination I), the ecological corridor connects forest patches with a vast, underutilized area near the city center, with the potential to convert this area into a new urban forest.
- In the second scenario (Combination II), the ecological corridor is generated around the densely populated area of Madrid, revitalizing and regenerating forest patches while also reconnecting green spaces outside the city.
- In the third scenario (Combination III), the ecological corridor, originating from forest patches, predominantly traverses urbanized areas. This process defragments the green spaces, presenting the possibility of establishing a low vegetation network of parks.
Based on our analysis, we have chosen the first ecological connectivity output as the most efficient result of the simulation. This output creates a seamless transition between the forest and urban areas, offering various regeneration possibilities. These range from forming a new urban forest to connecting urban parks and integrating green areas more effectively, scaling from a territorial to an urban context in Madrid.
– FABRICATION & INTERACTION –
In the section on fabrication and interaction, there are five parallel steps and techniques.
// CNC Milling for Surface Manufacturing:
- Technique: Using CNC milling to carve out a terrain model from plywood and MDF.
- Material: Terrain – 24mm Plywood x 2 (layers), Base – 15mm MDF.
- Machine: ShopBot.
- Software: RhinoCam.
- Mill Bits: Roughing – 6mm, Finishing – 8mm, Cutting – 4mm & 6mm.
- Dimensions: Specifics are based on the desired scale; typically, the size of the plywood and MDF would dictate the overall size of the milled piece.
- Description: CNC milling carves the design from two layers of 24mm plywood and a 15mm MDF base. A ShopBot machine, with RhinoCam software, follows digital instructions to cut the wood with varying mill bits for roughing, finishing, and cutting, creating detailed terrain of Madrid.
// 3D Printing for Additive Manufacturing:
- Technique: Additive manufacturing through 3D printing to create complex geometries.
- Material: AMX Transparent Acrylic Sheet, 4mm.
- Machine: Anycubic Kossel Linear Plus.
- Software: Z-Suite, Cura for slicing.
- Settings: Nozzle of 0.4mm diameter, 200mm diameter, 290mm print volume, with specific infill settings.
- Dimensions: The print volume is limited to a diameter of 200mm and a height of 290mm.
- Description:3D printing adds material layer by layer to create a form from a pvc based material. The Anycubic Kossel Linear Plus printer uses a 0.4mm nozzle to extrude material within a 200mm diameter by 290mm high print volume, precisely controlled by Z-Suite and Cura software. This technique allowed us to visualize the highly connected spaces to create an ecological corridor
// Laser Cutting:
- Technique: Employing a laser cutter to shape and detail acrylic sheets.
- Material: 4mm Transparent Acrylic Sheet.
- Machine: 600mm*900mm Epilog laser with 50W power.
- Software: RhinoCam.
- Settings: Engraving at 15% power and 60% speed, marking at 10% power and 50% speed, cutting at 85% power and 10% speed.
- Dimensions: The bed size for cutting is 600mm*900mm.
- Description: Laser cutting is a precise method of cutting a design from a 4mm transparent acrylic sheet. The process utilizes a 600mm by 900mm 50W Epilog laser cutter, governed by RhinoCam software. The laser’s settings vary for engraving, marking, and cutting, with adjustments in power and speed to change the effect on the material. This allows us to visualize different cases in point and highlight the area analyzed.
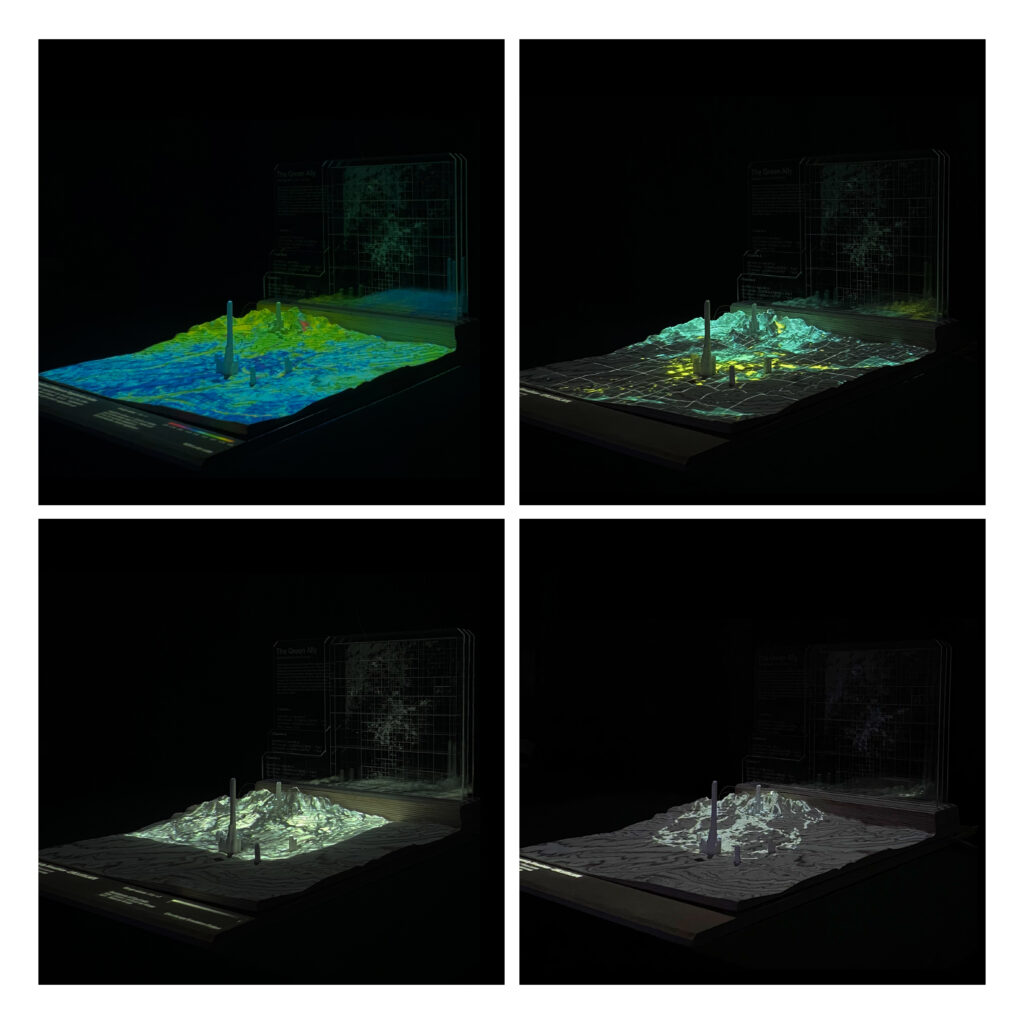
// Projection Mapping:
- Technique: Utilizing projection mapping to overlay imagery onto physical surfaces.
- Device: Panasonic Projector.
- Software: Resolume Arena.
- Description: Projection mapping projects images onto physical surfaces, transforming them with light. Using a Panasonic projector and Resolume Arena software, this technique can create illusions of texture and depth on the modeled surface, enhancing the visual appeal of the terrain and explain the layers in detail to its corresponding areas.
// Connections:
- Technique: Using LED strip lights and an Arduino board to create interactive components.
- Material: 6mm LED strip light, Arduino Board.
- Description: Using a 6mm LED strip light paired with an Arduino board, connections are established to bring interactivity to the design. The Arduino board acts as the brain, allowing for programmability and control of the LED lights, which can be used to highlight features or in sync with the projections show.
– VIDEOMAPPING –
