
Building Agricultural Abundance on Mars
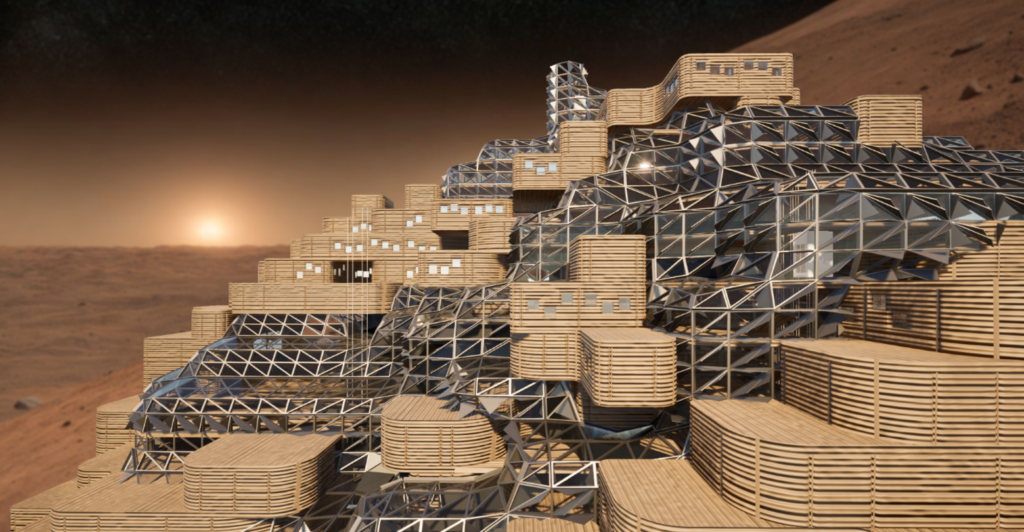
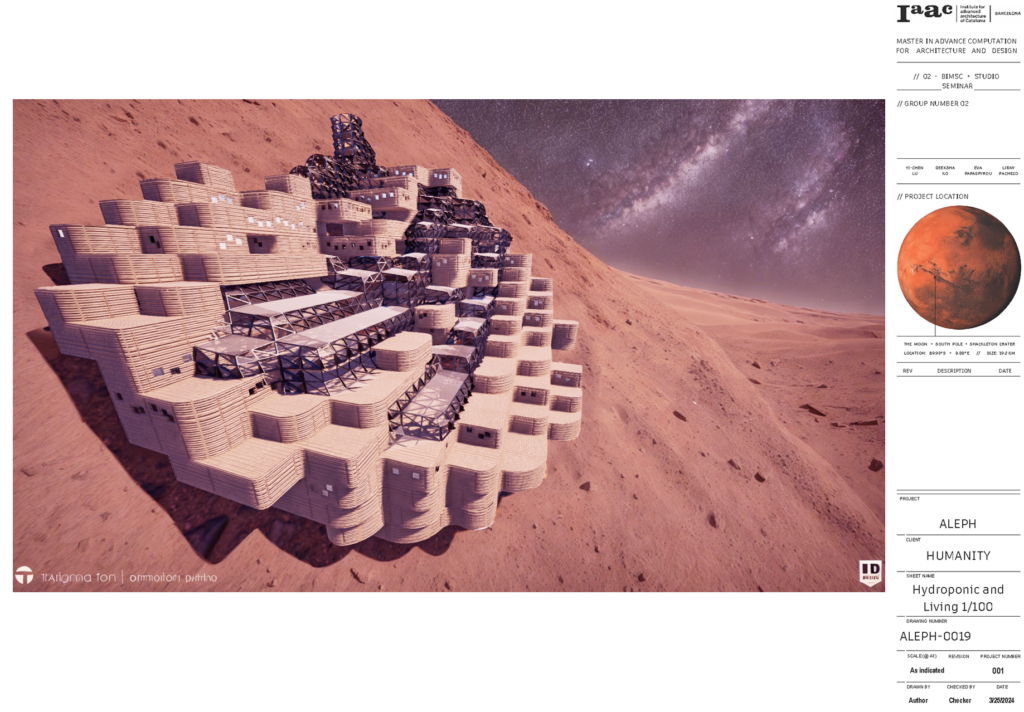
The Mars underground sanctuary residential complex envelops vertical farming beneath its protective skin and 3D-printed wall system, where sunlight delicately filters through, embracing the celestial surroundings and meticulously crafting a breathtaking habitat on the Martian surface.
01_design concept & reference
The initial endeavor aimed to pioneer the voxel settlement concept, delineating areas for our program and conducting sun analysis. Additionally, a void was integrated to accommodate protected public spaces.
In comparing scale, the Biosphere project was developed for 8 people, with a per-person occupancy area of 1317 sqm and a corresponding vegetation area of 8400 sqm. In contrast, our project, Cultivated Cosmos, is designed for 50 people, with a vegetation area totaling 65800 sqm.
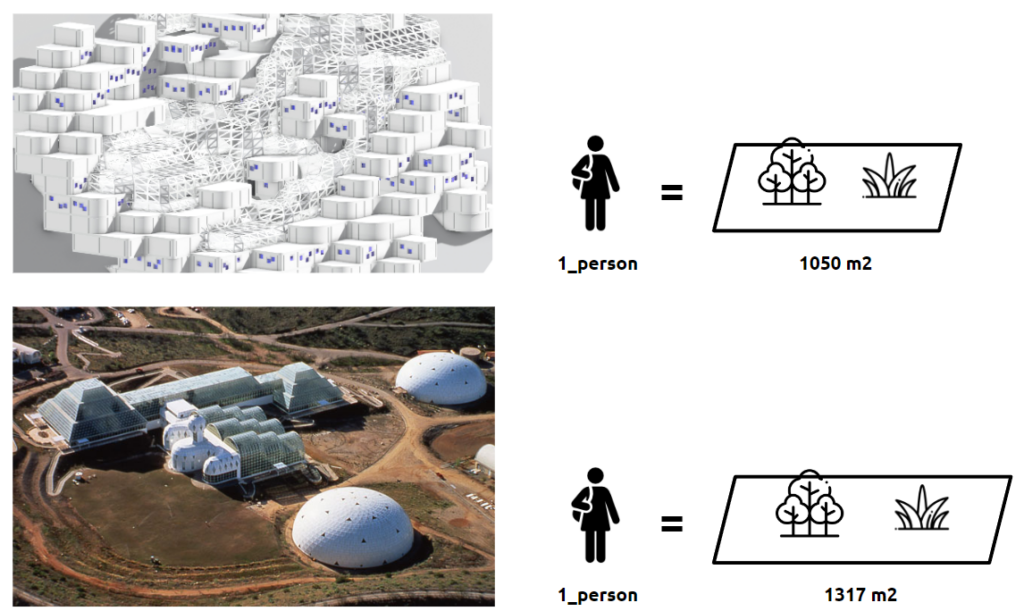
bottom: biosphere_2: people: 8, vegetation_area: 8400 m2
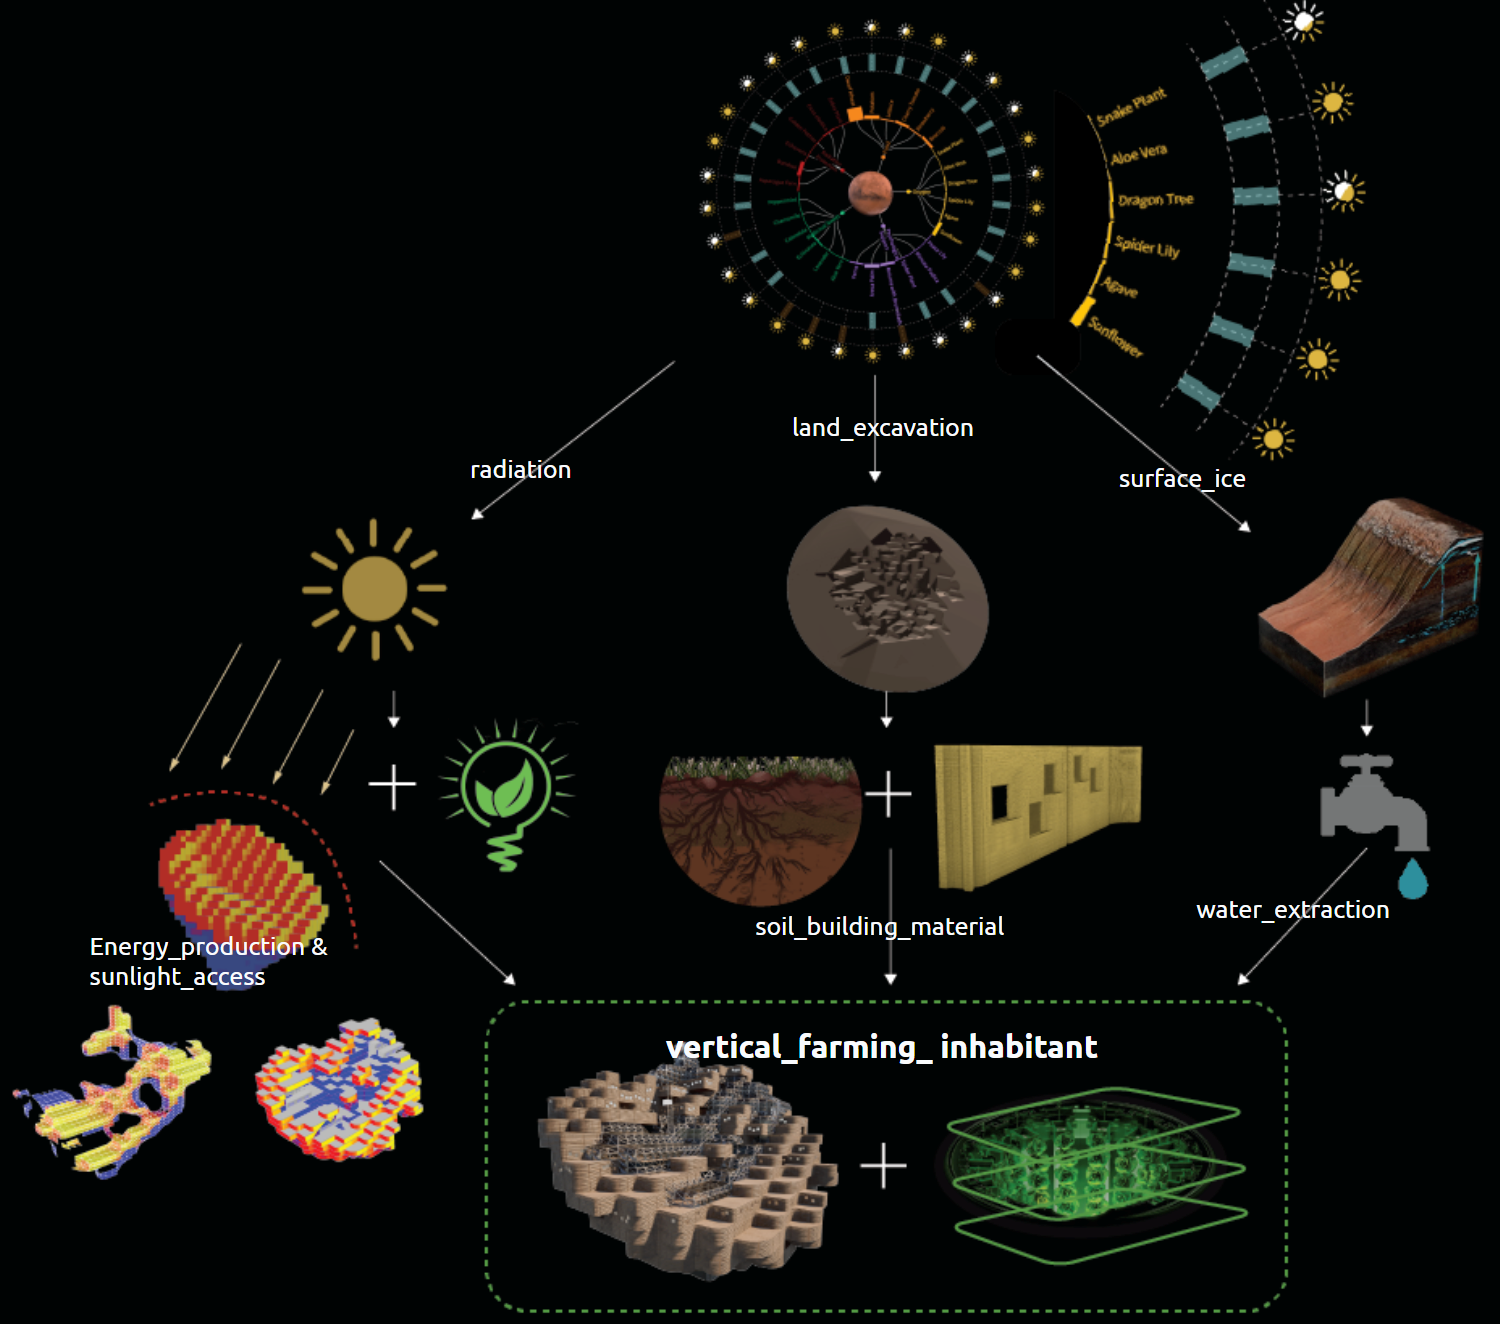
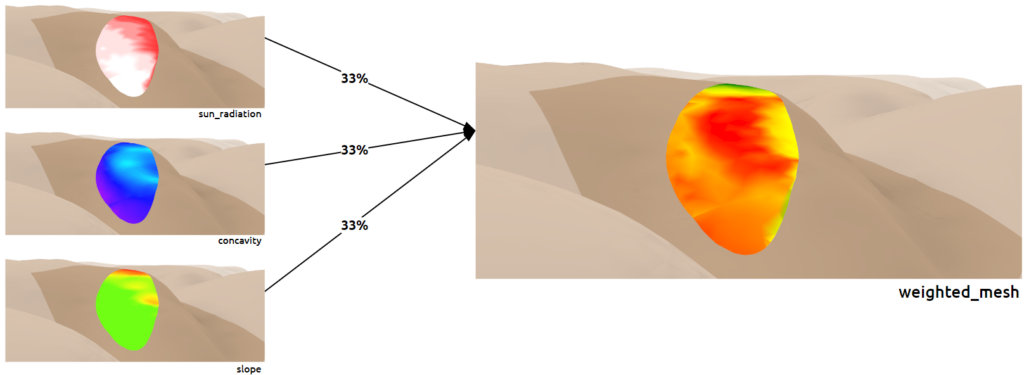
Three challenges demanded attention: radiation exposure, land excavation, and water extraction. The design strategy predominantly involved situating most voxels underground to facilitate water extraction and enable vertical hydroponic farming. Above-ground voxels focused on energy production and ensuring access to sunlight to support mental well-being. Utilizing Martian regolith as a building material further enhanced the project’s sustainability and adaptability to the harsh environment.
02_project_location
03_program distribution
The use of voxelization indeed contributes to the adaptability and versatility of the design. By breaking down the program into modular units, each serving specific functions, the design becomes highly customizable and responsive to the needs of the inhabitants.
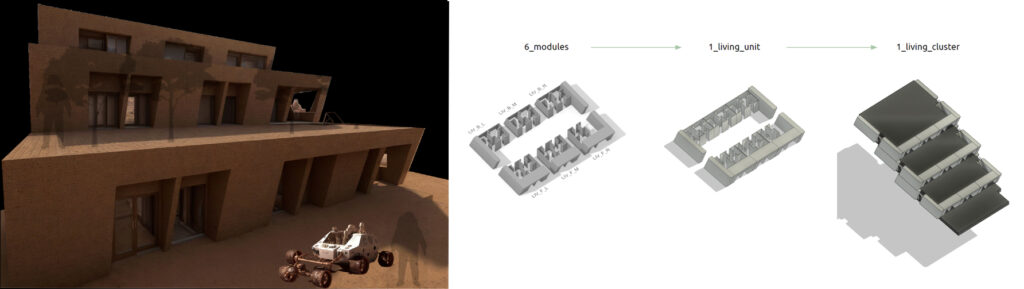
The communal living arrangement for 10 people fosters a sense of togetherness and mutual support, which is crucial for the psychological well-being of individuals living in such isolation. The differential shelving system for vertical farming furthers space within each voxel, ensuring that every inch is utilized efficiently without sacrificing accessibility.
The circulation system is vital in connecting different parts of the complex, facilitating easy movement, and encouraging interaction among residents. This promotes a sense of community and collaboration, essential for long-term habitation.
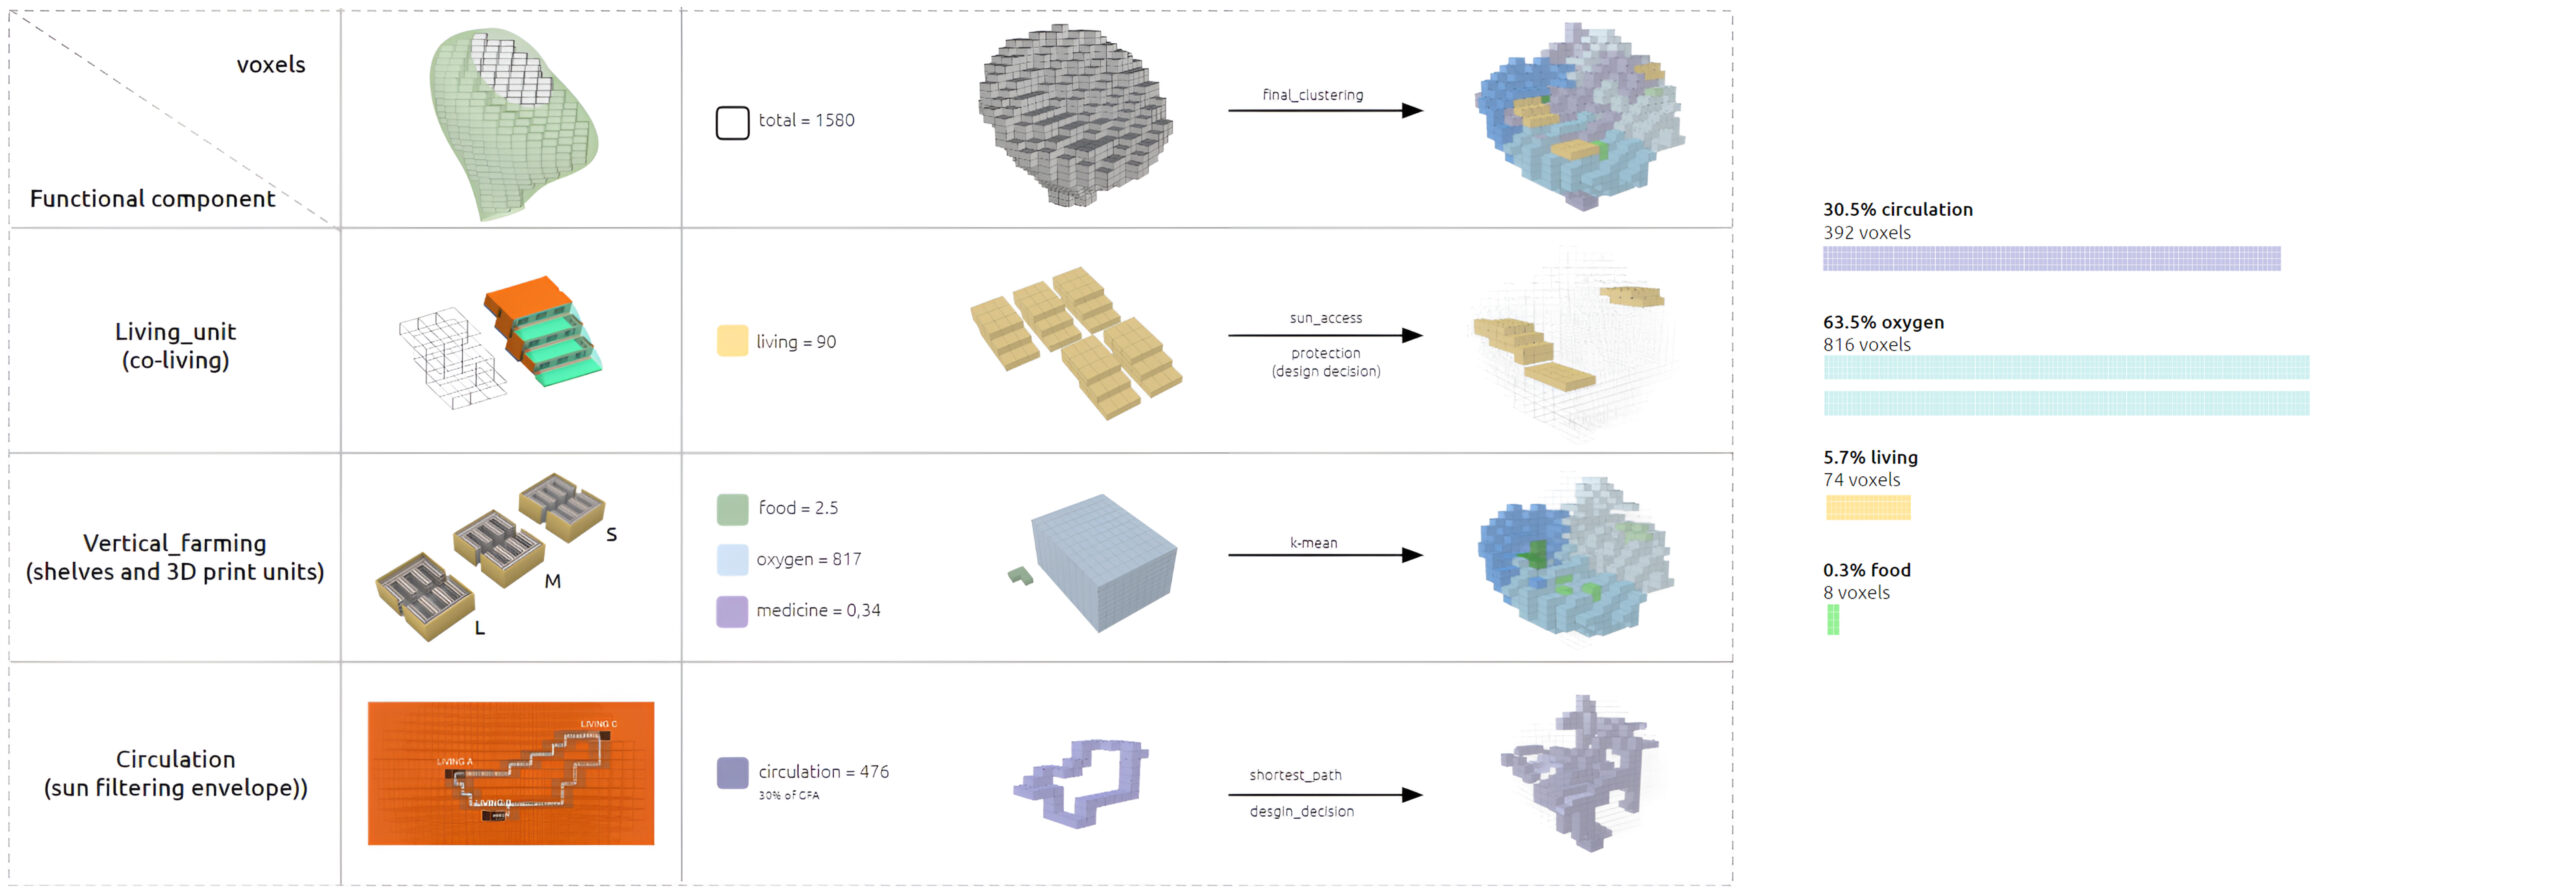
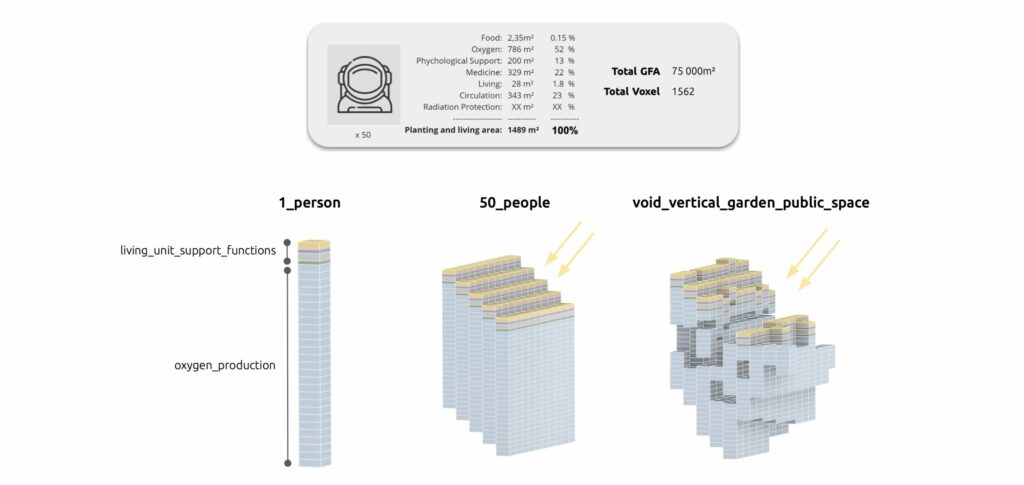
Overall, the clear visualization of voxel distribution and function percentage allows for a comprehensive understanding of the layout and design principles
04_design exploration
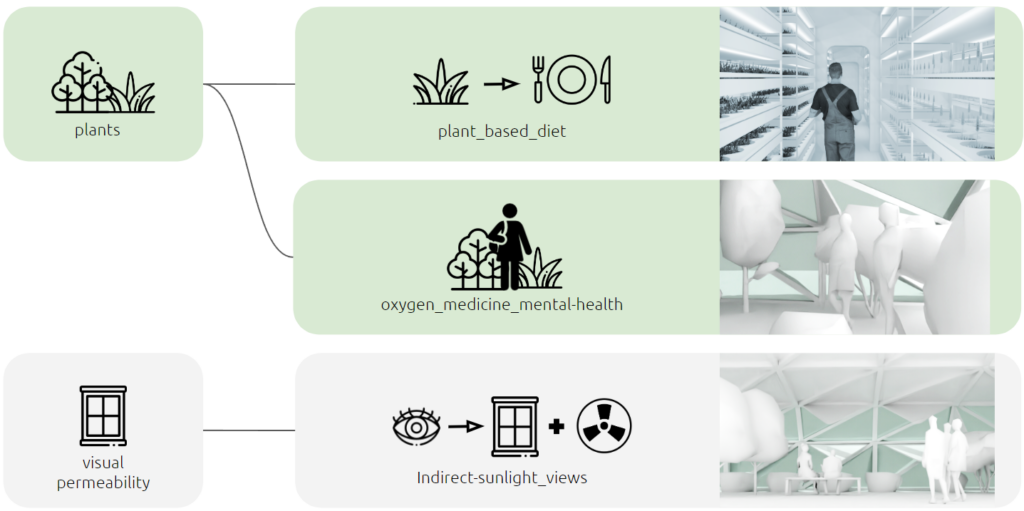
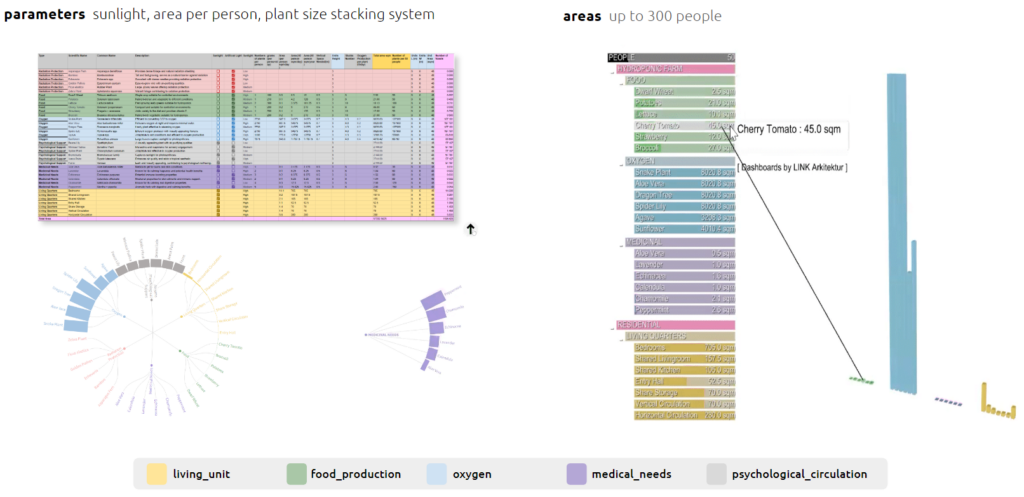
A thorough research was conducted on various plans and their attributes, subsequently categorizing them based on different aspects such as food production, oxygen generation, psychological support, and medical requirements. This classification took into account factors like sunlight requirements, farming methods, and human needs.
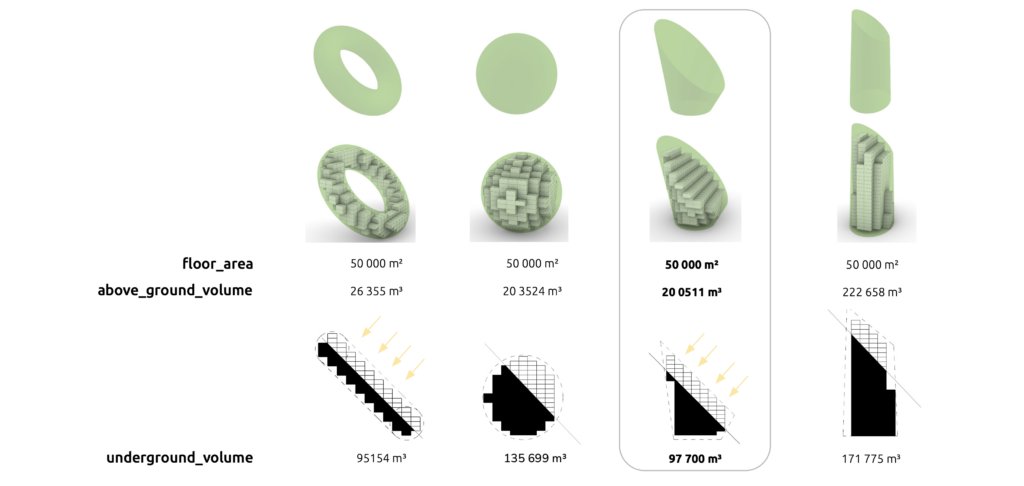
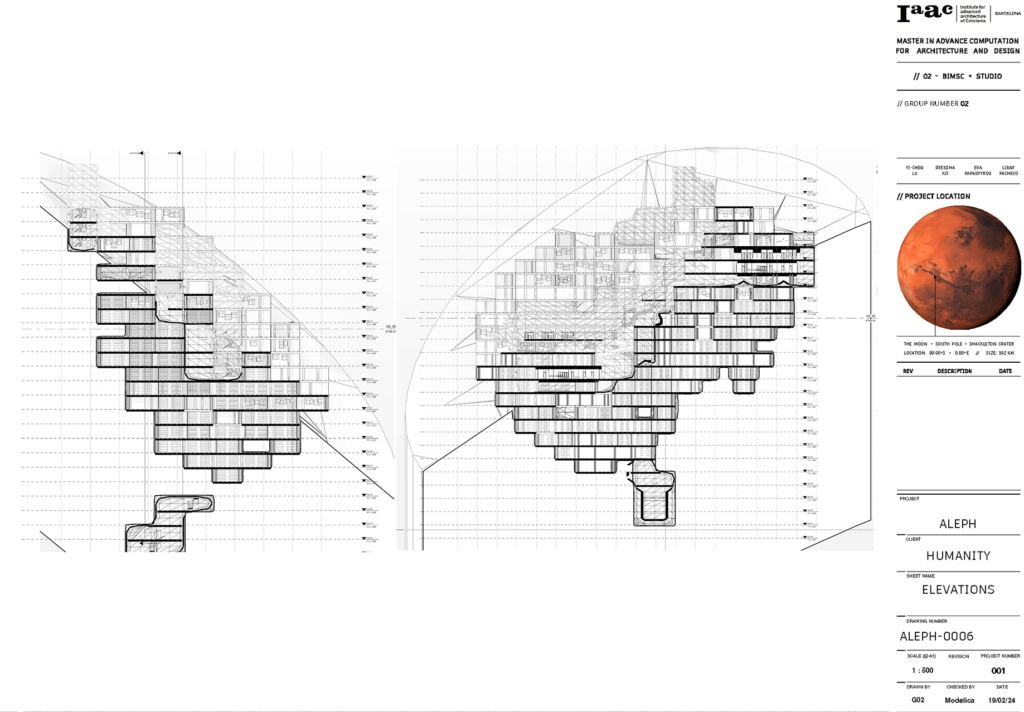
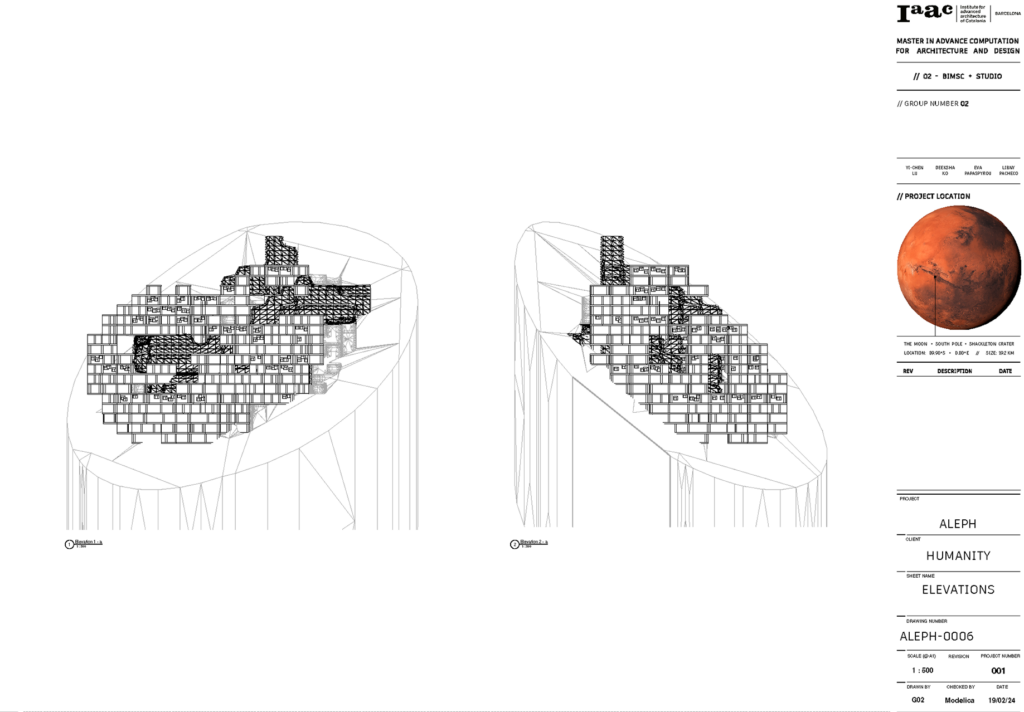
Predefined shapes are utilized for voxelization to initially fulfill the required GFA (Gross Floor Area). Subsequently, consideration is given to how these shapes can be situated within the slope or topography of the terrain. The decision to proceed with a cone shape is based on its ability to strike a balance between positive and negative space within the design.
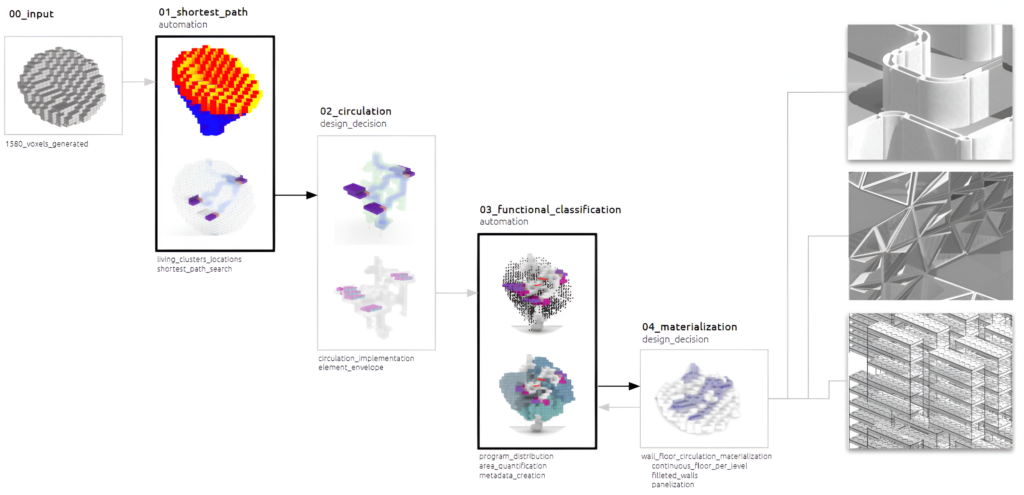
The process can be categorized into five main steps:
- Establishing input voxels based on shape selection.
- Establishing living units and circulation paths using the shortest path algorithm.
- Distributing the program for hydroponic farming through area quantification.
- Materializing the design using Revit, employing loadable families and parameters.
- Finalizing the design through the implementation of these steps.
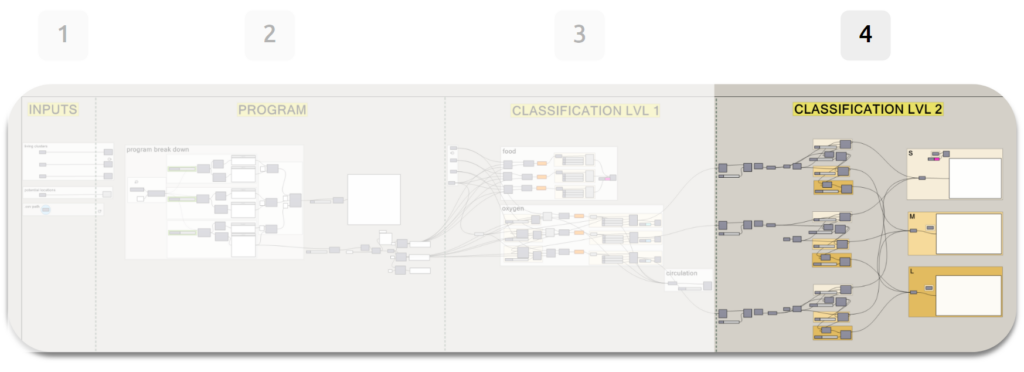
05_voxel_functional_classification
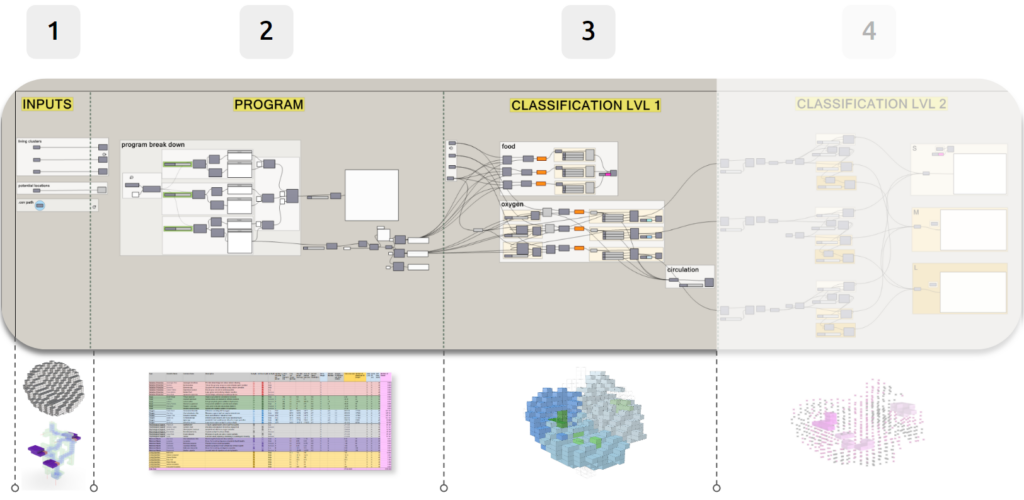
The computational methodology comprises four main steps:
- Initial setup of geometrical inputs, circulation, and voxels.
- Breaking down the program data from the CSV file.
- Functional classification of the program.
- Classification of Revit families based on the program requirements.
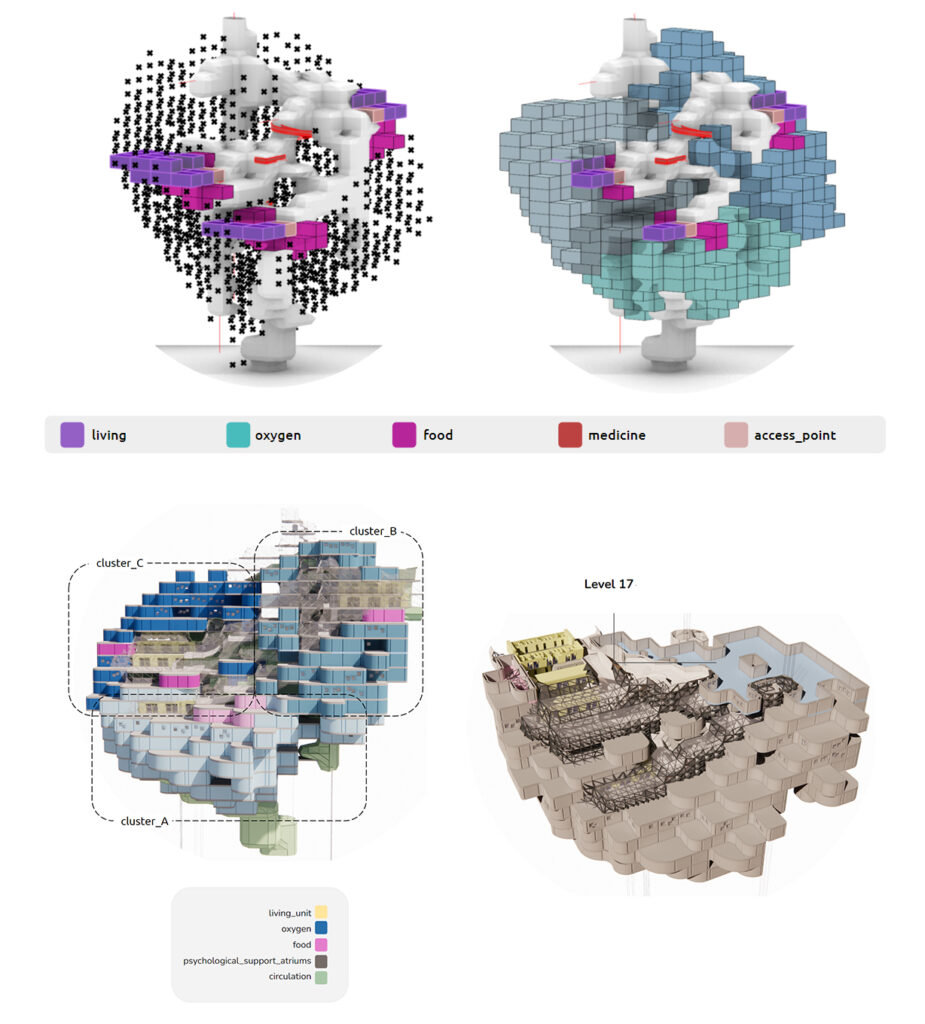
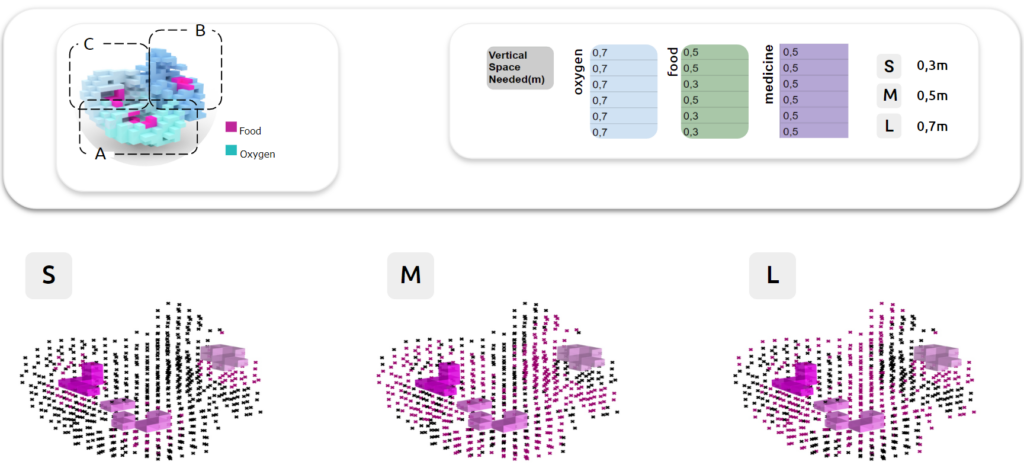
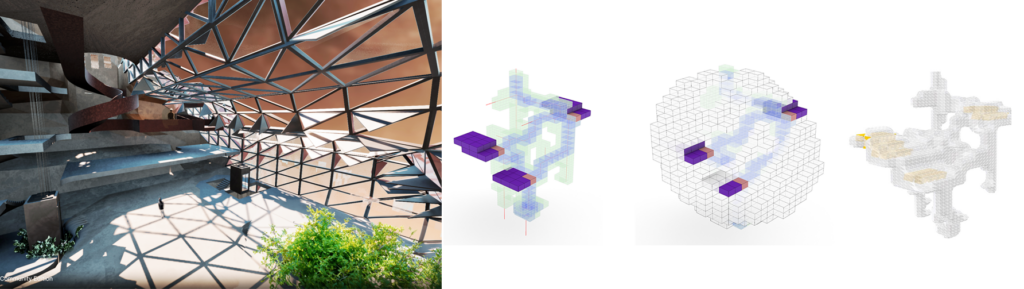
In the functional classification process, points are culled to define clusters representing different plant categories. These categories include oxygen, represented in blue, food in pink, and living spaces in purple.
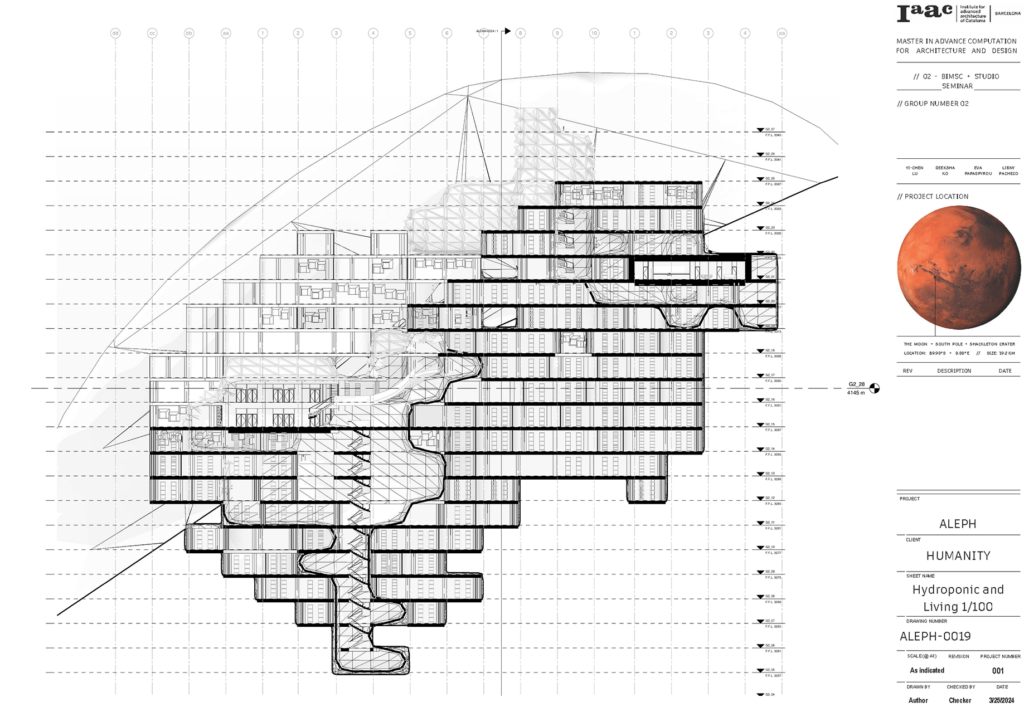
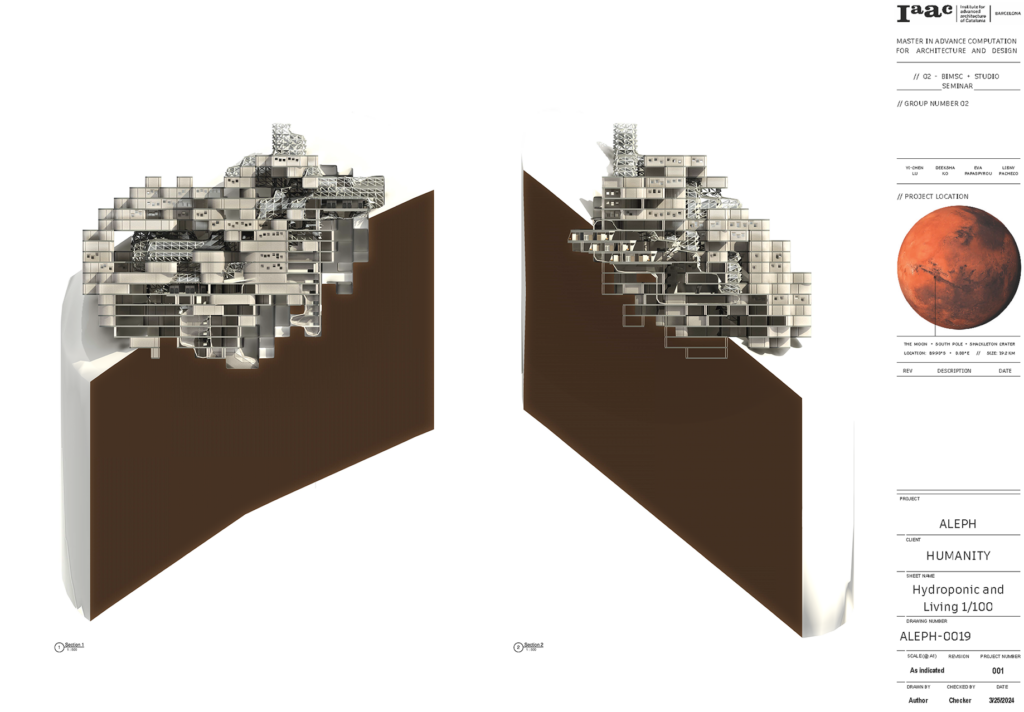
In the visualization, three clusters are evident, each representing oxygen, food, and living units respectively. Circulation pathways are highlighted in green, while paneling in front serves to filter sunlight. A floor plan provides insight into the distribution of programs within the interior space, with food areas located in proximity to living units and oxygen spaces occupying a significant portion on the other side.
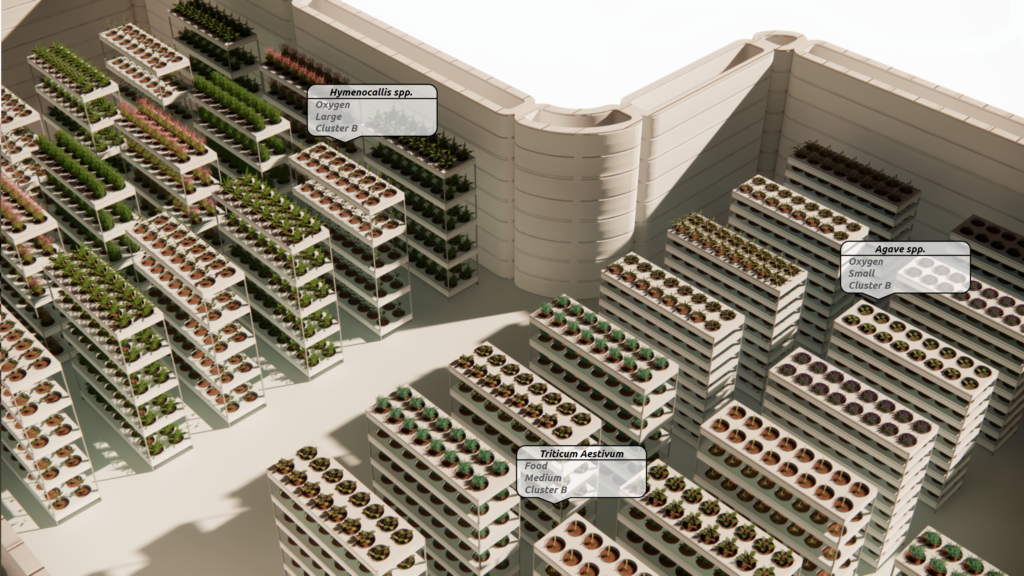
06_module_detail_design
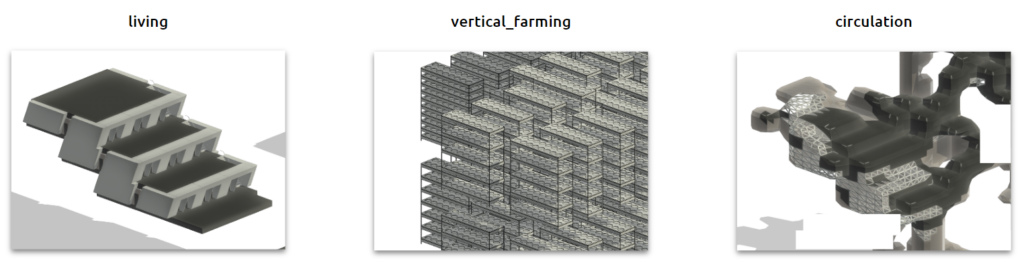
_living unit
_vertical farming
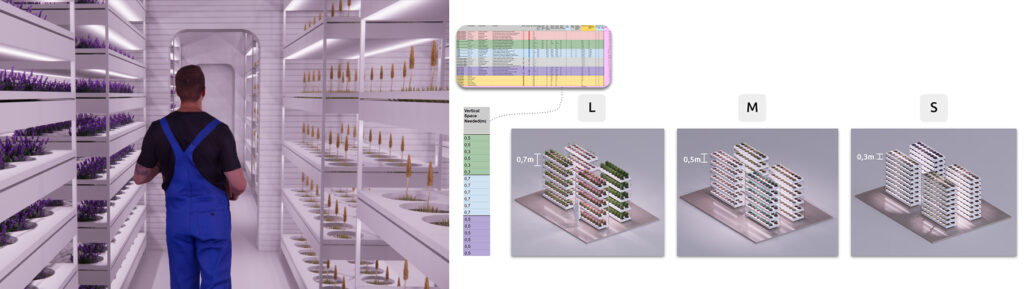
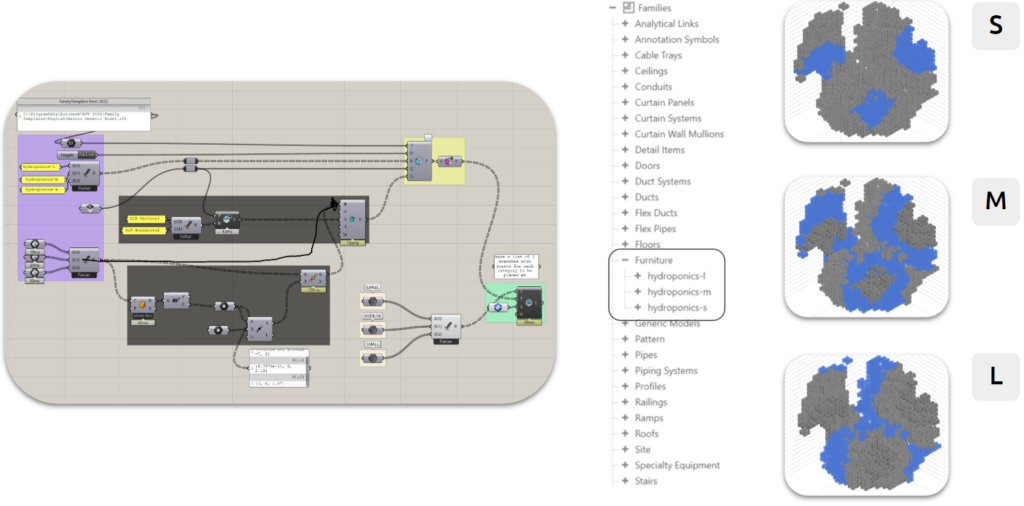
In the final step of our computational workflow, we classify plants into three categories based on their height: small, medium, and large. This classification facilitates the implementation of a vertical stacking system within each cluster, optimizing space utilization.
The visualization showcases the three clusters represented in three shades of blue, indicating an equal distribution of small, medium, and large plants within each cluster. This classification was instrumental in introducing the hydroponic geometry into Revit families. By maintaining metadata as parameters, three distinct families were created to accommodate our plant system efficiently.
_circulation
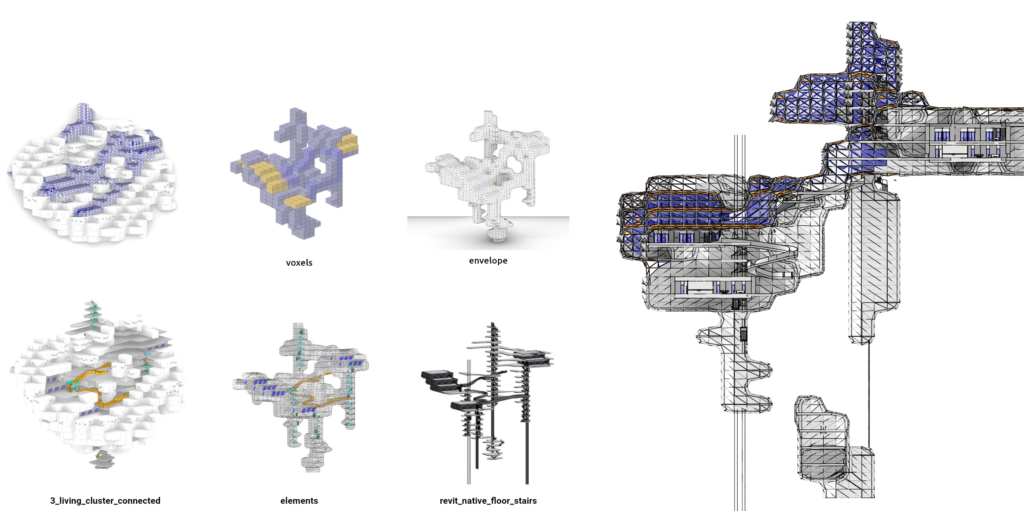
The circulation system is intricately integrated into the voxel system, designed to connect the three groups of living units efficiently via the shortest path. Circulation elements are strategically implemented throughout the habitat to facilitate ease of movement and connectivity between the living units.
The soft body design utilizes adaptive panels to filter light and block radiation, enhancing our concept of thriving rather than just surviving. This integration includes ramps and stairs to connect multiple levels seamlessly. Currently, the floors are hidden to emphasize the interconnectedness of the design and highlight its multi-level functionality.
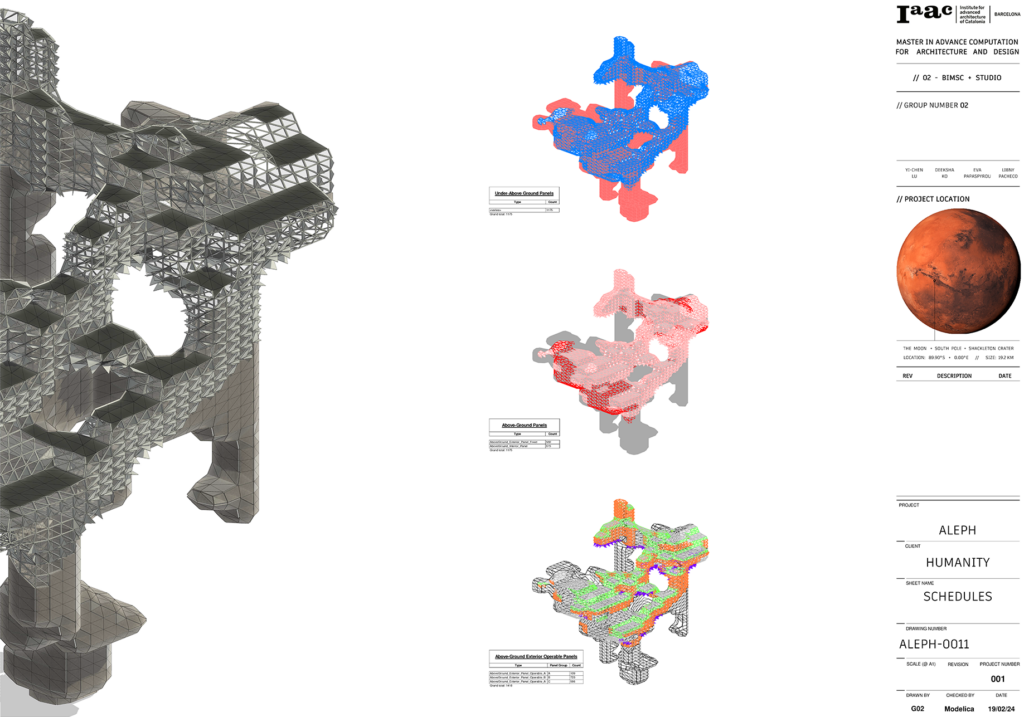
07_constrcution_fabrication
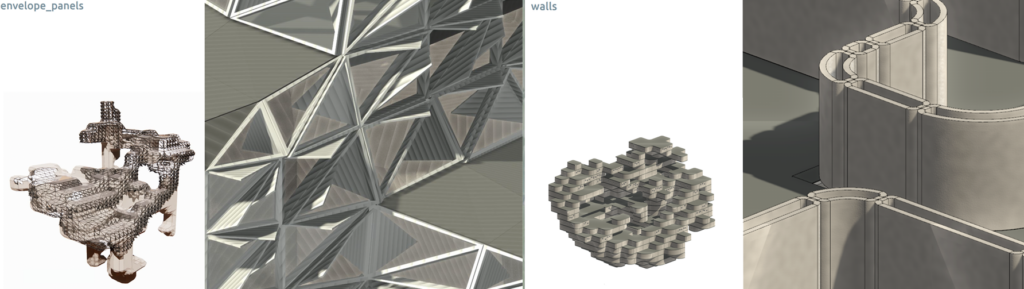
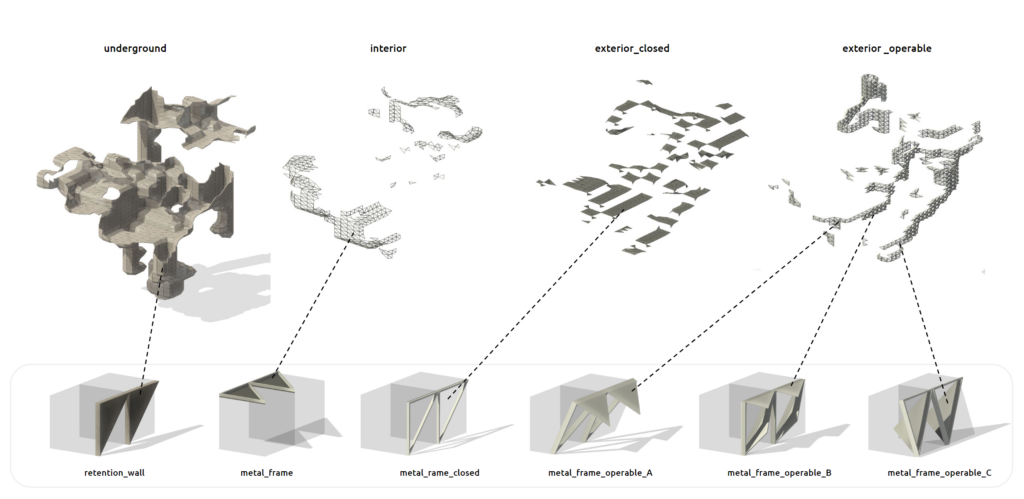
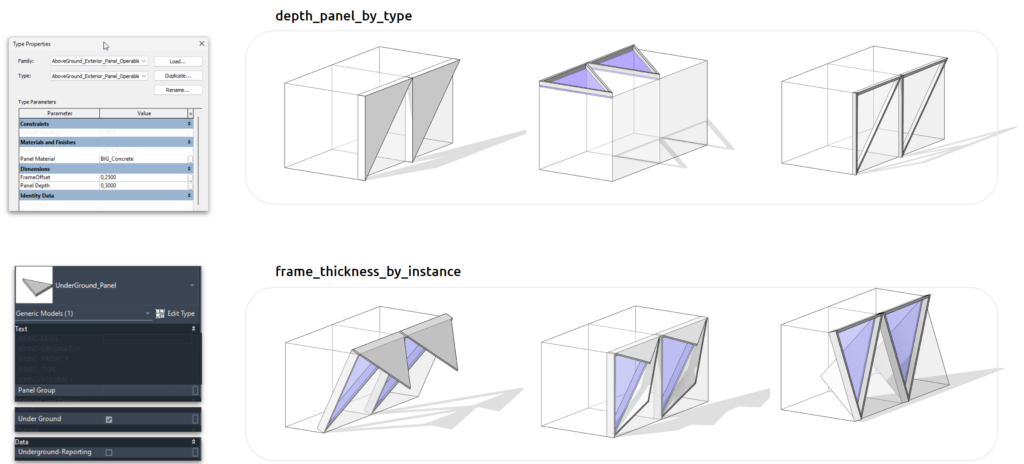
In the development of the paneling for the circulation envelope, six unique adoptive families were crafted. These families were meticulously designed to encompass a blend of both type and instance parameters, thereby guaranteeing versatility and adaptability throughout the design process.
For the wall, a proposal suggests a protective 3D-printed structure. Each segment forms a loop of 1 meter, creating layers within the wall. This wall can be automatically generated from the floor outlines in Rhino and then integrated into Revit. Attempts were made to introduce windows into the 3D printing process by defining the positions of points on the loop.
08_collaboration_tooling_interoperability
The overall workflow of the project can be divided into three main parts: the computational rhino grasshopper workflow, the Revit workflow, and the post-production workflow.
Through this workflow, we identified three possibilities for automation –
1. Site location allocation using Specklepy and Specklebot
2. Clustering and Classification of plant voxels using Specklepy, speckle-bot, and TopologicPy
3. Revit the Federated model using Specklepy and Speckle-bot
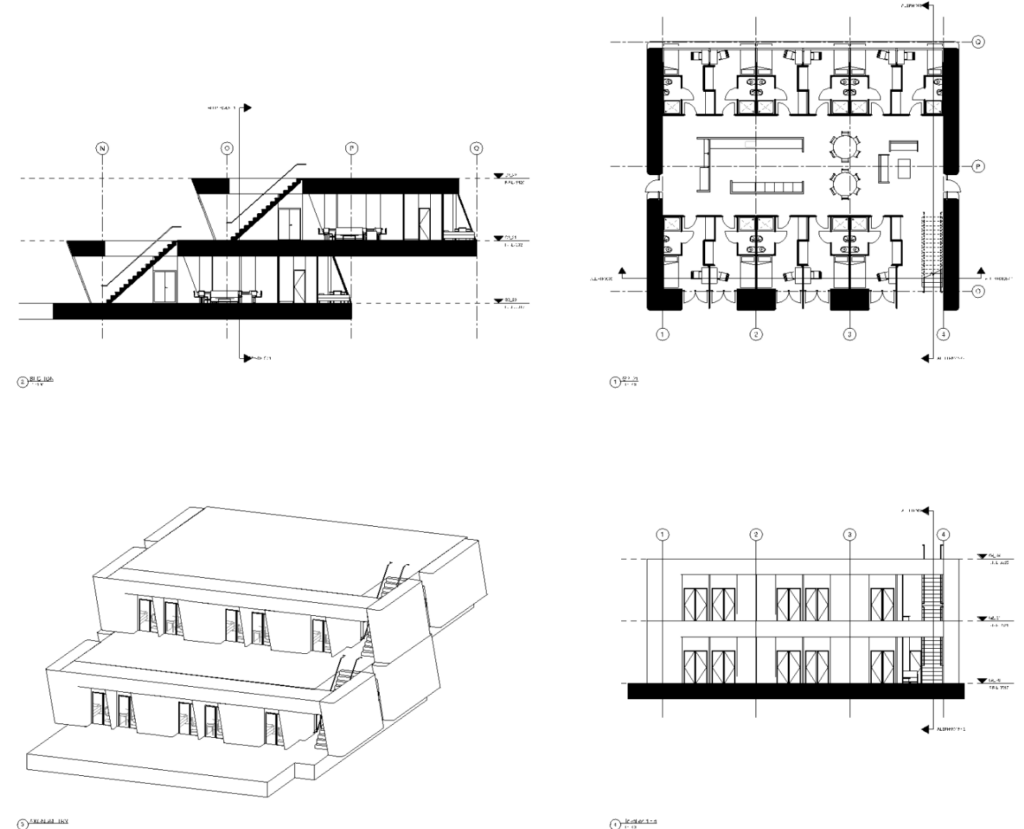
09_BIM_documentation1
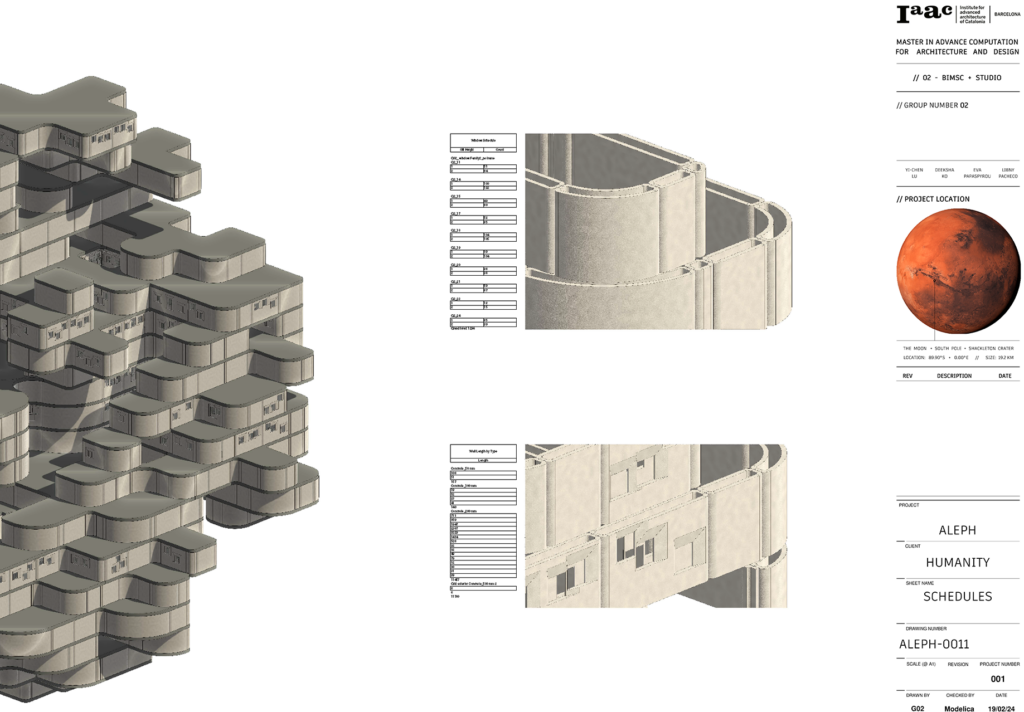
A shared parameter file facilitated the application of filters to elements within the project. To generate schedules, this method is particularly useful, especially considering the utilization of five linked Revit files.
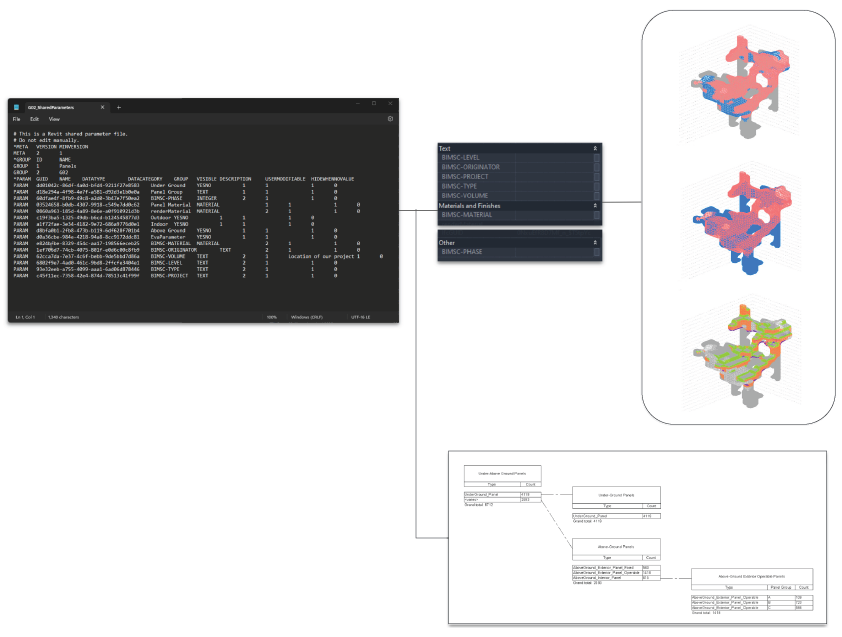
Type and instance parameters are employed to drive the geometry of certain elements within the project. For instance, the depth of panels is controlled by a type parameter, while the thickness of panel frames is controlled by instance parameters.
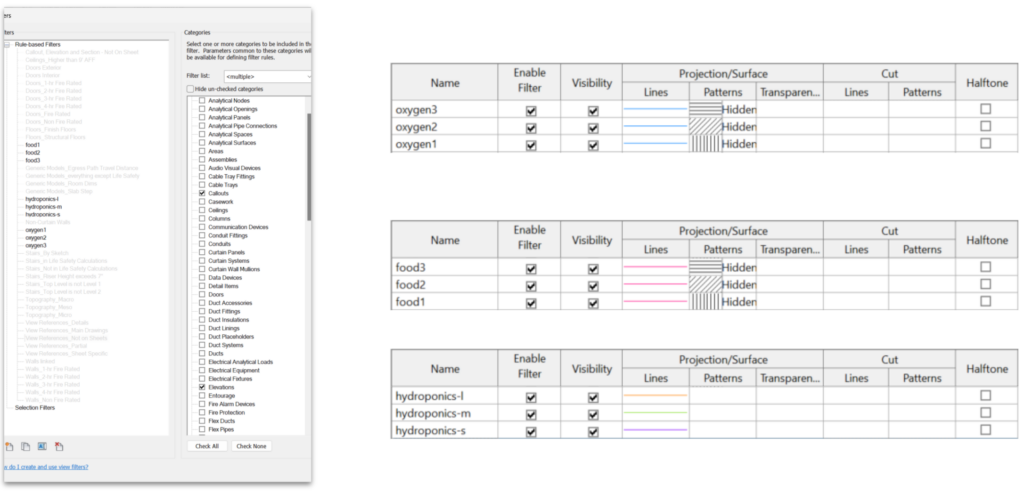
A series of filters were combined to enable custom filtering and coloring of the elements.
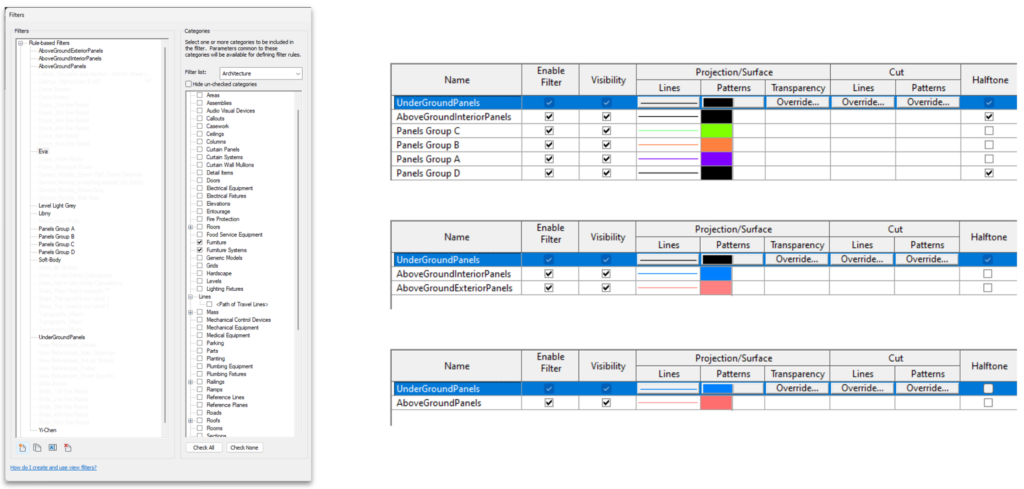
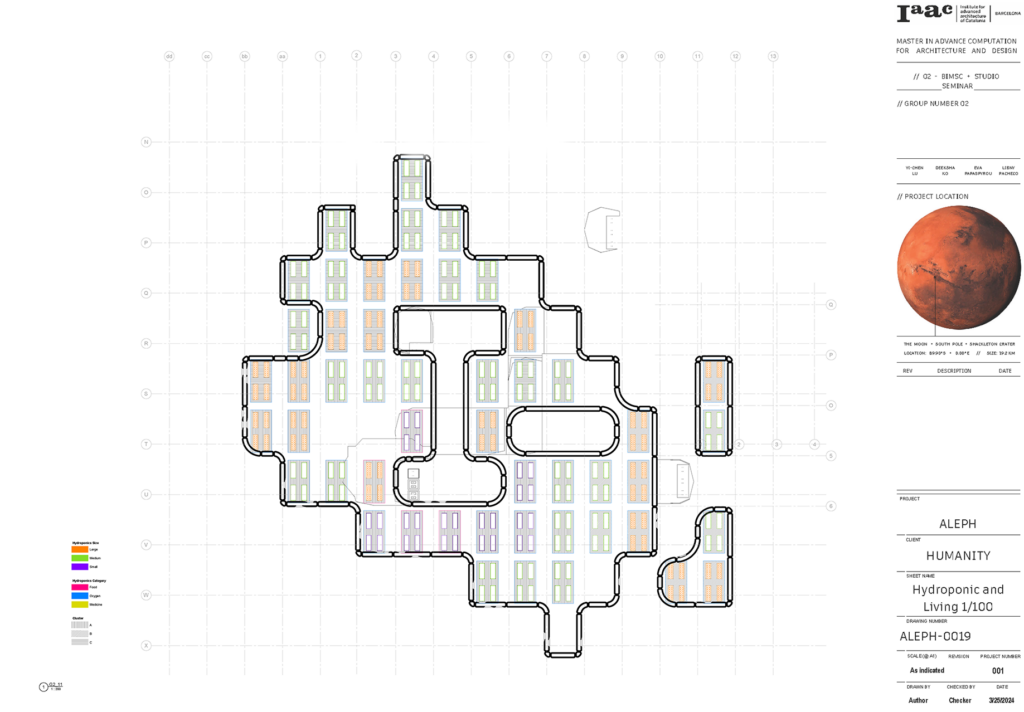
Here is a Revit sheet featuring a plan and callouts, demonstrating how informative plans are provided for filtering purposes.
The Revit levels have been automated using Grasshopper, allowing for the automatic generation of all plans.
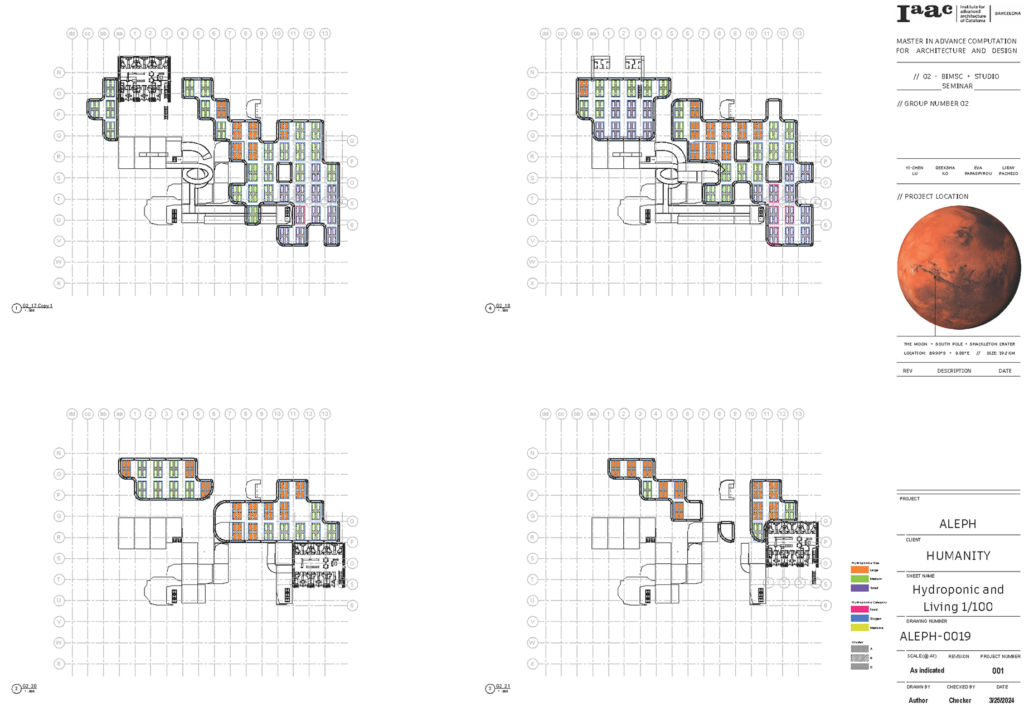
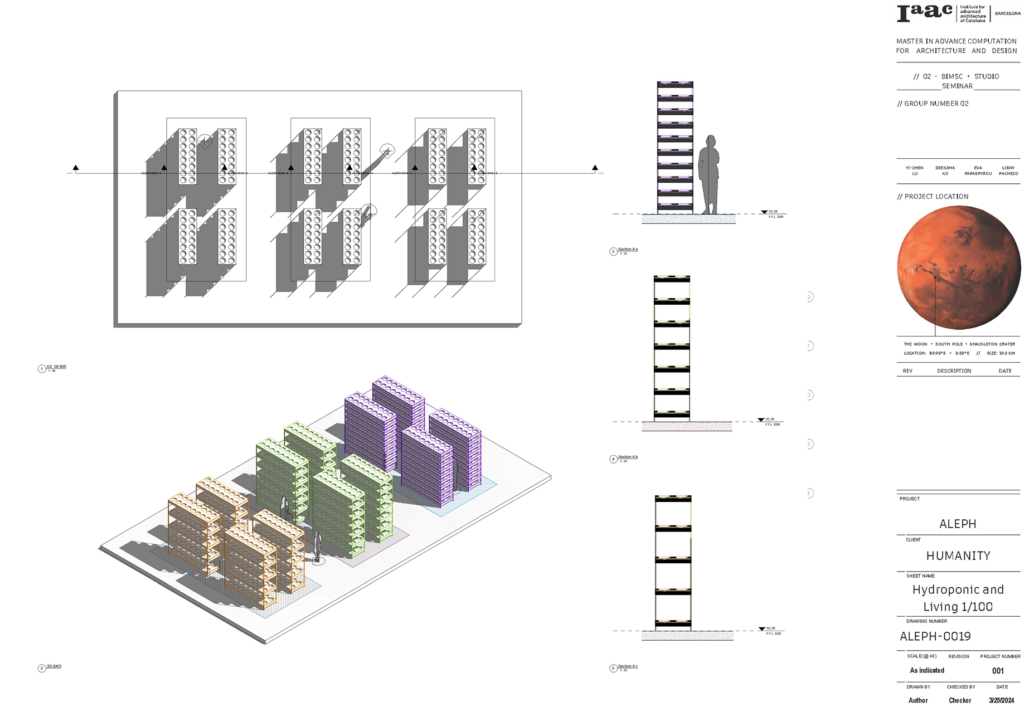
In the detailed Revit sheet, parameters are displayed as filters, providing comprehensive information. In sections, the three plant types are clearly differentiated. When reading the axonometric view, the stacking color corresponds to the size of the plants, while the floor perimeter color indicates the type, and the hatch pattern signifies the cluster. For instance, the orange color represents large plants for oxygen cluster B.
- project BIM management @libnypacheco
↩︎
