
Using Street View and Remote Sensing methods to infer ground level socio-economic realities
The Challenge: The Urban Data Blind Spot
Urban economies are dynamic, fast-evolving systems—but the data used to understand them is often static, delayed, or incomplete. In many cities, a significant share of economic activity unfolds beyond the reach of traditional measurement frameworks, leaving policymakers with limited visibility into how neighborhoods grow, shift, and respond to change.
Conventional economic analysis relies heavily on formal reporting systems, surveys, and aggregated indicators. While useful, these approaches struggle to capture real-time dynamics or granular spatial variation across urban environments. As a result, critical decisions around infrastructure, zoning, and resource allocation are often made without a full picture of on-the-ground realities.
At the same time, cities are generating vast amounts of untapped spatial data through satellite imagery, remote sensing technologies, and urban sensing systems. These data streams capture signals such as land use transformation, density patterns, mobility flows, and environmental conditions—yet they remain underutilized in economic analysis.
The challenge, therefore, is not simply the availability of data, but the ability to translate complex spatial signals into meaningful economic insight. Without effective methods to interpolate and interpret this data, a significant opportunity is lost: the ability to move from fragmented observation to continuous, high-resolution understanding of urban economic activity.
Harnessing the Build Environment as an Input.
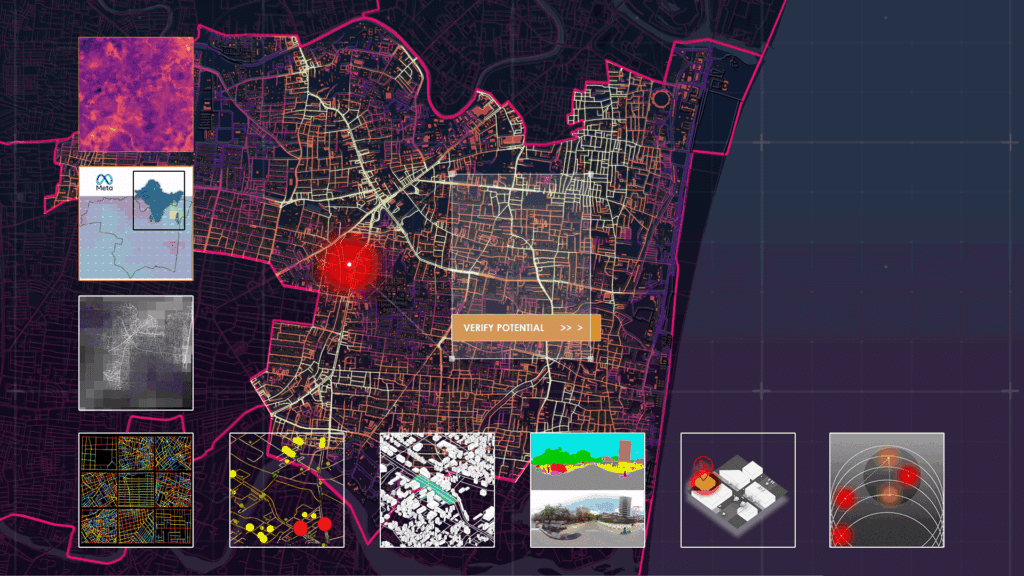
Recent advances in remote sensing, computer vision, and geospatial analytics have opened new frontiers in how urban environments can be understood and measured. Satellite imagery and street-level data now provide rich, scalable layers of information about the built environment, enabling the quantification of patterns such as population density, thermal conditions, land use dynamics, and urban form.
When integrated and analyzed collectively, these datasets move beyond simple observation to reveal the underlying structure and behavior of city economies. Spatial signals—once treated as purely environmental or visual inputs—can be interpolated into meaningful indicators of economic activity, growth intensity, and neighborhood-level dynamics.
By combining these data streams, it becomes possible to construct composite spatial indices that reflect how different parts of a city function and evolve over time. These indices provide a more continuous and granular understanding of urban systems, capturing variations that traditional datasets often miss.
In this framework, the focus shifts from isolated data points to spatial context—transforming raw geospatial information into actionable economic intelligence that can support more precise, adaptive, and forward-looking decision-making.
Geolocating the Development of this Tool : Chennai, India
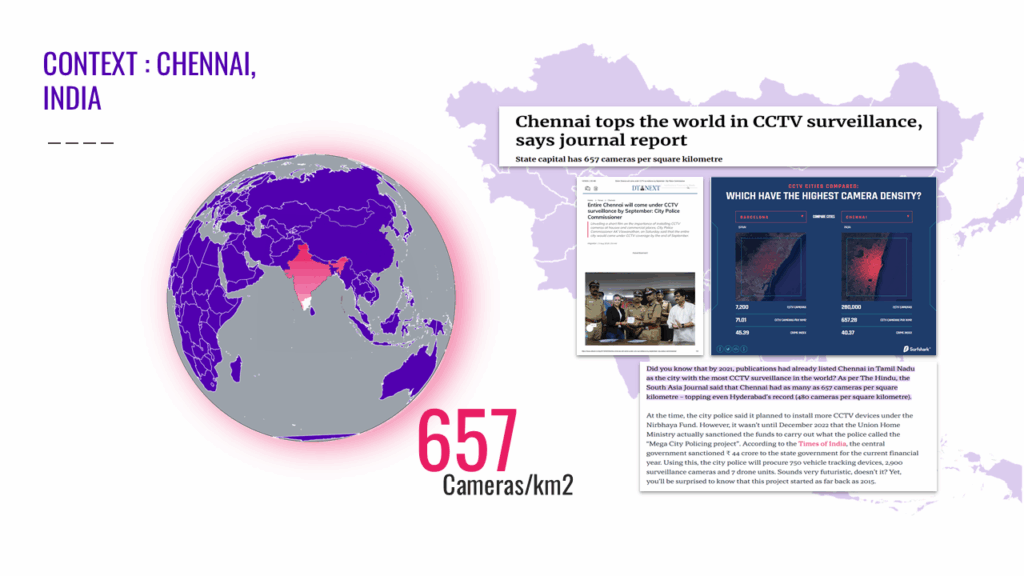
Chennai presents both opportunities and challenges as a test bed for studying the impact of F&B establishments and the significance of geolocation factors on their success. The city holds the 4th largest food service market in India, valued at ₹15.6 thousand crores ($18.72 billion USD), with Quick Service Restaurants (QSRs) and cloud kitchens leading the organized segment. Its diverse population, rich culinary heritage, and growing appetite for experiential dining make it an ideal location to test innovative F&B formats. Areas like Anna Nagar exemplify culinary booms, offering insights into how geolocation factors like footfall, accessibility, and neighborhood demographics influence restaurant success. Additionally, Chennai’s established legacy chains and multi-brand restaurant models provide a robust framework for analyzing scalability and customer loyalty.
The Methodology
The project began by collecting data from open sources such as OpenStreetMap, Google Earth Engine, and Overture Maps. The goal was to identify universal parameters that signal the viability of a location for F&B businesses.
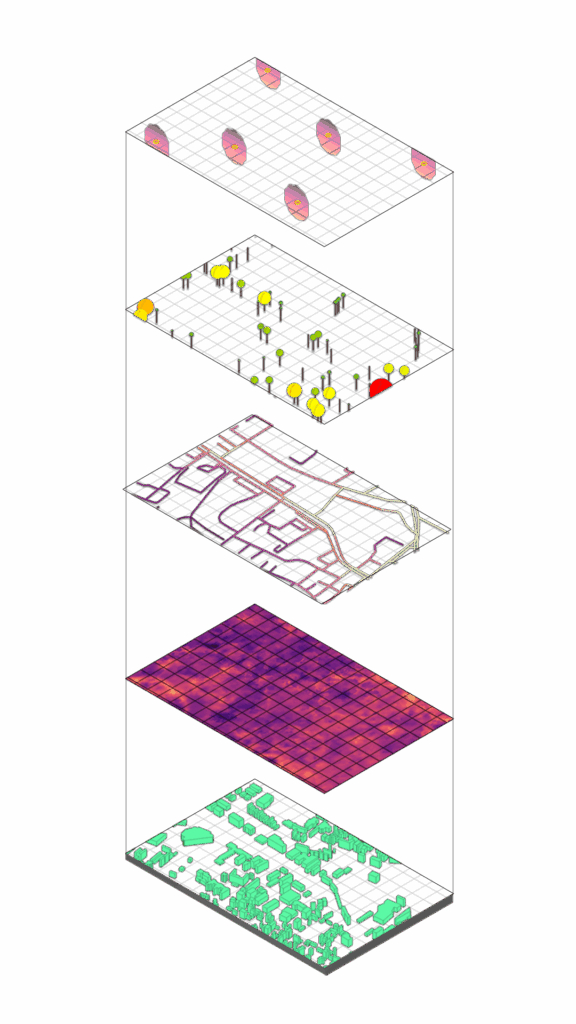
Key steps included:
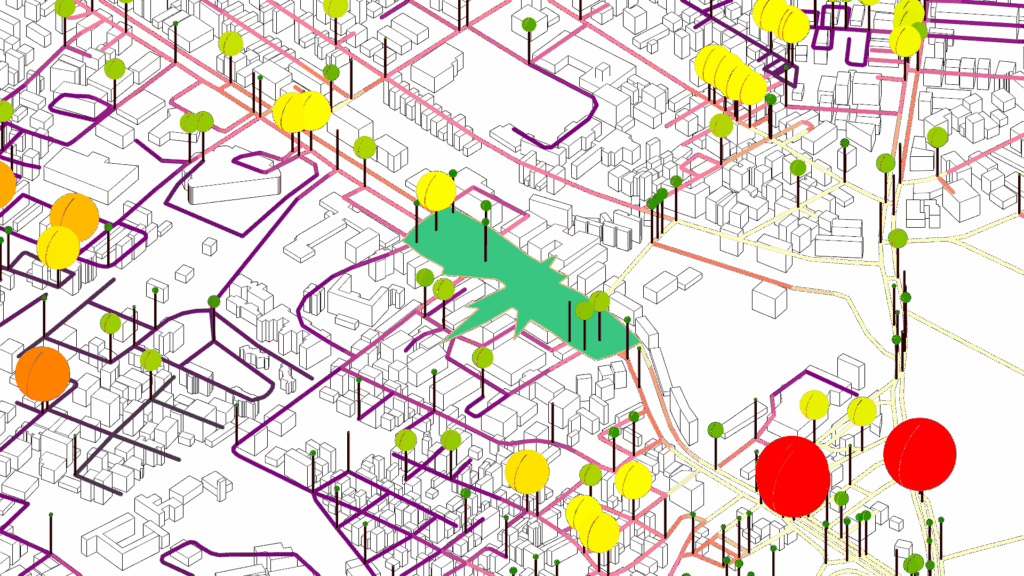
- Satellite Data Analysis: Assessing thermal comfort, socio-economic indicators, and population density.
- Street View Imagery: Using computer vision to evaluate visual appeal, and environmental factors such as pavement quality, canopy coverage, and street furniture.
- Environmental Systems: Measuring centrality and proximity to points of interest within walking distance.
A deep learning model processed over 4,000 street-level photos, performing image segmentation and object classification to quantify elements that contribute to a location’s attractiveness. Parameters were assessed at the street segment level, providing hyper-local insights for policy makers.

From Theory to Practice
While the methodology is broadly applicable, its implementation is illustrated through a detailed case study in a singular urban neighborhood. Here, the tool identifies clusters of successful F&B establishments and distills the key spatial and environmental factors that contribute to their success and inform neighborhood socio-economic underlays. This analysis provides urban planners and policymakers with valuable insights into the drivers of local economic activity.
Implications and Future Directions
The integration of spatial data and computer vision into economic policy in data scare regions has far-reaching implications:
- For Lenders: Enhanced ability to identify viable business opportunities, reduce risk, and expand access to financing for underserved populations.
- For Urban Planners and Policymakers: New tools for understanding hyper-local economic dynamics, supporting evidence-based interventions, and fostering sustainable urban development.
- For MSMEs: Greater access to financial resources, empowering entrepreneurs to invest in growth and resilience.
Looking ahead, the next phase of research will focus on refining the machine learning models, incorporating agent-based simulations for temporal analysis, and expanding the scope of data integration to include emerging sensor networks and alternative data streams. This ongoing innovation promises to further democratize access to ground level spatial and economic data and to support the development of more inclusive, resilient urban economies.
Conclusion
By bridging the gap between traditional data collection methodologies and the realities of urban informality, spatial data and computer vision offer a powerful lever for advancing financial inclusion. As cities continue to evolve, the integration of these technologies into lending practices will be essential for unlocking the full potential of urban MSMEs and building more equitable, sustainable urban futures
This approach reflects the analytical rigor and interdisciplinary perspective of urban planning, economics, GIS science, and research, while addressing both the technical and policy dimensions of financial inclusion.
