
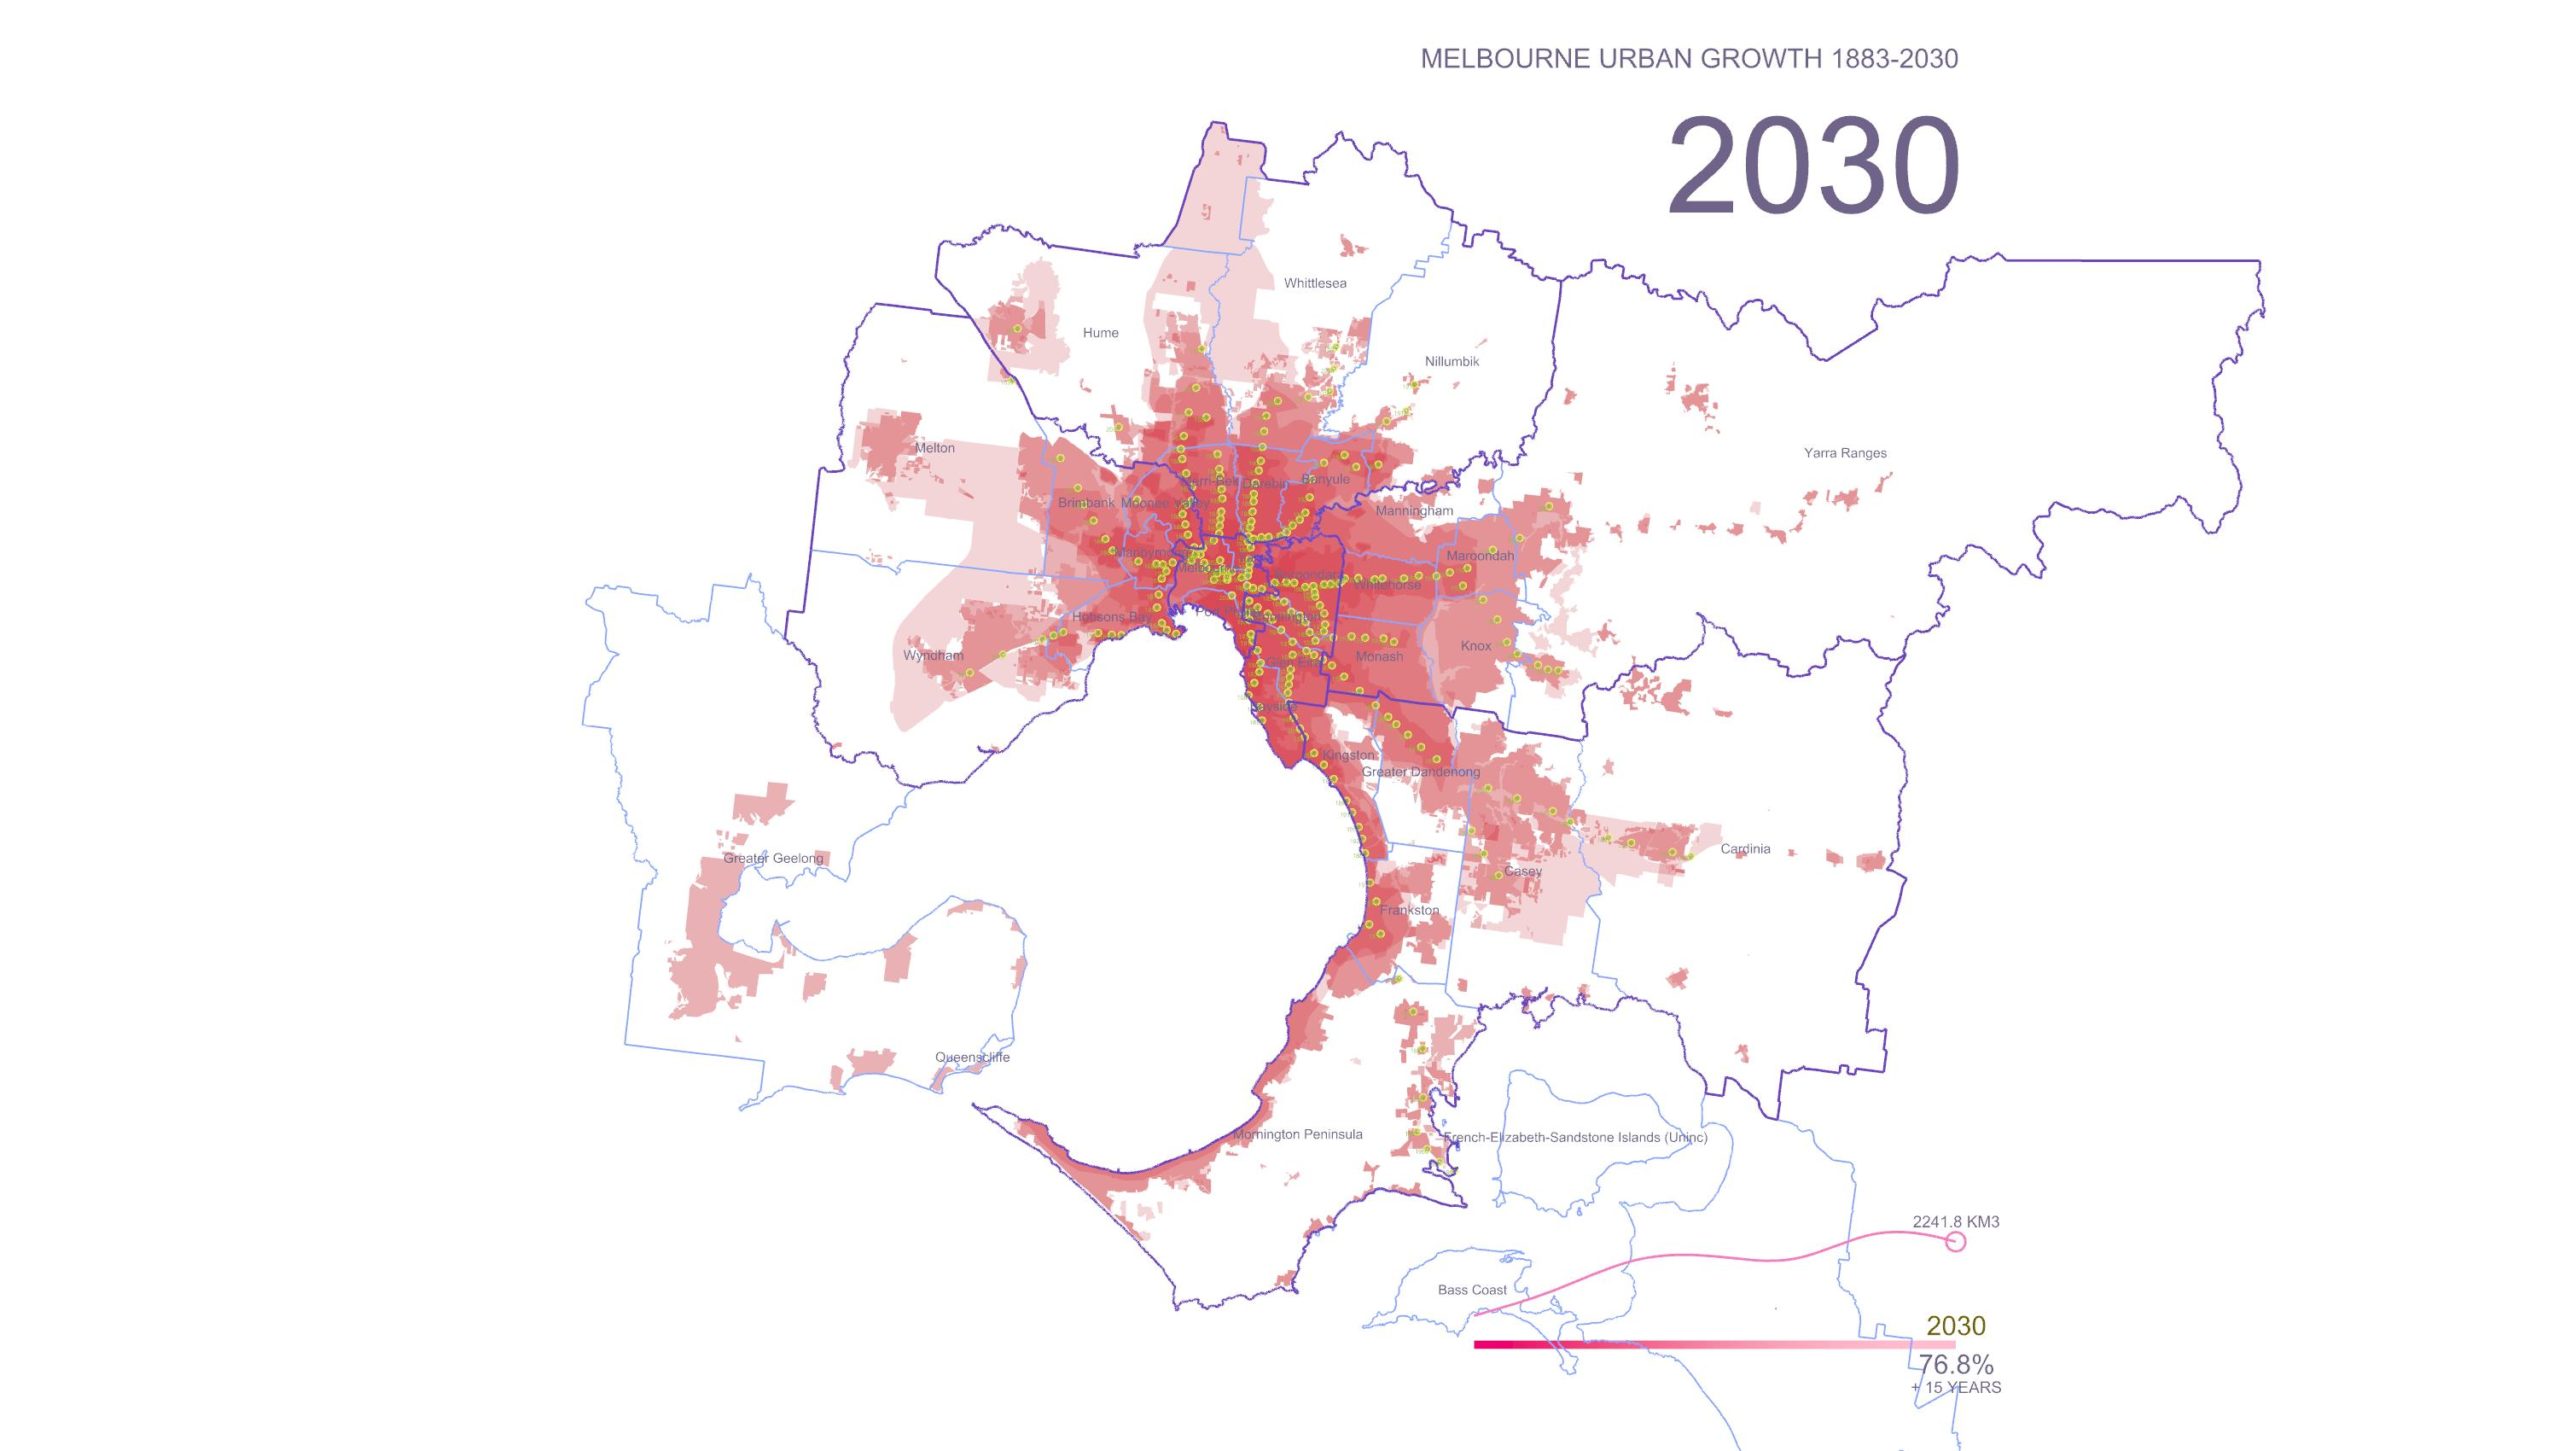
Starting in 2015 urban development spread beyond the administratively defined Melbourne metropolitan area, into Greater Geelong and the Shire of Mitchell. The Melbourne Metropolitan Region or Greater Melbourne comprises 31 Local Authority Governments (LGA, municipalities and shires) aggregated in 6 metropolitan partnerships. Two of them, Inner and Inner South-East allocate the metropolitan core.
This project aims to understand the urban sprawl patterns of Melbourne through time, reveal the most dynamically changing areas, and test counteracting solutions against that.
Australian cities including Melbourne are car dependent and this means that housing for a growing population is accommodated largely through a suburban growth model that contributes towards urban sprawl. New suburbs on the fringe of the Victoria’s capital are expensive to build and are heavily subsidized. Average new suburb costs 3 times more than a densified urban neighborhood with the same amount of new residents. While new land-owner pays only for a plot and expansion of utilities, authorities cover expenses for highways, public transport, critical and social infrastructure, environment conservation.
According to Sergio Famiano, author of New Australian Dream: rethinking our homes and cities to solve the housing crisis, population growth and car dependency are the primary drivers of unbridled urban expansion but political will and innovation could still minimize the scale and impact of sprawl in the future.
If larger urban populations can be accommodated in existing urban areas through infill development, this will limit the establishment of new suburbs and sprawl while at the same time accommodating a greater population.
But there needs to be a policy shift by all levels of government in favour of urban infill development over new suburban development and this needs to be supported by the necessary infrastructure to encourage infill development, such as public transport.There is a strong nexus between mid-tier public transport such as light rail and trackless tram technology and the development of housing diversity such as apartment development.Summing up the main question is: how can we track the pace of urban sprawl of the Melbourne metropolitan area in order to understand what localities could become the first target for infill densified development and improvement of public transportation?
HYPOTHESIS
- Although accurate definition of urban sprawl is debated, a general consensus is that urban sprawl is characterized by unplanned and uneven pattern of growth, driven by multitude of processes and leading to inefficient resource utilization.
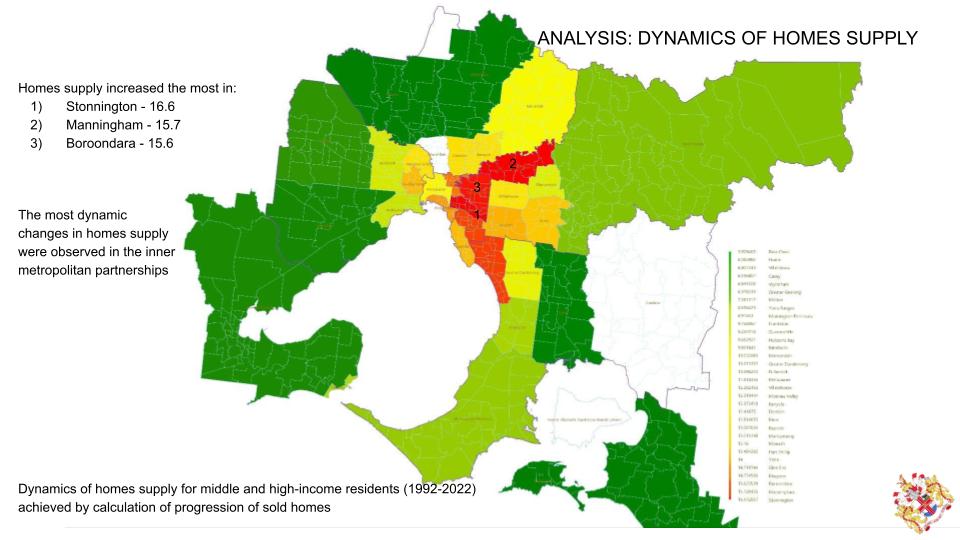
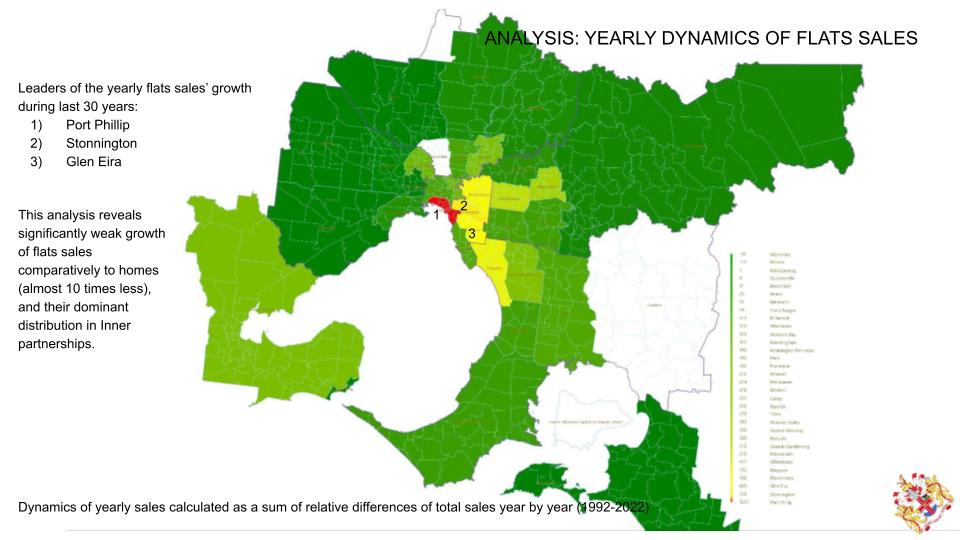
- Considering the last studies of Melbourne’s urban sprawl revealing the out-breaking population dynamic growth in the fringe zones we are going to prove that the infill densified development should be addressed the first of all to the inner ring of metropolitan zones in order to balance back the urbanization loads.
- Additionally, comprehending the dynamics of public transport development, we are going to highlight that the inner ring zones need more public transport connectivity (trackless tram) as a supplement of the strategy of the infill densified development.
METHODOLOGY
To reveal the map patterns of the most dynamically changed areas we are going to make a synthesized analysis of big data: prices of real estate, home diversity and density, access to transport, and population growth. We use the official and mined datasets, cleaning them with Python, visualize and synthesize them with Grasshopper and QGIS in order to comprehend correlations and identify patterns. Street network and transport access are the subject to analyze with UNA tools and Grasshopper in a selected LGA with the most dynamic urban sprawl effect.
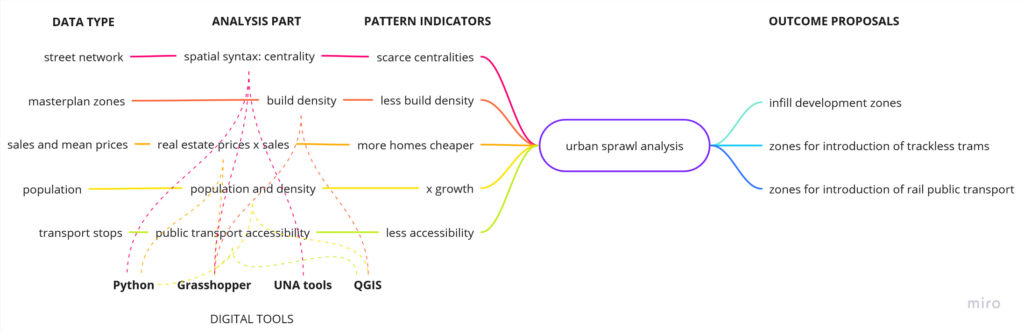
Tools used for the project:
- Python libraries OSMNX, networkx, matplotlib, geopandas, pandas.
- UNA tools plugin for Rhinoceros 7
- Urbano plugin for Grasshopper 3D
- QGIS


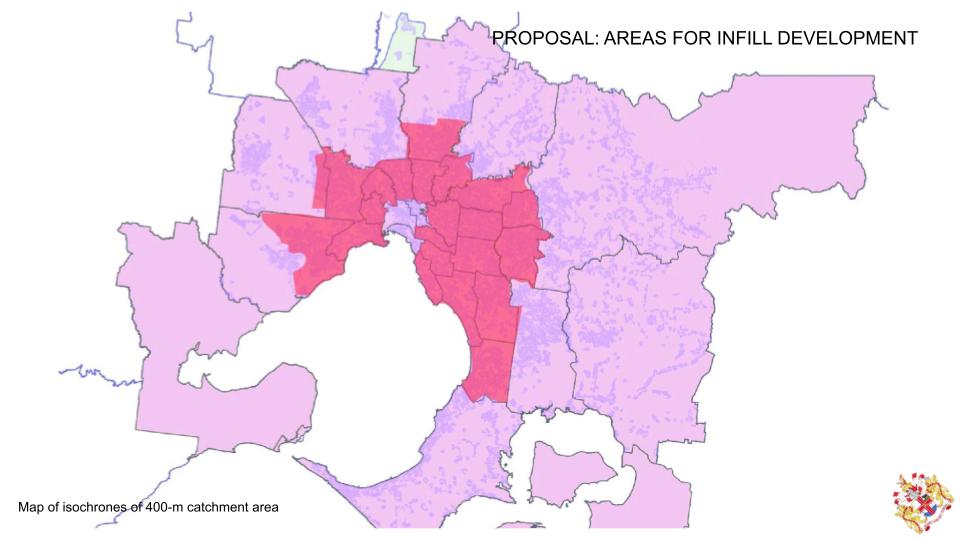
Synthesizing all analysis performed before, and using the isochrones map of transport accessibility, we could identify main focus for the infill development that actually defines the inner belt of metropolitan LGAs.
OUTCOMES
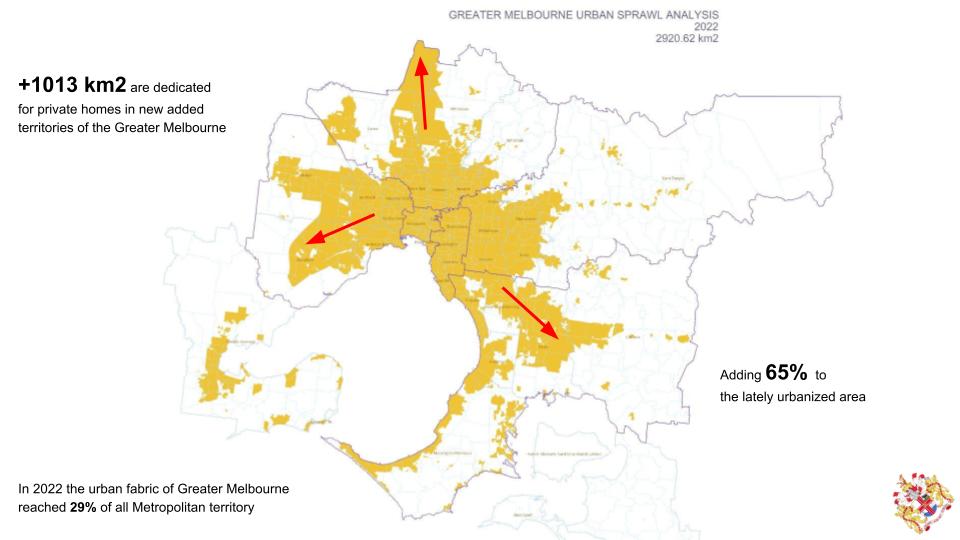
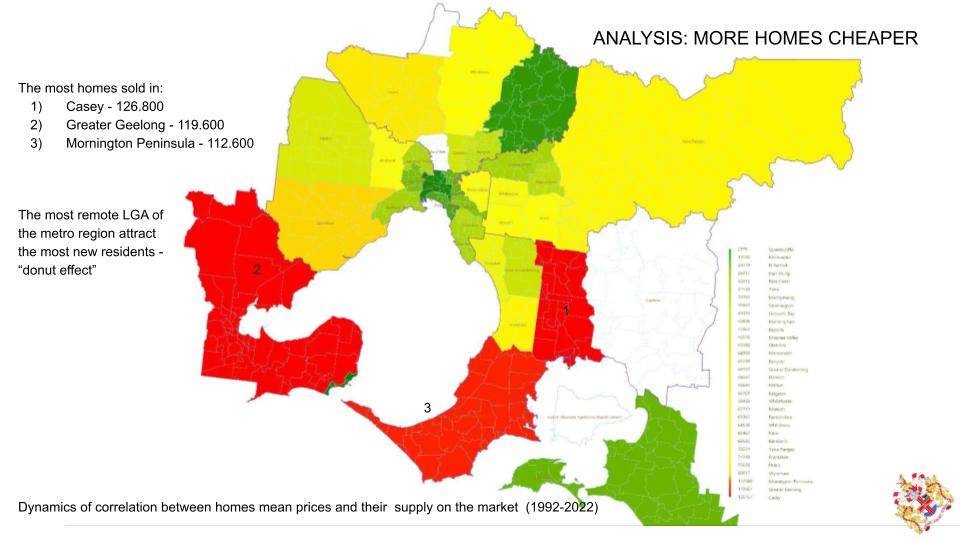
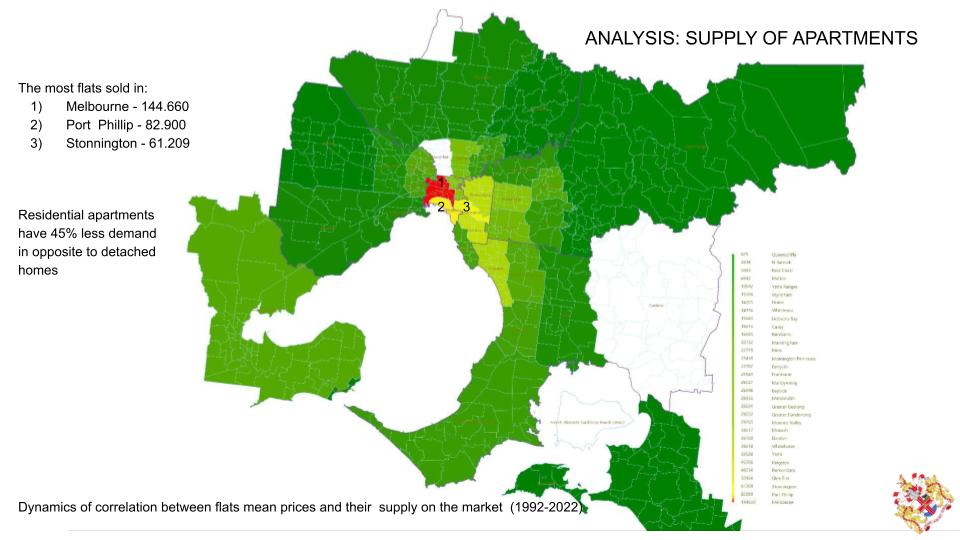
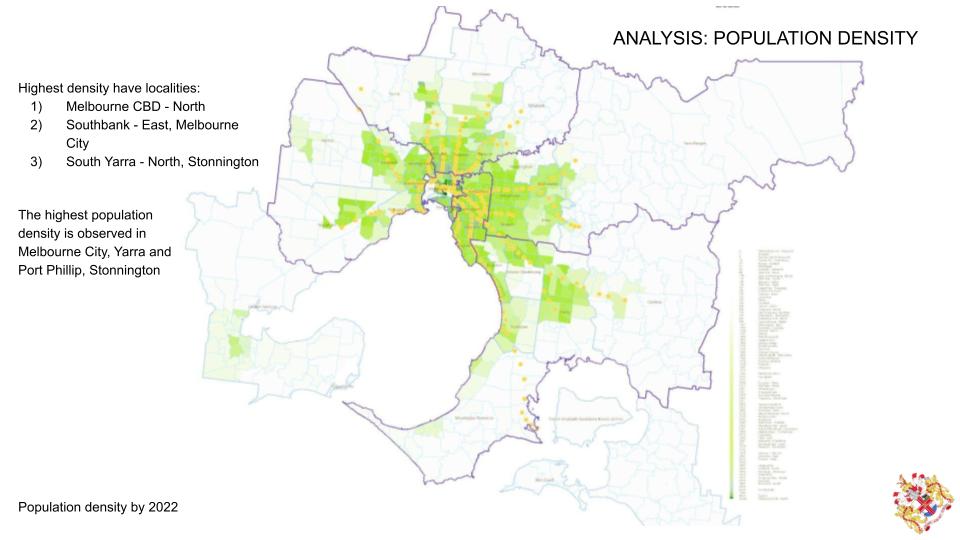
- Density correlates with the flats (apartments) market while homes construction booms on the remote perimeter of the metropolitan area.
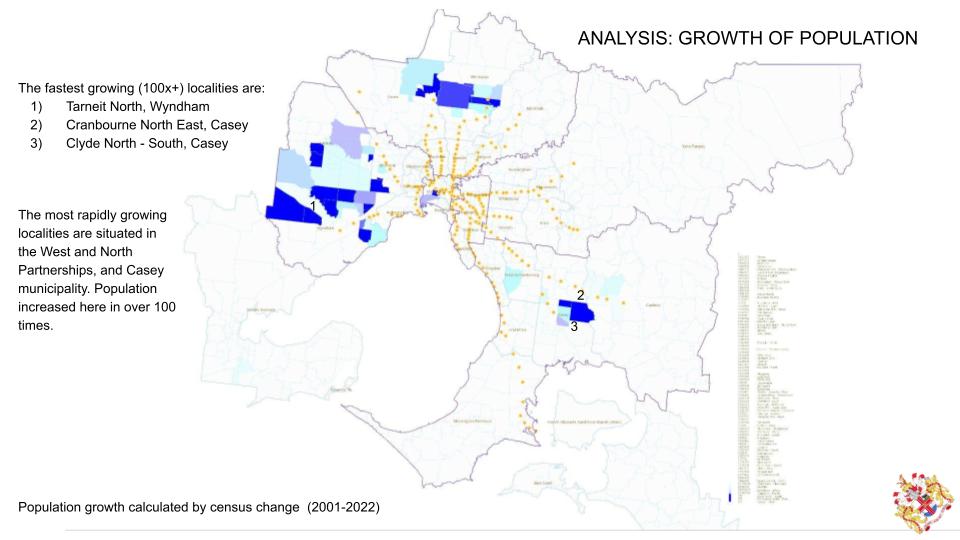
- The most actively population grows in North,West and South East remote localities fueled by low-rise development.
- 400-m catchment area of public transport has gaps in the localities with fast growing population.
- Infill development would be reasonable within the inner perimeter of metropolitan area on the edge of well developed area of public transport.
REFERENCES
The New Australian Dream: Rethinking Our Homes and Cities to Solve the Housing Crisis. 2022. Sergio Famiano. https://aurorahouse.com.au/product/how-to-buy-your-own-home-in-australia/
Analysis of Urban Growth and Sprawl from Remote Sensing Data. 2010. Springer. Dr. Basudeb Bhatta. DOI 10.1007/978-3-642-05299-6.
Monitoring Urban Sprawl Using Time-Series Data: Famagusta Region of Northern Cyprus. 2021. Sage Journals. Kamyar Fuladlu, Müge Riza, Mustafa Ilkan. https://doi.org/10.1177/21582440211007465
How is Melbourne’s population density changing? (2006-2016). article in Charting Transport journal, 2017. https://chartingtransport.com/2017/07/09/how-is-melbournes-population-density-changing-2006-2016/
Urban Calculator toolset by the Spatial Morphology Group from Chalmers Institute of Technology. https://www.smog.chalmers.se/urbancalculator
