
Abstract
NeuroSpace is a browser-based parametric design tool that reframes Building Information Modeling as Behavior Information Modeling — encoding predicted neurophysiological outcomes into architectural geometry. This post traces the full data pipeline: from seven UI sliders through a dual-path architecture (server-side Rhino.Compute for 3D geometry, client-side JavaScript for real-time NeuroScore calculation), through reactive state management with Vue 3 and Pinia, to multi-modal output including hypothesis cards, radar charts, and an SVG brain map. Grounded in architectural neuroimmunology research, the project serves as a case study in managing heterogeneous data — numeric parameters, binary geometry files, weighted formulas, and qualitative research — within a single coherent system designed for real-time feedback.
1. Introduction: What If Your Building Could Think About You?
Here is a thought experiment. You are sitting in a room right now. The ceiling is probably around 2.5 meters above your head. The walls might be flat, white, at right angles. There may or may not be a window nearby. None of these things feel like decisions — they feel like defaults. But what if I told you that every one of those defaults is silently shaping your cortisol levels, your circadian rhythm, and the load on your visual cortex?
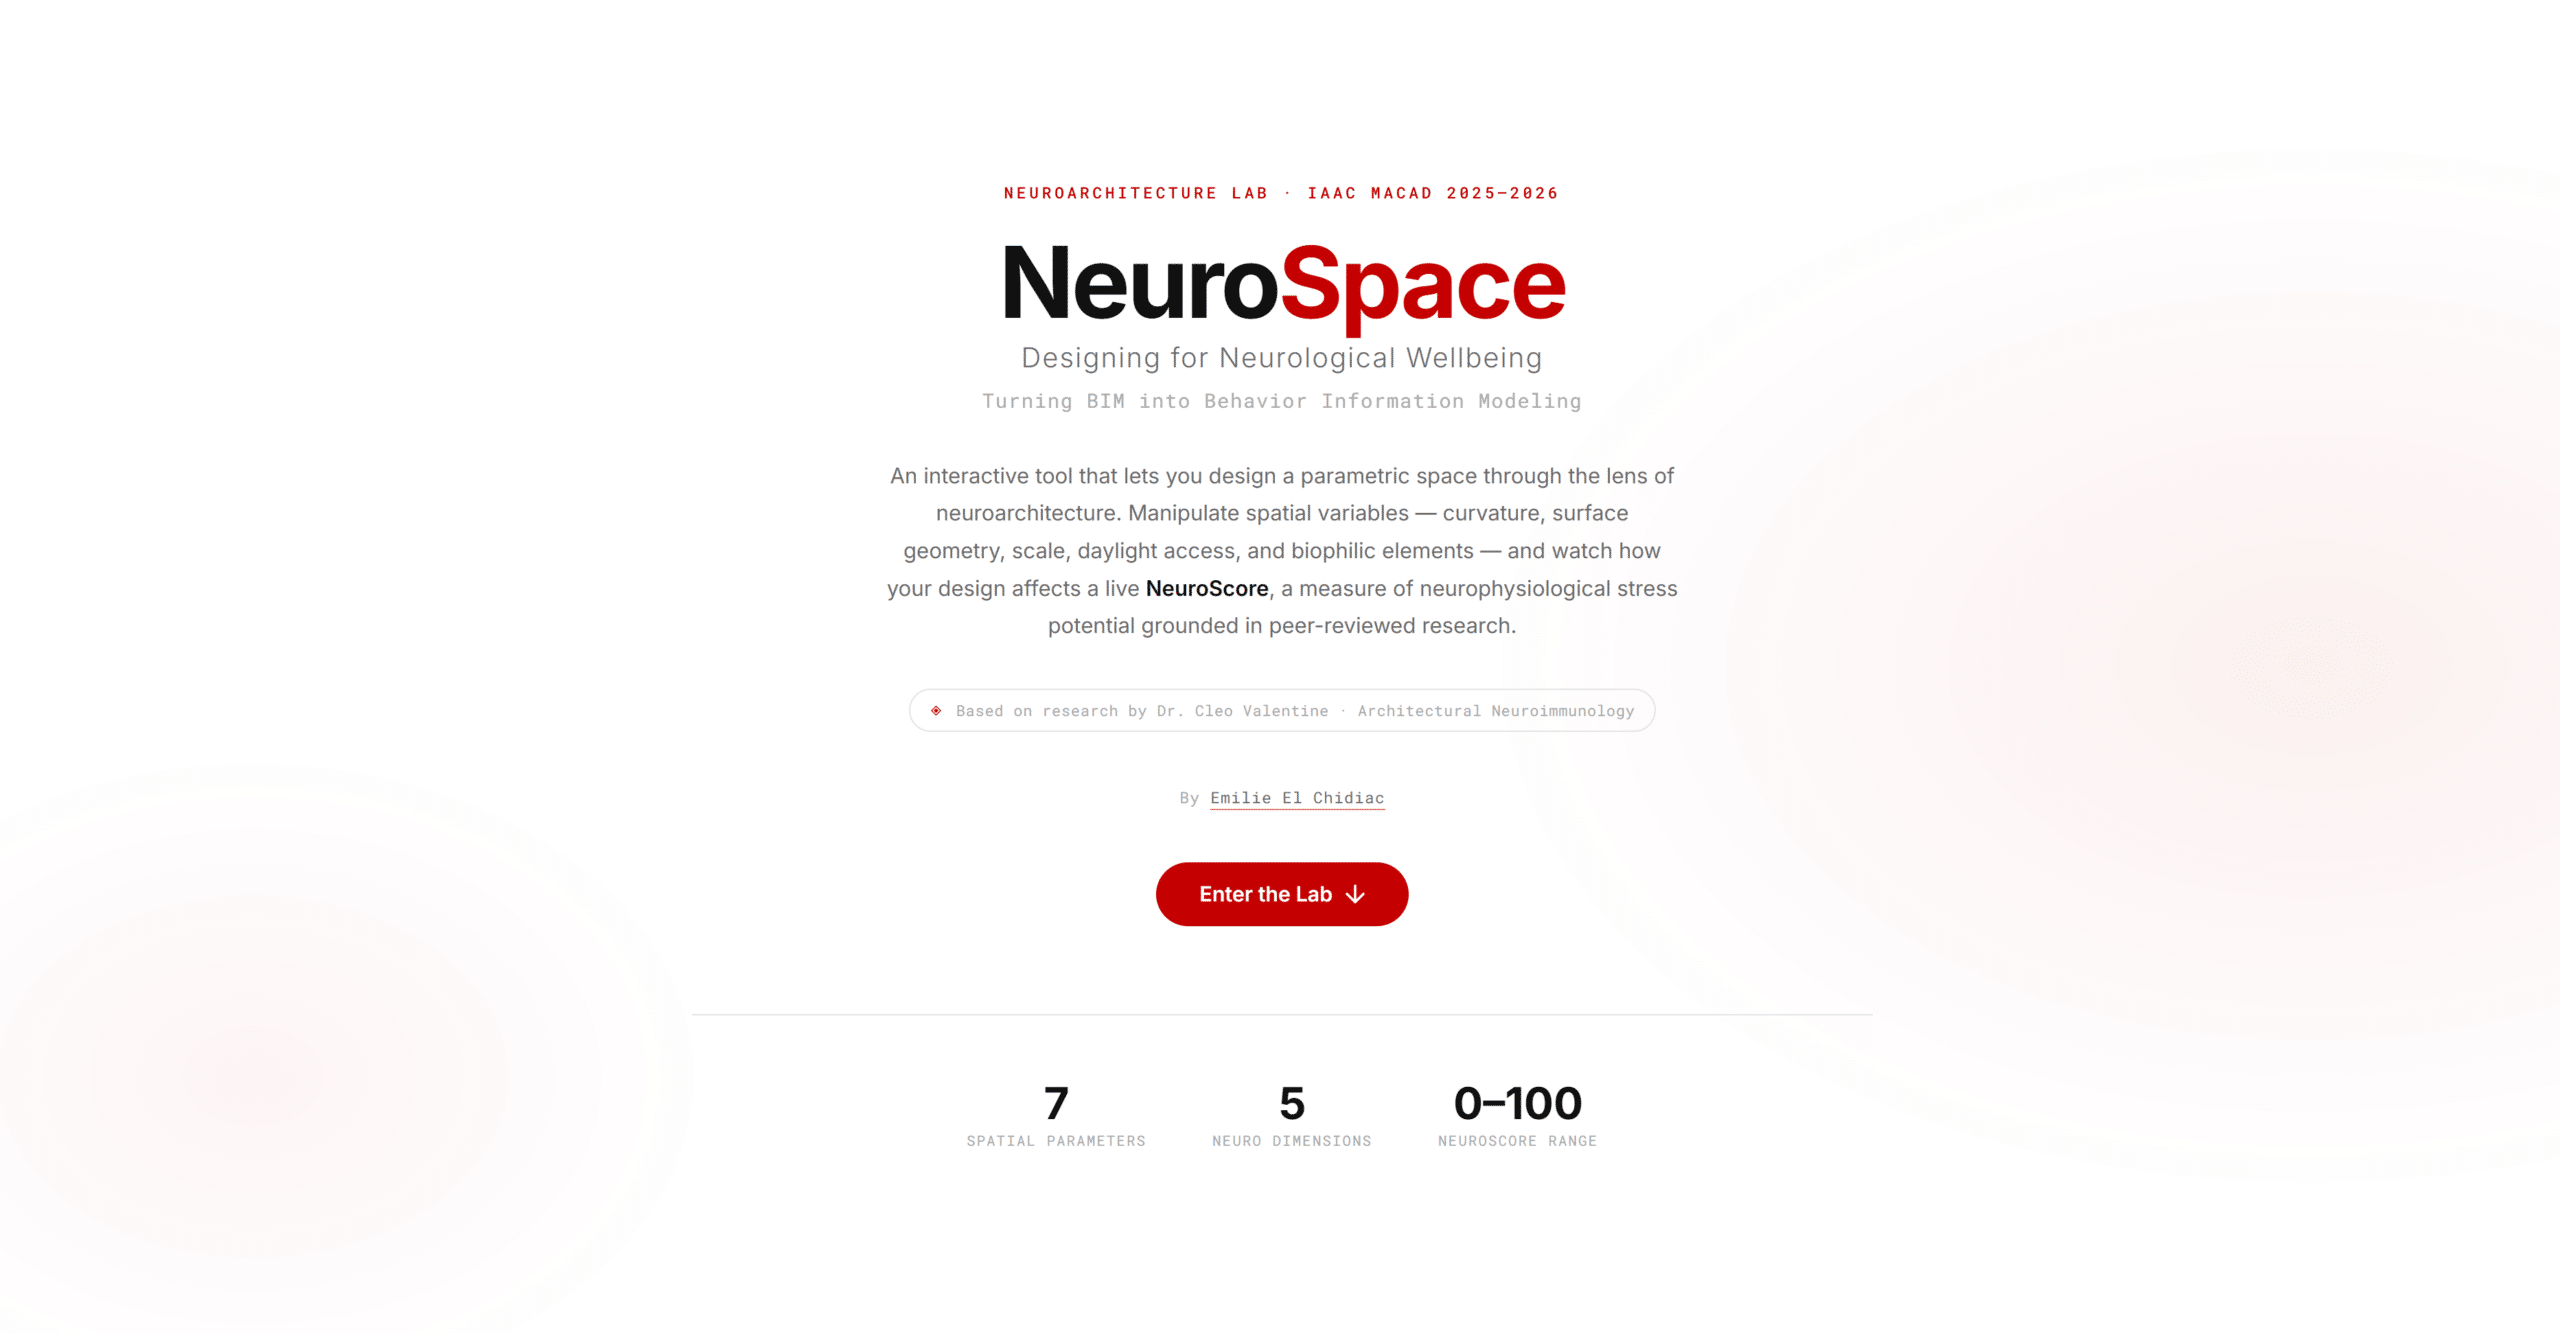
That is the premise behind NeuroSpace, an interactive browser-based design tool I built for the IAAC MaCAD Neuroarchitecture Lab. The app lets you manipulate a parametric architectural space in real time and receive instant feedback on how your design choices would affect the neurological and physiological wellbeing of its occupants. It is grounded in research from the field of architectural neuroimmunology — specifically, the work of Dr. Cleo Valentine at HKS, the University of Cambridge, and the UCL/RISE Centre for NeuroArchitecture.
But this blog post is not about the neuroscience. It is about the data. Specifically: how does a slider value on a webpage become a neurological hypothesis, a 3D geometry, and a behavioral score — all at the same time? How do you architect a pipeline that is fast enough for real-time design feedback, rigorous enough to ground itself in research, and legible enough to teach someone why their room might be stressing them out?
If you are in a data management course and wondering why you should care about parametric architecture, the answer is this: NeuroSpace is a case study in how heterogeneous data — numeric parameters, binary geometry files, mathematical formulas, and qualitative research — can be unified into a single, coherent pipeline that transforms raw inputs into actionable insights. That is a data management problem. The architecture just makes it more interesting.
2. The Concept: Behavior Information Modeling
In the AEC (Architecture, Engineering, Construction) industry, BIM stands for Building Information Modeling. It is the practice of encoding a building’s geometry, materials, cost estimates, and construction schedules into a shared digital model. BIM is powerful, but it has a blind spot: it models the building, not the human inside it.
NeuroSpace proposes a deliberate reframe: Behavior Information Modeling. Instead of just storing geometric and material data, the model encodes predicted human behavioral and neurophysiological outcomes. The “information” in BIM stops being about rebar quantities and starts being about whether your ceiling height is likely to elevate cortisol.
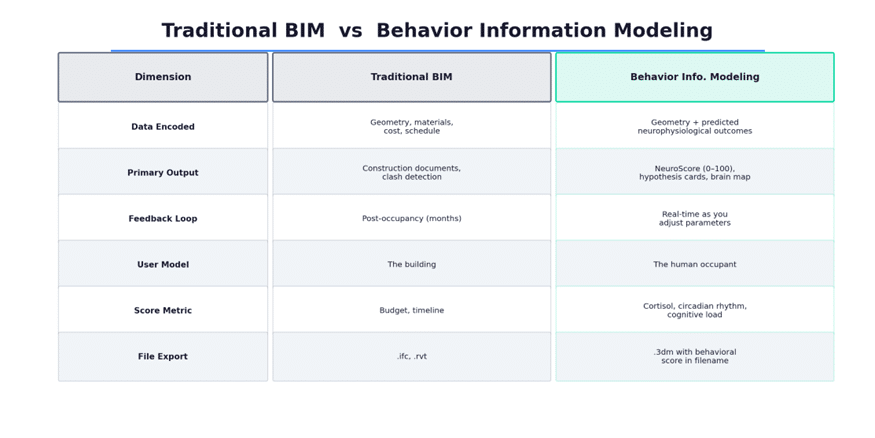
Figure 1: Traditional BIM vs. Behavior Information Modeling — a reframe of what building data can encode.
This is not anti-BIM. It is BIM with an expanded definition of what constitutes useful building data. The app still exports a .3dm Rhino file — but the filename encodes the NeuroScore, making the behavioral metadata travel with the geometry.
3. The Data Pipeline: Architecture and Flow
The central design challenge of NeuroSpace is that two very different kinds of computation need to happen simultaneously when a user moves a slider. On one hand, the parametric 3D geometry needs to be recalculated and rendered. On the other, a neurological score needs to be derived from the exact same input values. These two paths have fundamentally different latency profiles, and the architecture had to accommodate both.
3.1 The Dual-Path Architecture
When a user adjusts any of the seven spatial parameters, the Vue 3 reactive state updates immediately. From there, the data forks into two parallel paths:
Path A — Geometry (server roundtrip): The slider values are packaged as Grasshopper DataTrees and sent to a Rhino.Compute server running on localhost:6500. The server evaluates the Grasshopper definition and returns geometry, which is decoded by rhino3dm.js (a WebAssembly module) and rendered by Three.js in the browser viewport.
Path B — NeuroScore (client-side): The same slider values are fed into a purely mathematical formula running in JavaScript. No server roundtrip required. The score updates instantaneously.
This split is deliberate. The geometry computation is heavy — it requires evaluating a parametric Grasshopper definition that generates complex curved surfaces, openings, and structural elements. That needs a dedicated compute server. But the score is lightweight arithmetic. Coupling it to the server would introduce unnecessary latency into the most important feedback signal in the app.
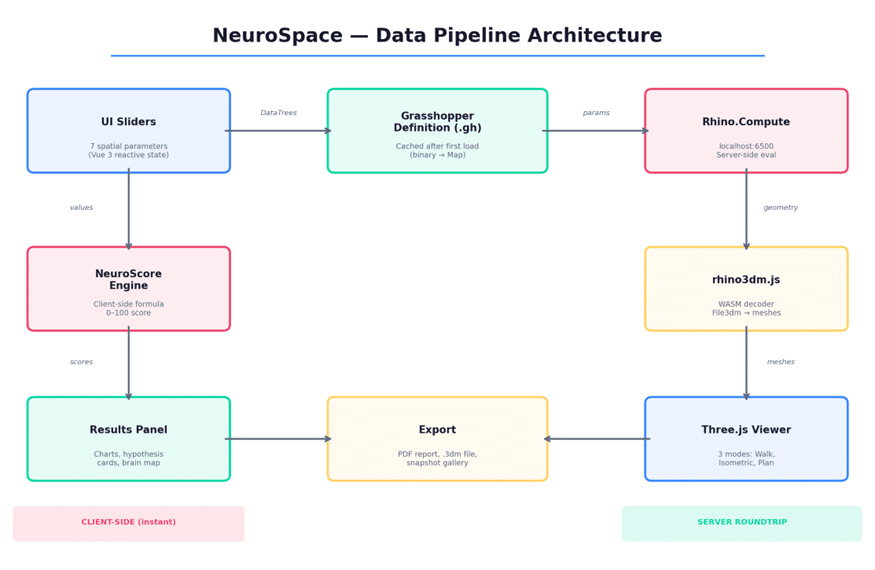
Figure 2: The dual-path data pipeline — geometry flows through the server, scoring stays client-side.
3.2 Caching Strategy
The Grasshopper definition (.gh file) is a binary blob that the frontend needs to send with every compute request. Downloading it on every slider change would be wasteful. Instead, the app caches the definition in a JavaScript Map after the first load. Subsequent compute calls send only the parameter values, not the full definition binary. This reduces payload size dramatically and keeps the interaction loop tight.
This is a textbook data management pattern: separate the schema (the .gh definition) from the data (the parameter values), cache the schema, and transmit only the data. The same principle applies in database query optimization, where prepared statements cache the execution plan and only bind new parameter values.
3.3 State Management with Pinia
All reactive state lives in a Pinia store — Vue’s recommended state management library. The slider values are the single source of truth. Every downstream computation — the Grasshopper parameters, the NeuroScore, the hypothesis card text, the chart data — is a derived computed property. There is no duplicated state. Change a slider, and every visualization in the app recomputes from the same source. This is the core principle of reactive data management applied to a spatial design tool.
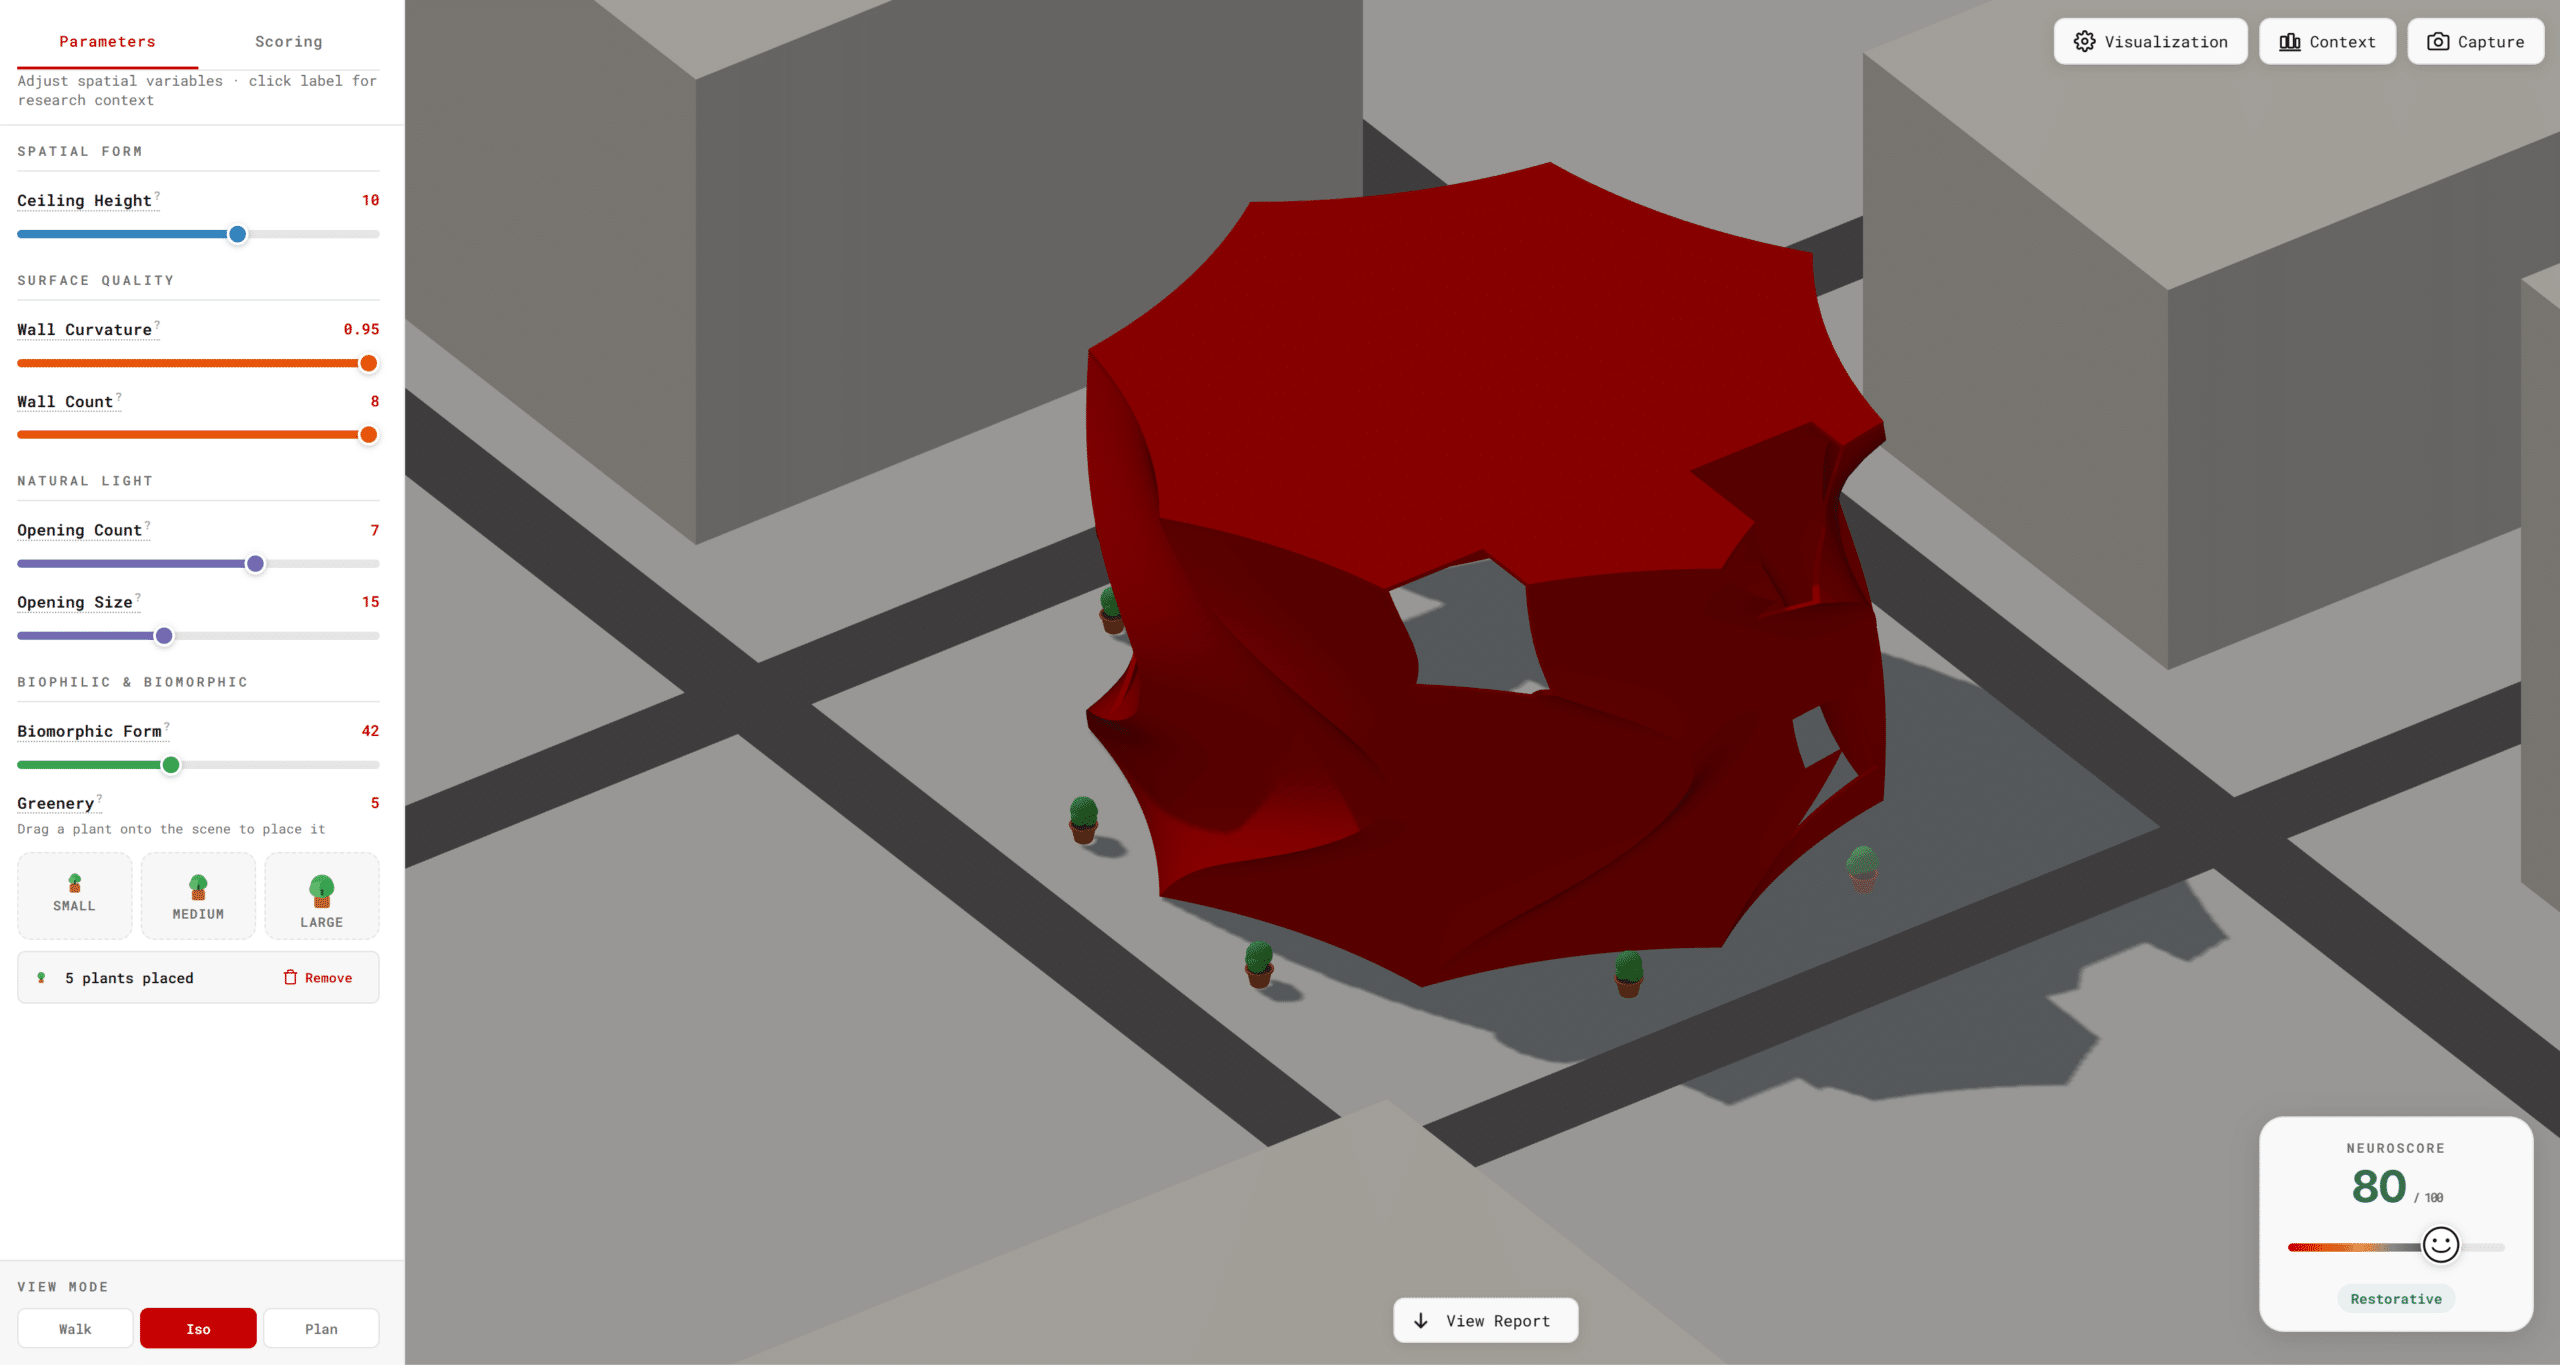
4. The Seven Spatial Parameters
Each parameter maps to a Grasshopper definition key and drives both the 3D geometry and the NeuroScore. Here is the complete input schema:
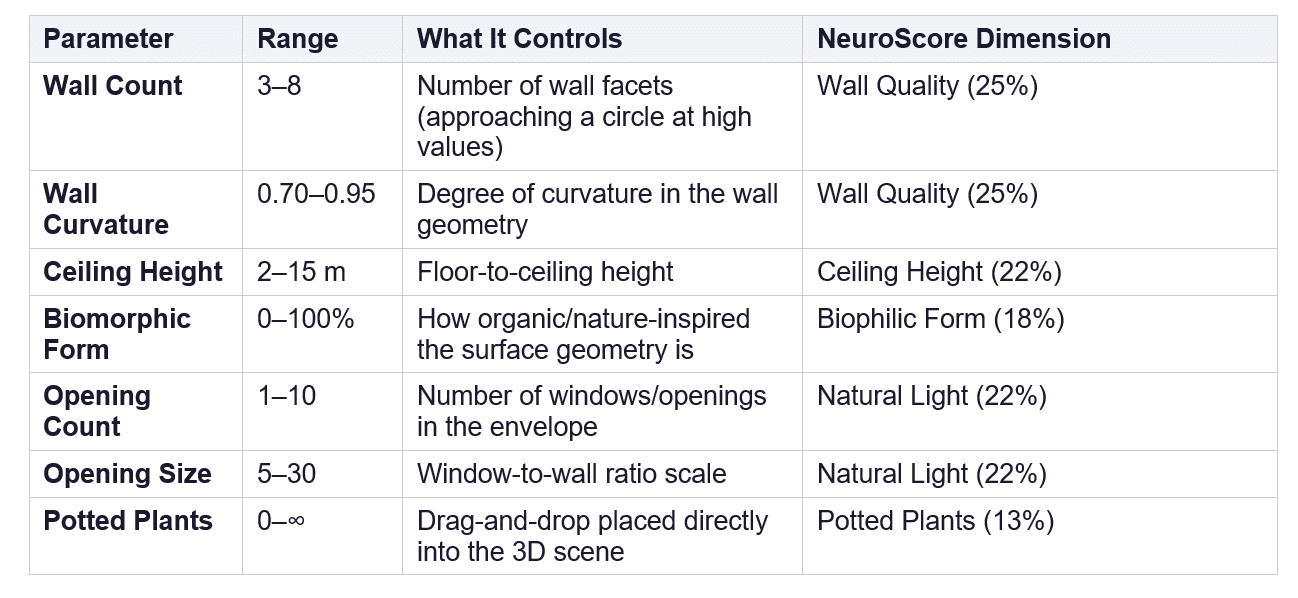
Table 1: The seven spatial parameters, their ranges, and their NeuroScore dimension mappings.
A few things worth noting about this schema. First, seven input parameters produce five score dimensions — Wall Count and Wall Curvature both feed into Wall Quality, and Opening Count and Opening Size both feed into Natural Light. This is a deliberate data aggregation step: the raw inputs are too granular to be neurologically meaningful on their own, so they are composed into higher-level dimensions that correspond to actual research constructs.
Second, the Potted Plants parameter is architecturally unique. Unlike the other six, it is not a Grasshopper parameter sent to Rhino.Compute. Plants are placed interactively in the Three.js scene via drag-and-drop and raycasting onto the ground plane. Their count is tracked in JavaScript and fed directly into the NeuroScore formula. This cleanly separates the interactive visualization layer from the parametric compute layer — a good example of choosing the right boundary between subsystems based on data dependency rather than UI convenience.
5. Computing the NeuroScore
The NeuroScore is a single integer from 0 to 100, computed in real time as parameters change. The formula is a weighted sum of five normalized dimension scores:
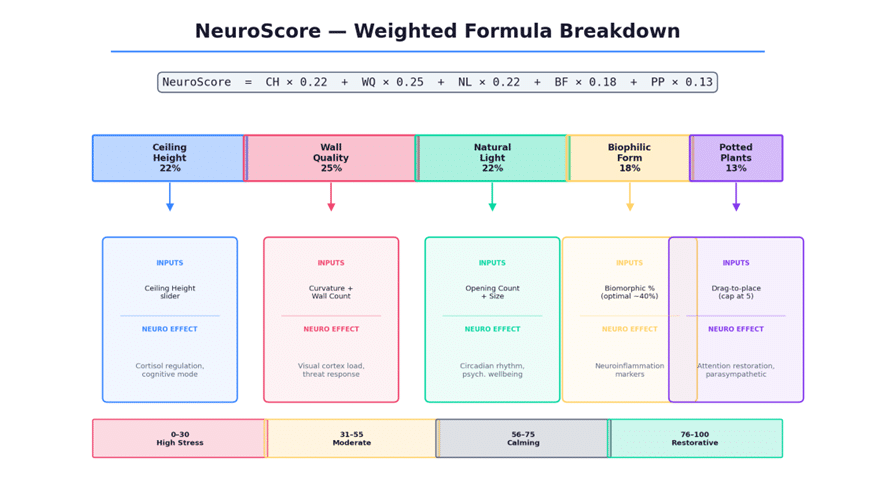
Figure 3: The NeuroScore formula — five dimensions, weighted by neurological significance, mapped to four qualitative tiers.
5.1 Normalization
Each of the seven raw parameters is first normalized to a 0–1 range based on its min/max bounds. This is standard feature scaling — the same technique used in machine learning preprocessing — and it ensures that parameters with different units (meters, percentages, counts) contribute proportionally to the score.
5.2 Weighting
The weights are not arbitrary. They reflect the relative neurological significance suggested by the research literature. Wall Quality carries the highest weight (25%) because angular, hard-edged environments activate the brain’s threat-response circuits most aggressively. Potted Plants carry the lowest (13%) because their effect, while real, reaches diminishing returns quickly — the score caps at 5 plants.
5.3 Non-Linearity: The Biophilic Form Curve
Most parameters have a monotonic relationship with their score: more ceiling height is better, more natural light is better. Biophilic Form is the exception. The research suggests an optimal zone around 40% — too little organic geometry has no measurable effect, but too much (above 60%) creates visual coherence loss and increases cognitive load. The scoring function is shaped as a bell curve that penalizes both extremes. This is the most nuanced parameter in the model, and it creates a genuinely interesting design tension: you cannot simply max everything out and expect the best score.
5.4 Qualitative Mapping
The numeric score maps to four qualitative tiers: High Stress Potential (0–30), Moderate Stress Potential (31–55), Calming (56–75), and Restorative (76–100). These labels are not decorative. They translate the quantitative output into language that a designer or client can act on. This is, in essence, a data communication problem — how do you make a number legible to someone who does not care about the formula?
6. The Three.js Viewer: Three Reads of the Same Data
The 3D viewer built in Three.js offers three distinct camera modes, each designed to surface different information from the same geometric dataset:
Walk Mode provides a first-person perspective with WASD movement, mouse-look, gravity, and jump physics. This is the experiential read — it simulates what it would feel like to stand inside the space. For a neuroarchitecture project, this is the most important mode, because spatial perception is inherently embodied.
Isometric Mode gives a standard orbit camera for inspecting the geometry from outside. This is the spatial read — useful for understanding proportions, seeing how openings relate to walls, and evaluating the overall form.
Plan Mode provides a top-down orthographic view with an adjustable horizontal cut plane. This is the technical read — an architectural plan section that lets you slice through the model at any height to understand the floor plate geometry.
The same Three.js scene, the same geometry data, three entirely different informational experiences. The viewer also includes a sun simulation (directional light positioned for 4 PM afternoon conditions with 2048×2048 shadow mapping) and a sky fill light for realistic ambient illumination. Materials are controlled via a visualization popover with 8 preset swatches, transparency, roughness (glossy to matte), and metalness sliders. The material system uses THREE.MeshPhysicalMaterial with clearcoat for a physically plausible look.
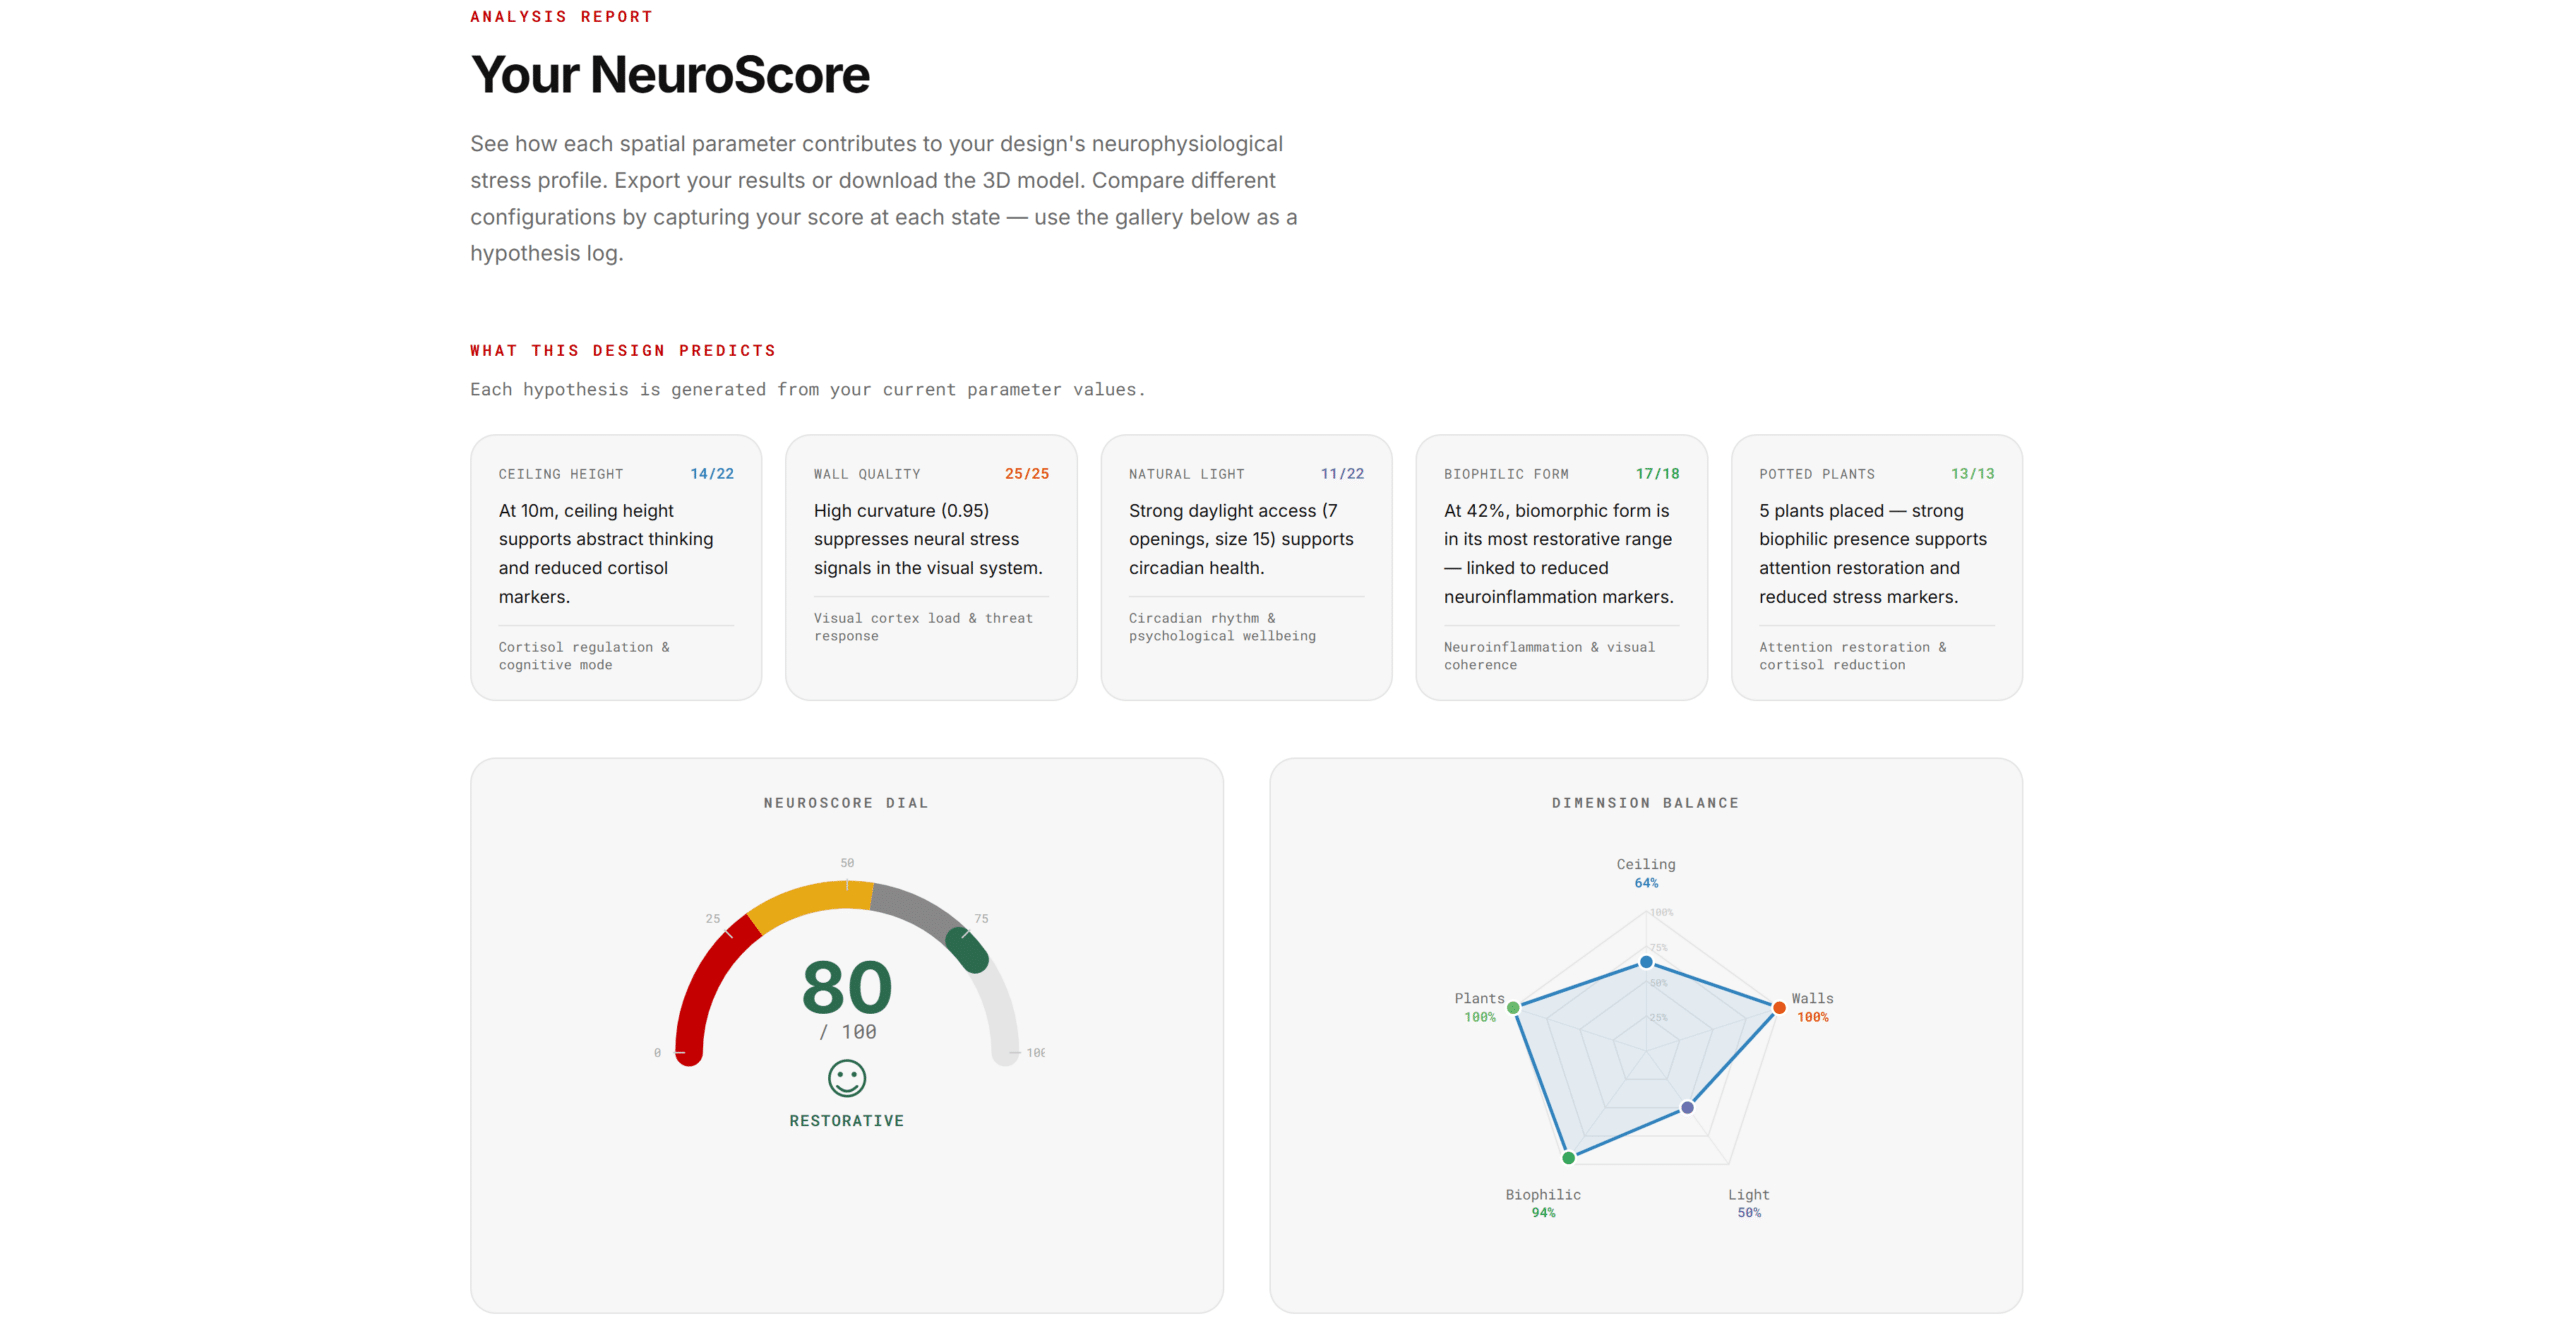
7. Results, Visualization, and Export
Below the 3D viewer, a full results panel provides seven distinct data visualizations, each designed to communicate a different facet of the NeuroScore:
Hypothesis Cards generate natural-language predictions based on current parameter values (e.g., “At 2.2 m, ceiling height may trigger containment stress and elevated cortisol”). These are the most important output for non-technical users.
A Radar Chart shows dimension balance as a pentagon, immediately revealing whether one dimension is being maximized at the expense of others.
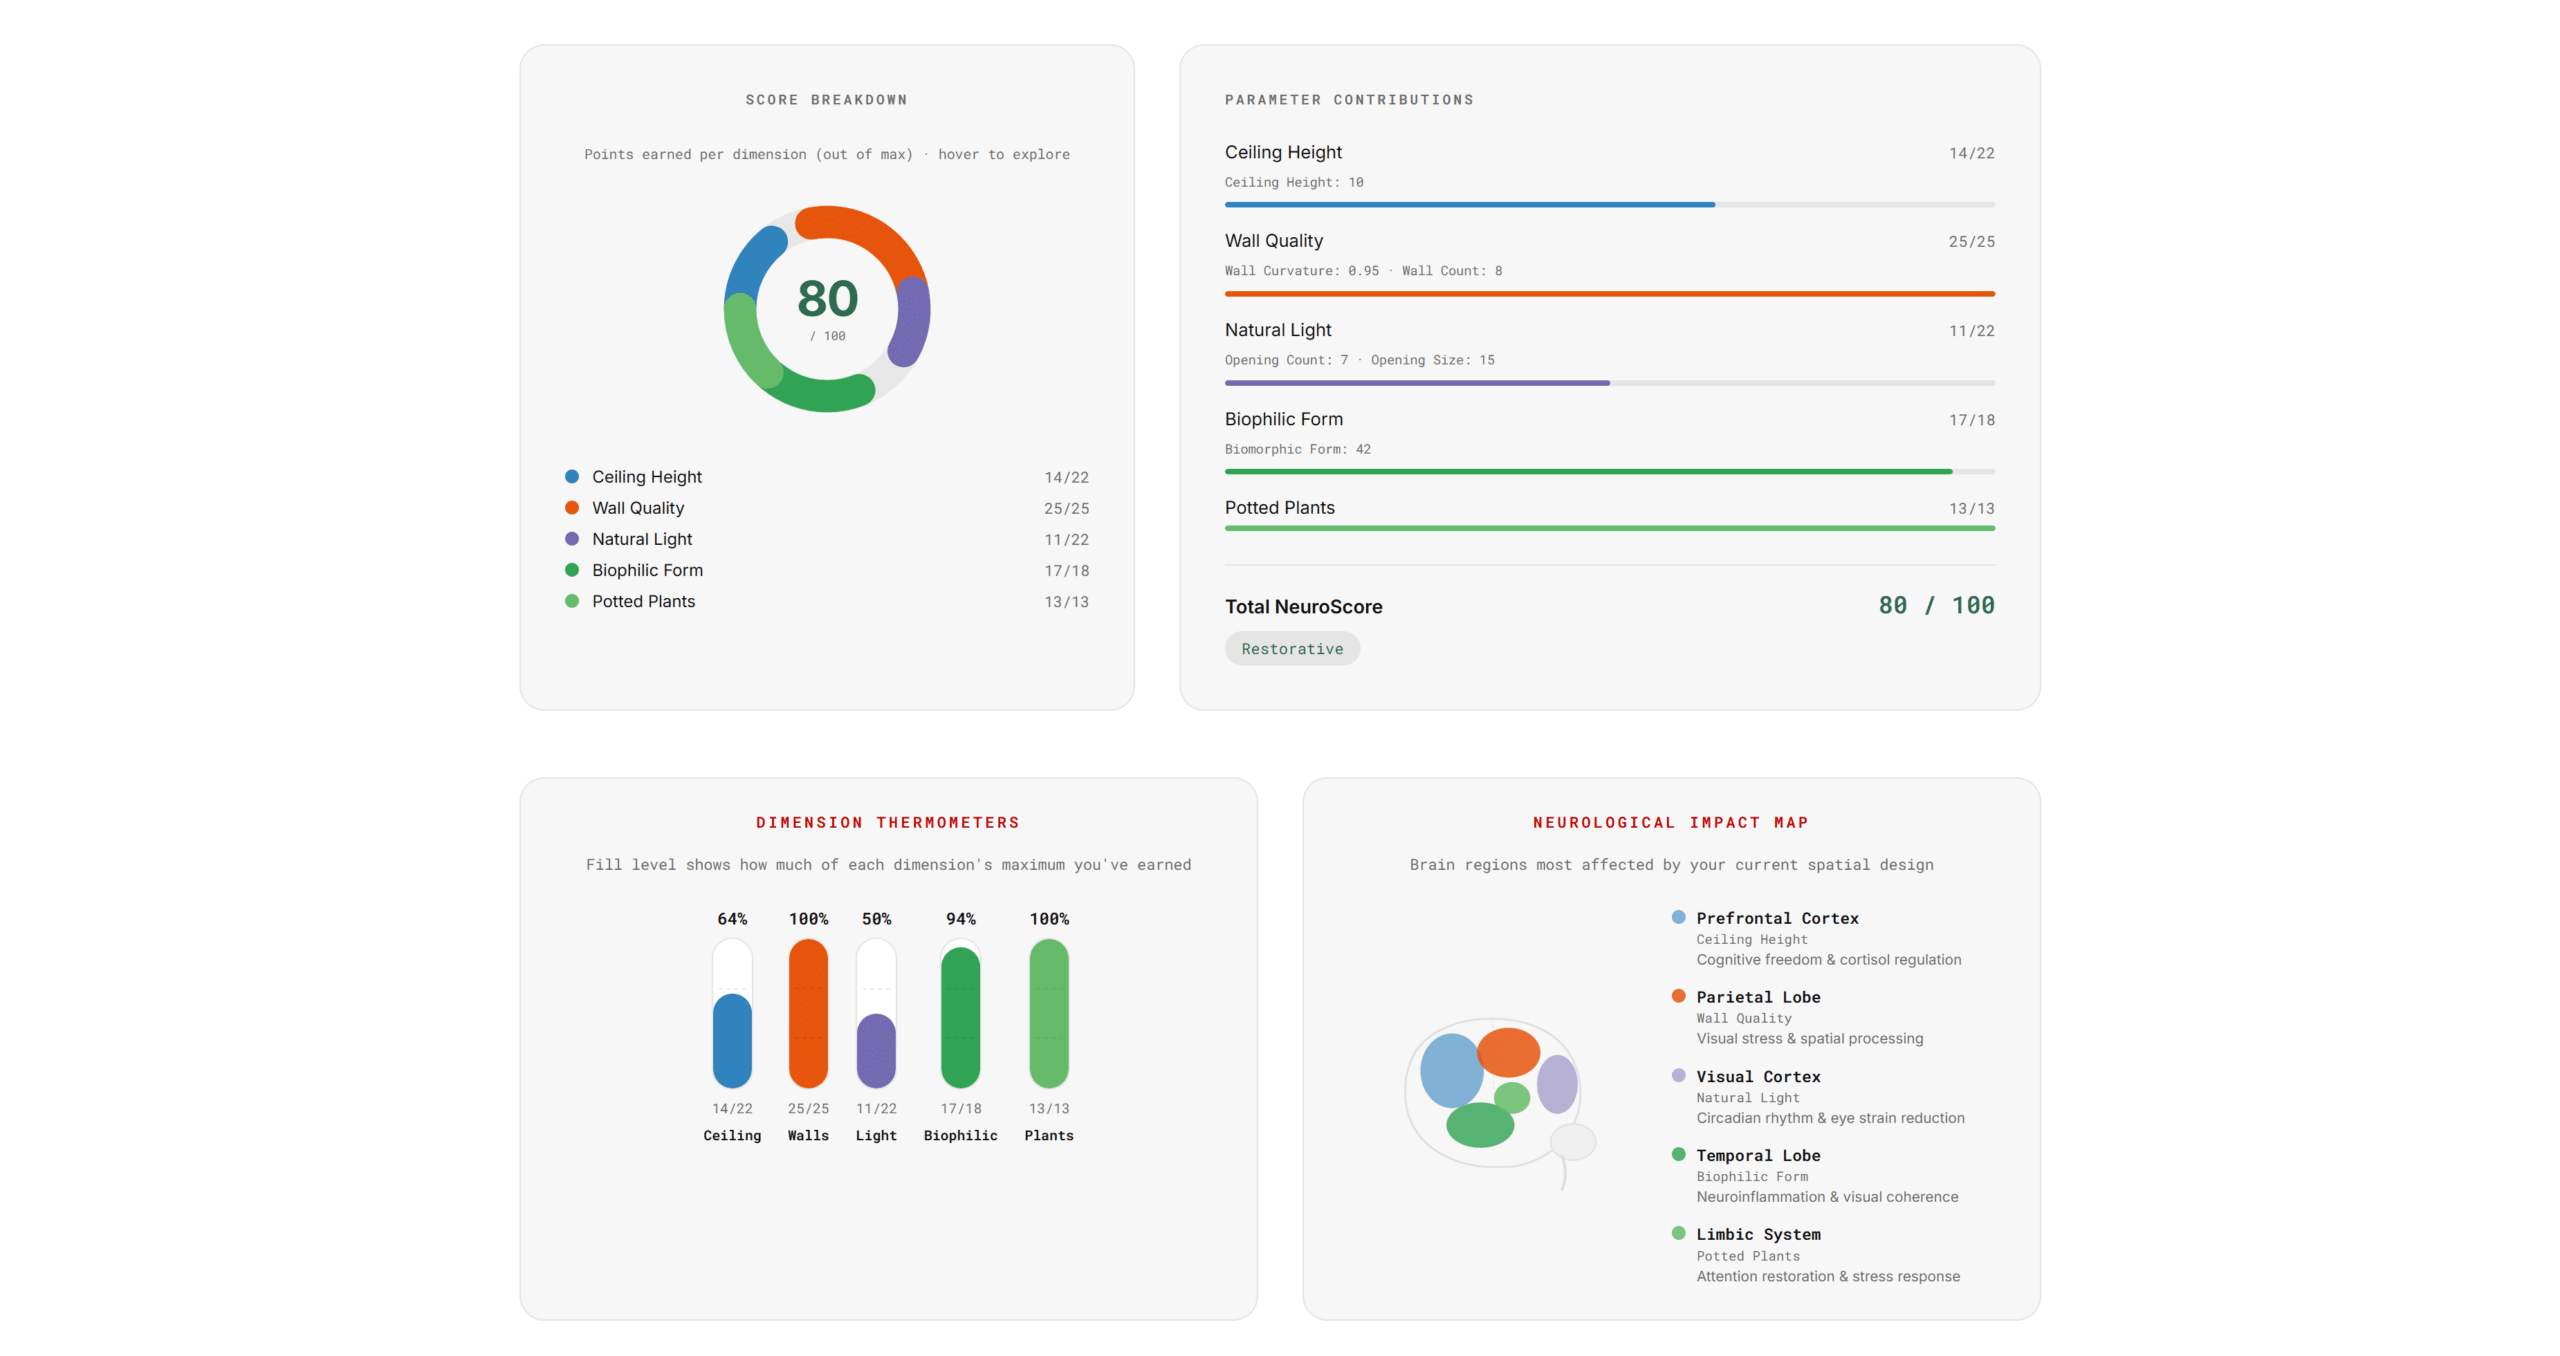
An Interactive Donut Chart breaks down the score by dimension, with hover-to-reveal detail showing earned versus maximum points and the corresponding neurological consequence.
A Brain Impact Map is an SVG schematic with five highlighted regions (Prefrontal Cortex, Parietal Lobe, Visual Cortex, Temporal Lobe, Limbic System), each with opacity proportional to its dimension score. This makes neurological impact spatial and tangible.
On the export side, the app offers three outputs: a PDF report (generated via html2canvas and jsPDF, rasterizing the full results panel into an A4 document with IAAC branding), a .3dm Rhino file of the current geometry (with the NeuroScore baked into the filename), and a snapshot gallery that captures canvas screenshots with score and timestamp metadata for comparing design hypotheses over time.
8. Lessons Learned: Data Management in Practice
Building NeuroSpace taught me several things about managing data in a real-time, multi-layered system that I suspect apply well beyond parametric architecture:
Separate compute by latency. Not everything needs the same pipeline. The NeuroScore could have been computed server-side alongside the geometry, but it did not need to be. Recognizing that the score was pure arithmetic and keeping it client-side eliminated an entire class of latency and failure-mode problems. When designing a data pipeline, always ask: does this computation actually need to live where I am putting it?
Cache the schema, transmit the data. The Grasshopper definition is the schema; the slider values are the data. Caching the binary definition after the first load and sending only parameters on subsequent calls is the same principle behind prepared statements in SQL, GraphQL persisted queries, and compiled shader programs. If your schema is stable and your data changes frequently, do not resend the schema.
Single source of truth matters more in reactive systems. With a Pinia store holding the canonical slider state and every visualization derived from it, there is zero chance of the 3D geometry showing one thing while the score says another. In a reactive framework, duplicated state is not just wasteful — it is dangerous, because the UI will faithfully render whatever you give it, even if it is contradictory.
Non-linear scoring is worth the complexity. It would have been easier to make every parameter monotonically scored (more is better). But the bell-curve on Biophilic Form — where the optimal zone is around 40% and extremes are penalized — is the most interesting design moment in the app. It teaches you that data models should reflect the actual complexity of the domain, not simplify it for engineering convenience.
Make the data legible. A score of 72 means nothing without context. The qualitative tier labels, the emoji HUD, the hypothesis cards, and the brain map all exist to solve the same problem: translating quantitative data into something a human can act on. This is not decoration. It is the last mile of data management — the step where your pipeline either changes someone’s design decision or does not.
9. Conclusion
NeuroSpace started as a question: what if you could feel the data in your building? Not look at a spreadsheet of material properties, but actually experience — in real time, in 3D, with neurological feedback — how your spatial decisions affect human wellbeing?
The answer required building a pipeline that unifies parametric geometry, neuroscience research, reactive state management, and real-time visualization into a single coherent system. The data flows from seven sliders through two parallel paths — one that speaks to a compute server in Grasshopper DataTrees and returns rendered geometry, and one that evaluates a weighted formula in the browser and returns a behavioral score. Both paths originate from the same source of truth, and both terminate in the same user experience.
For a data management course, the takeaway is this: the most interesting data pipelines are not the ones that move the most data. They are the ones that transform data across domains — from numbers to geometry, from geometry to perception, from perception to a score, from a score to a decision. NeuroSpace is a small app, but the pattern it implements — heterogeneous data, dual compute paths, reactive state, multi-modal output — is the same pattern behind any system that tries to turn raw information into human understanding.
And if your building could think about you, it would probably appreciate a few more plants.
