Multidimensionality of Time for Inclusive Urban Lives
This project explores urban inclusivity through the multidimensional lens of time, using Barcelona as a case study. The analysis considers three temporal dimensions: time of day, time of year, and time of life, recognizing how these factors shape access to essential urban amenities. Proximity serves as the first analytical layer, examining how various users’ mobility changes based on age, gender, and social roles. The second layer investigates street infrastructure, including lighting, street width, and green spaces, and how these elements influence mobility and safety. By overlapping these layers, the study identifies areas where the city’s most vulnerable residents face heightened risks due to limited accessibility and inadequate infrastructure. The findings provide valuable insights for improving urban policies to create safer and more inclusive cities.
INTRODUCTION
Exploring Urban Inclusivity Through Time
As cities grow and evolve, ensuring they are inclusive, safe, and accessible for everyone becomes a pressing challenge. Our project dives into this issue through the lens of UN Sustainable Development Goal 11, which promotes inclusive, resilient, and sustainable cities.
We chose Barcelona as our case study because of its strong urban policies, like the Barcelona Inclusion Plan and Citizen Agreement for an Inclusive Barcelona, which aim to reduce social inequalities. But how inclusive is the city in practice?
Our research focuses on how time and distance affect daily commutes, shaping access to essential urban amenities. We broke down the idea of inclusivity into three layers: the built environment (how the city’s physical structure supports access), mobility (how time and distance interact), and social factors (residents’ changing needs).
By examining how these layers overlap, we’re uncovering how Barcelona’s urban fabric affects its most vulnerable residents—and where there’s room for improvement.
Rethinking Urban Mobility Through the Lens of Time
Urban mobility is more than just moving from point A to point B. In our project, we explore how time adds complexity to this journey, affecting access to city amenities in ways that are often overlooked.
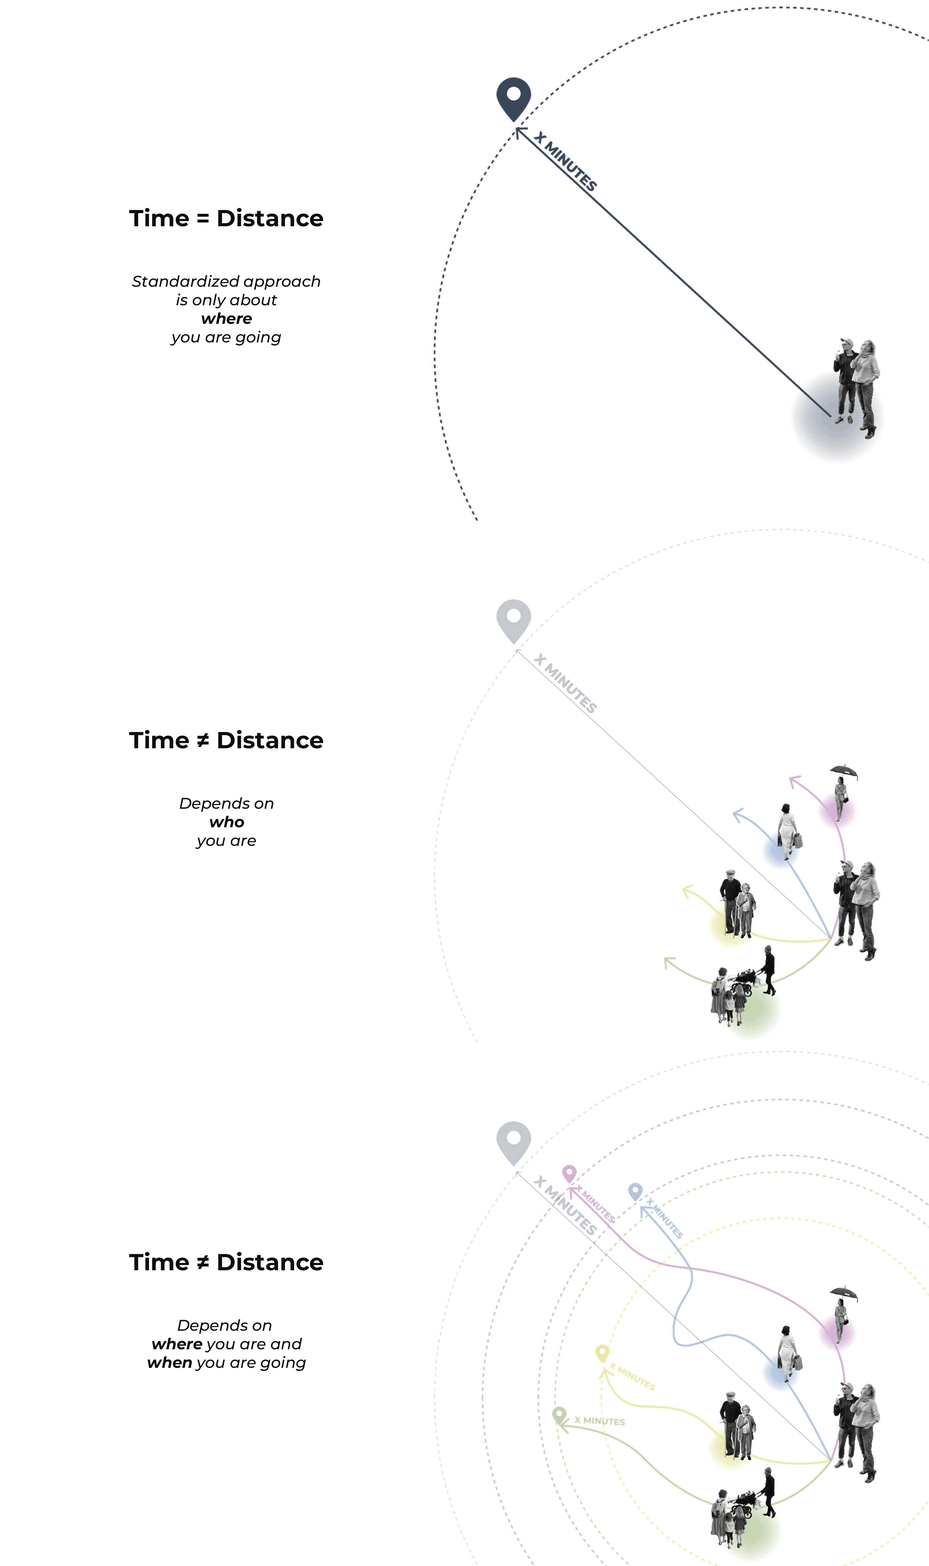
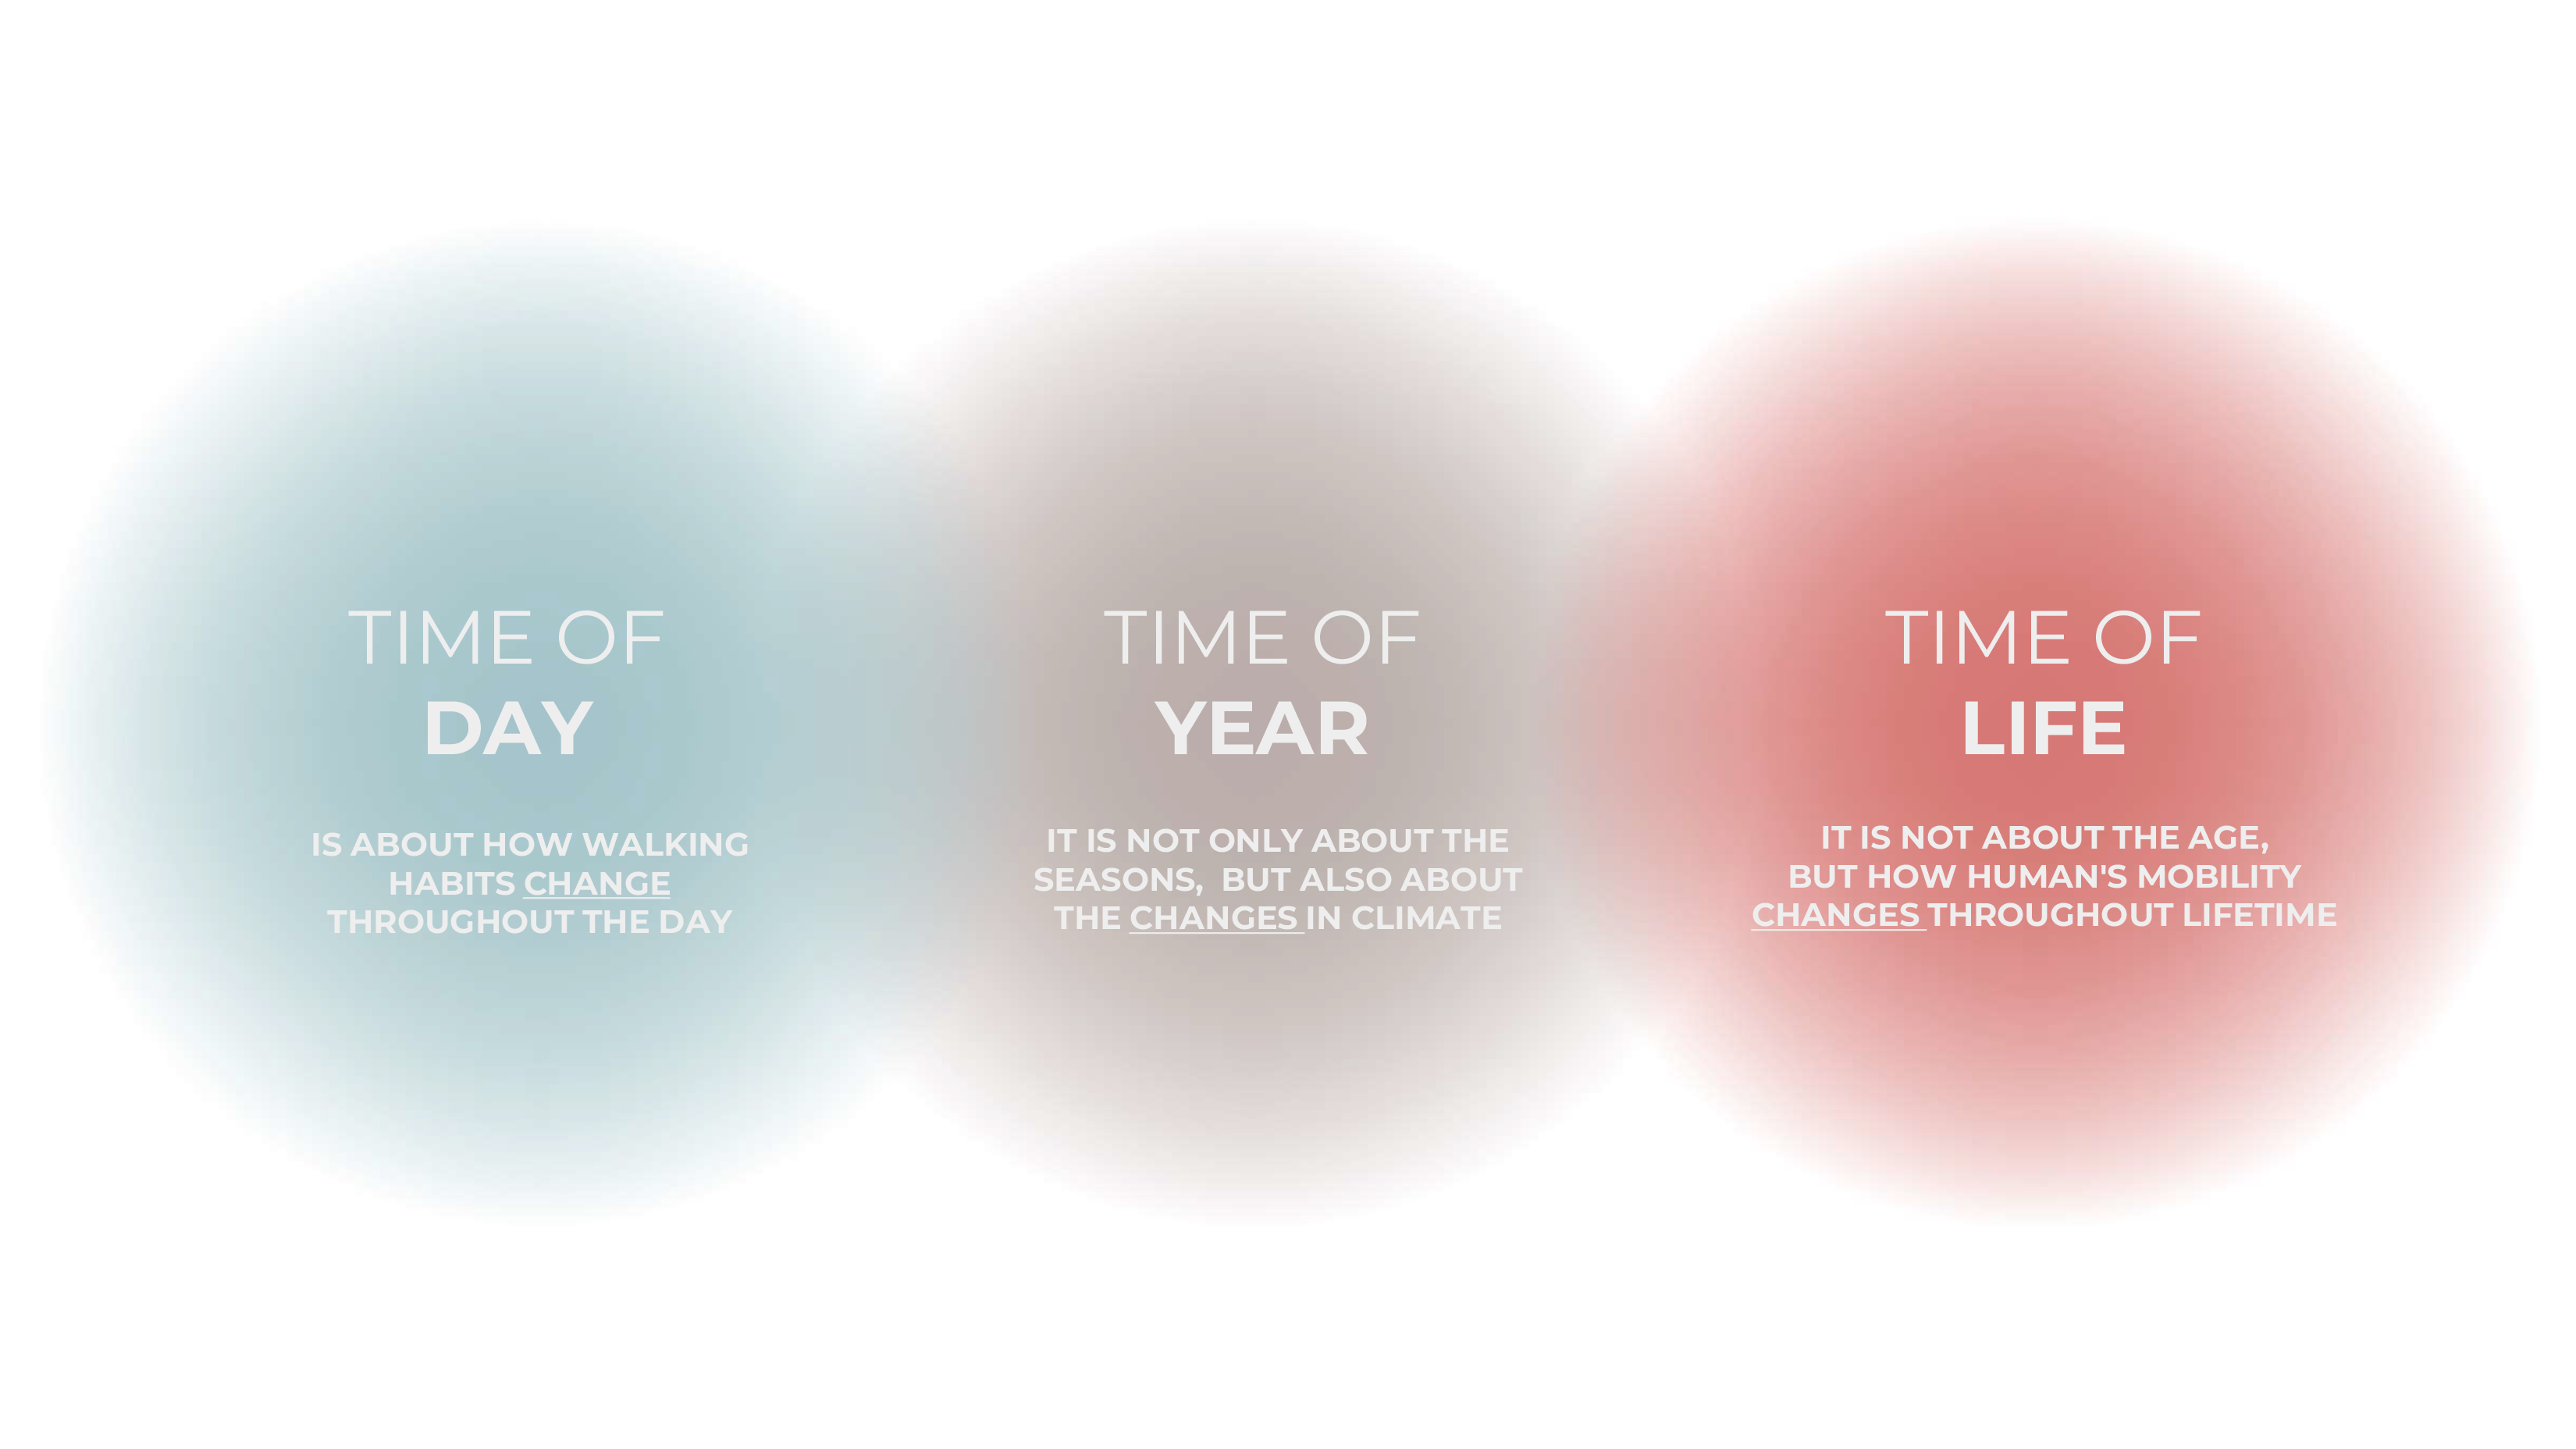
We realized that mobility is not just about distance—it’s about how time is experienced differently depending on who you are and when you’re traveling. This led us to explore the Multidimensionality of Time, focusing on three key dimensions:
• Time of Day: How mobility patterns shift from day to night, affecting safety and accessibility.
• Time of Year: Seasonal changes, weather conditions, and climate emergencies that influence mobility.
• Time of Life: How mobility needs evolve over a person’s life, from students and caregivers to retirees.
By understanding how these dimensions impact movement, we can better address the unique mobility challenges faced by different urban residents. This personalized approach helps uncover how seemingly neutral urban spaces can become barriers—or gateways—to an inclusive city experience.
CASE STUDY
Women and Urban Mobility: Hidden Inequalities in the City
As we explored mobility in Barcelona, we noticed a significant trend: women experience the city differently due to social roles, mobility patterns, and safety concerns. This realization guided the next phase of our project—understanding how gender intersects with urban mobility.

Key Findings from Barcelona’s Demographics:
• Population: Women outnumber men, especially in older age groups.
• Caregiving Roles: Women are four times more likely to be single parents and spend more time caring for family members.
• Mobility Habits: Women walk significantly more than men, making pedestrian infrastructure essential for their well-being.
• Safety Concerns: Women feel less safe, particularly at night, making urban safety a critical issue.
• Heat Vulnerability: Older women face higher risks from extreme heat due to reduced mobility and lower heat tolerance.
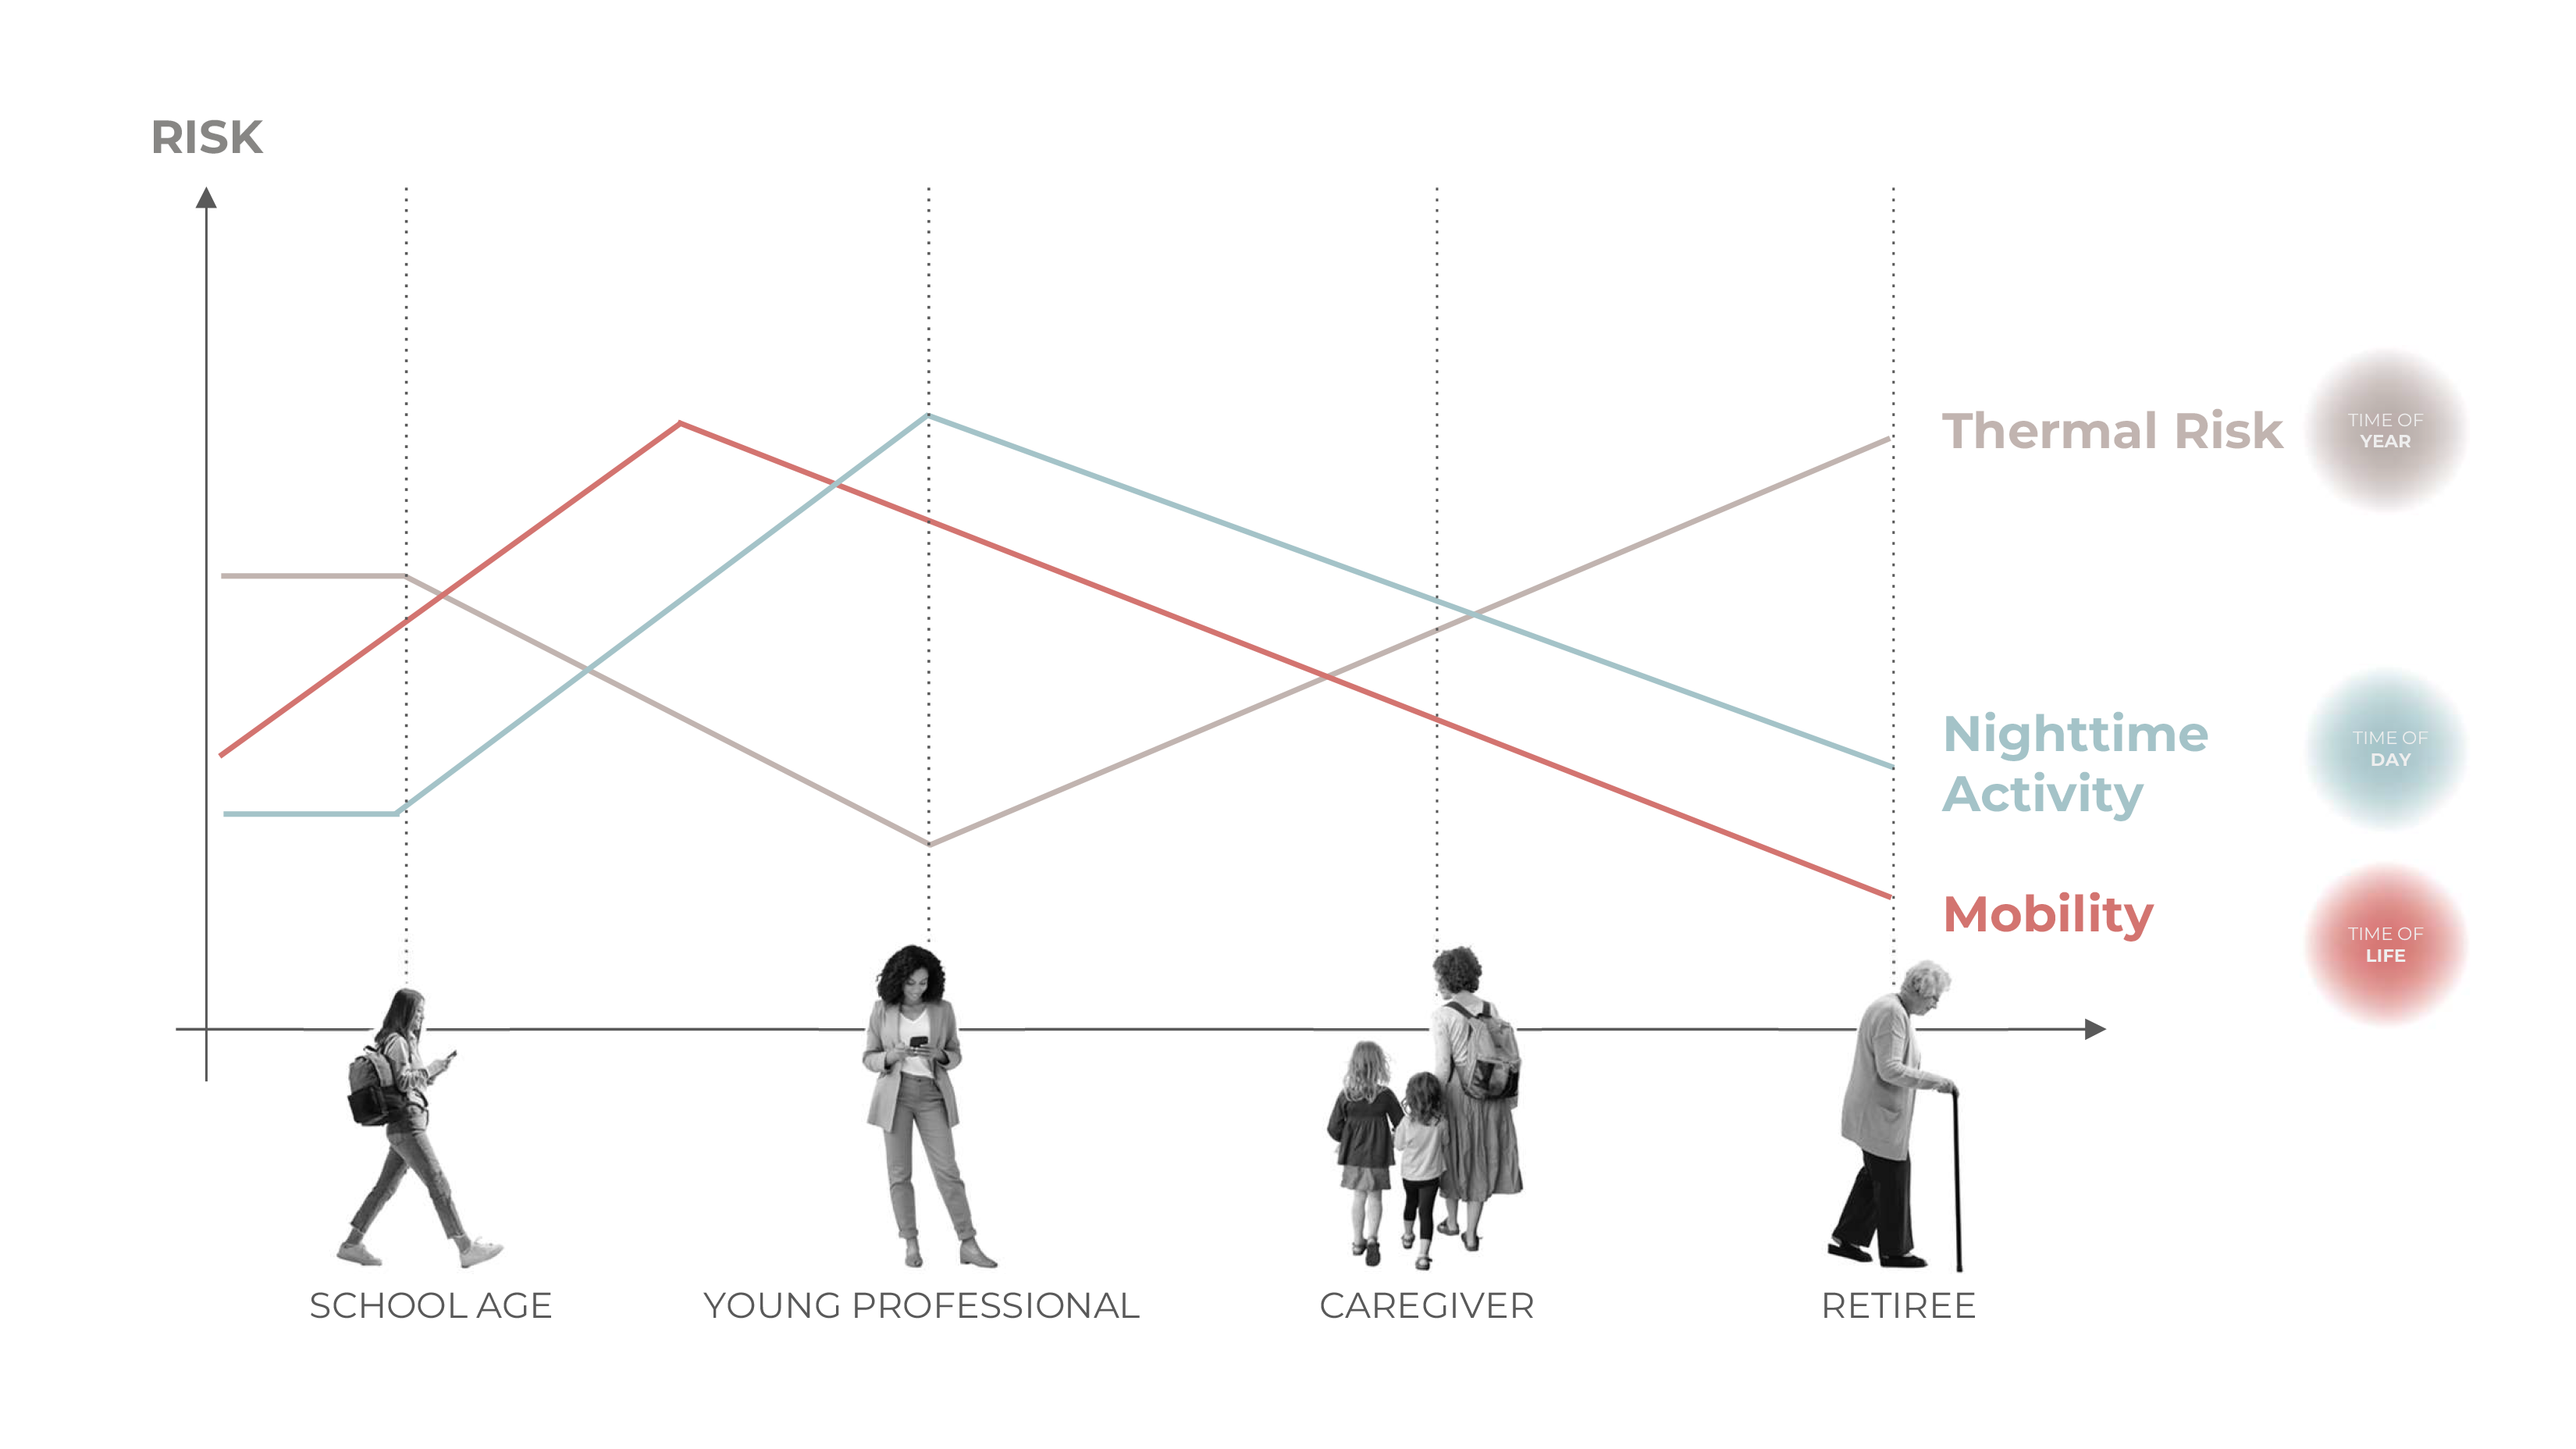
Two Scenarios of Urban Vulnerability:
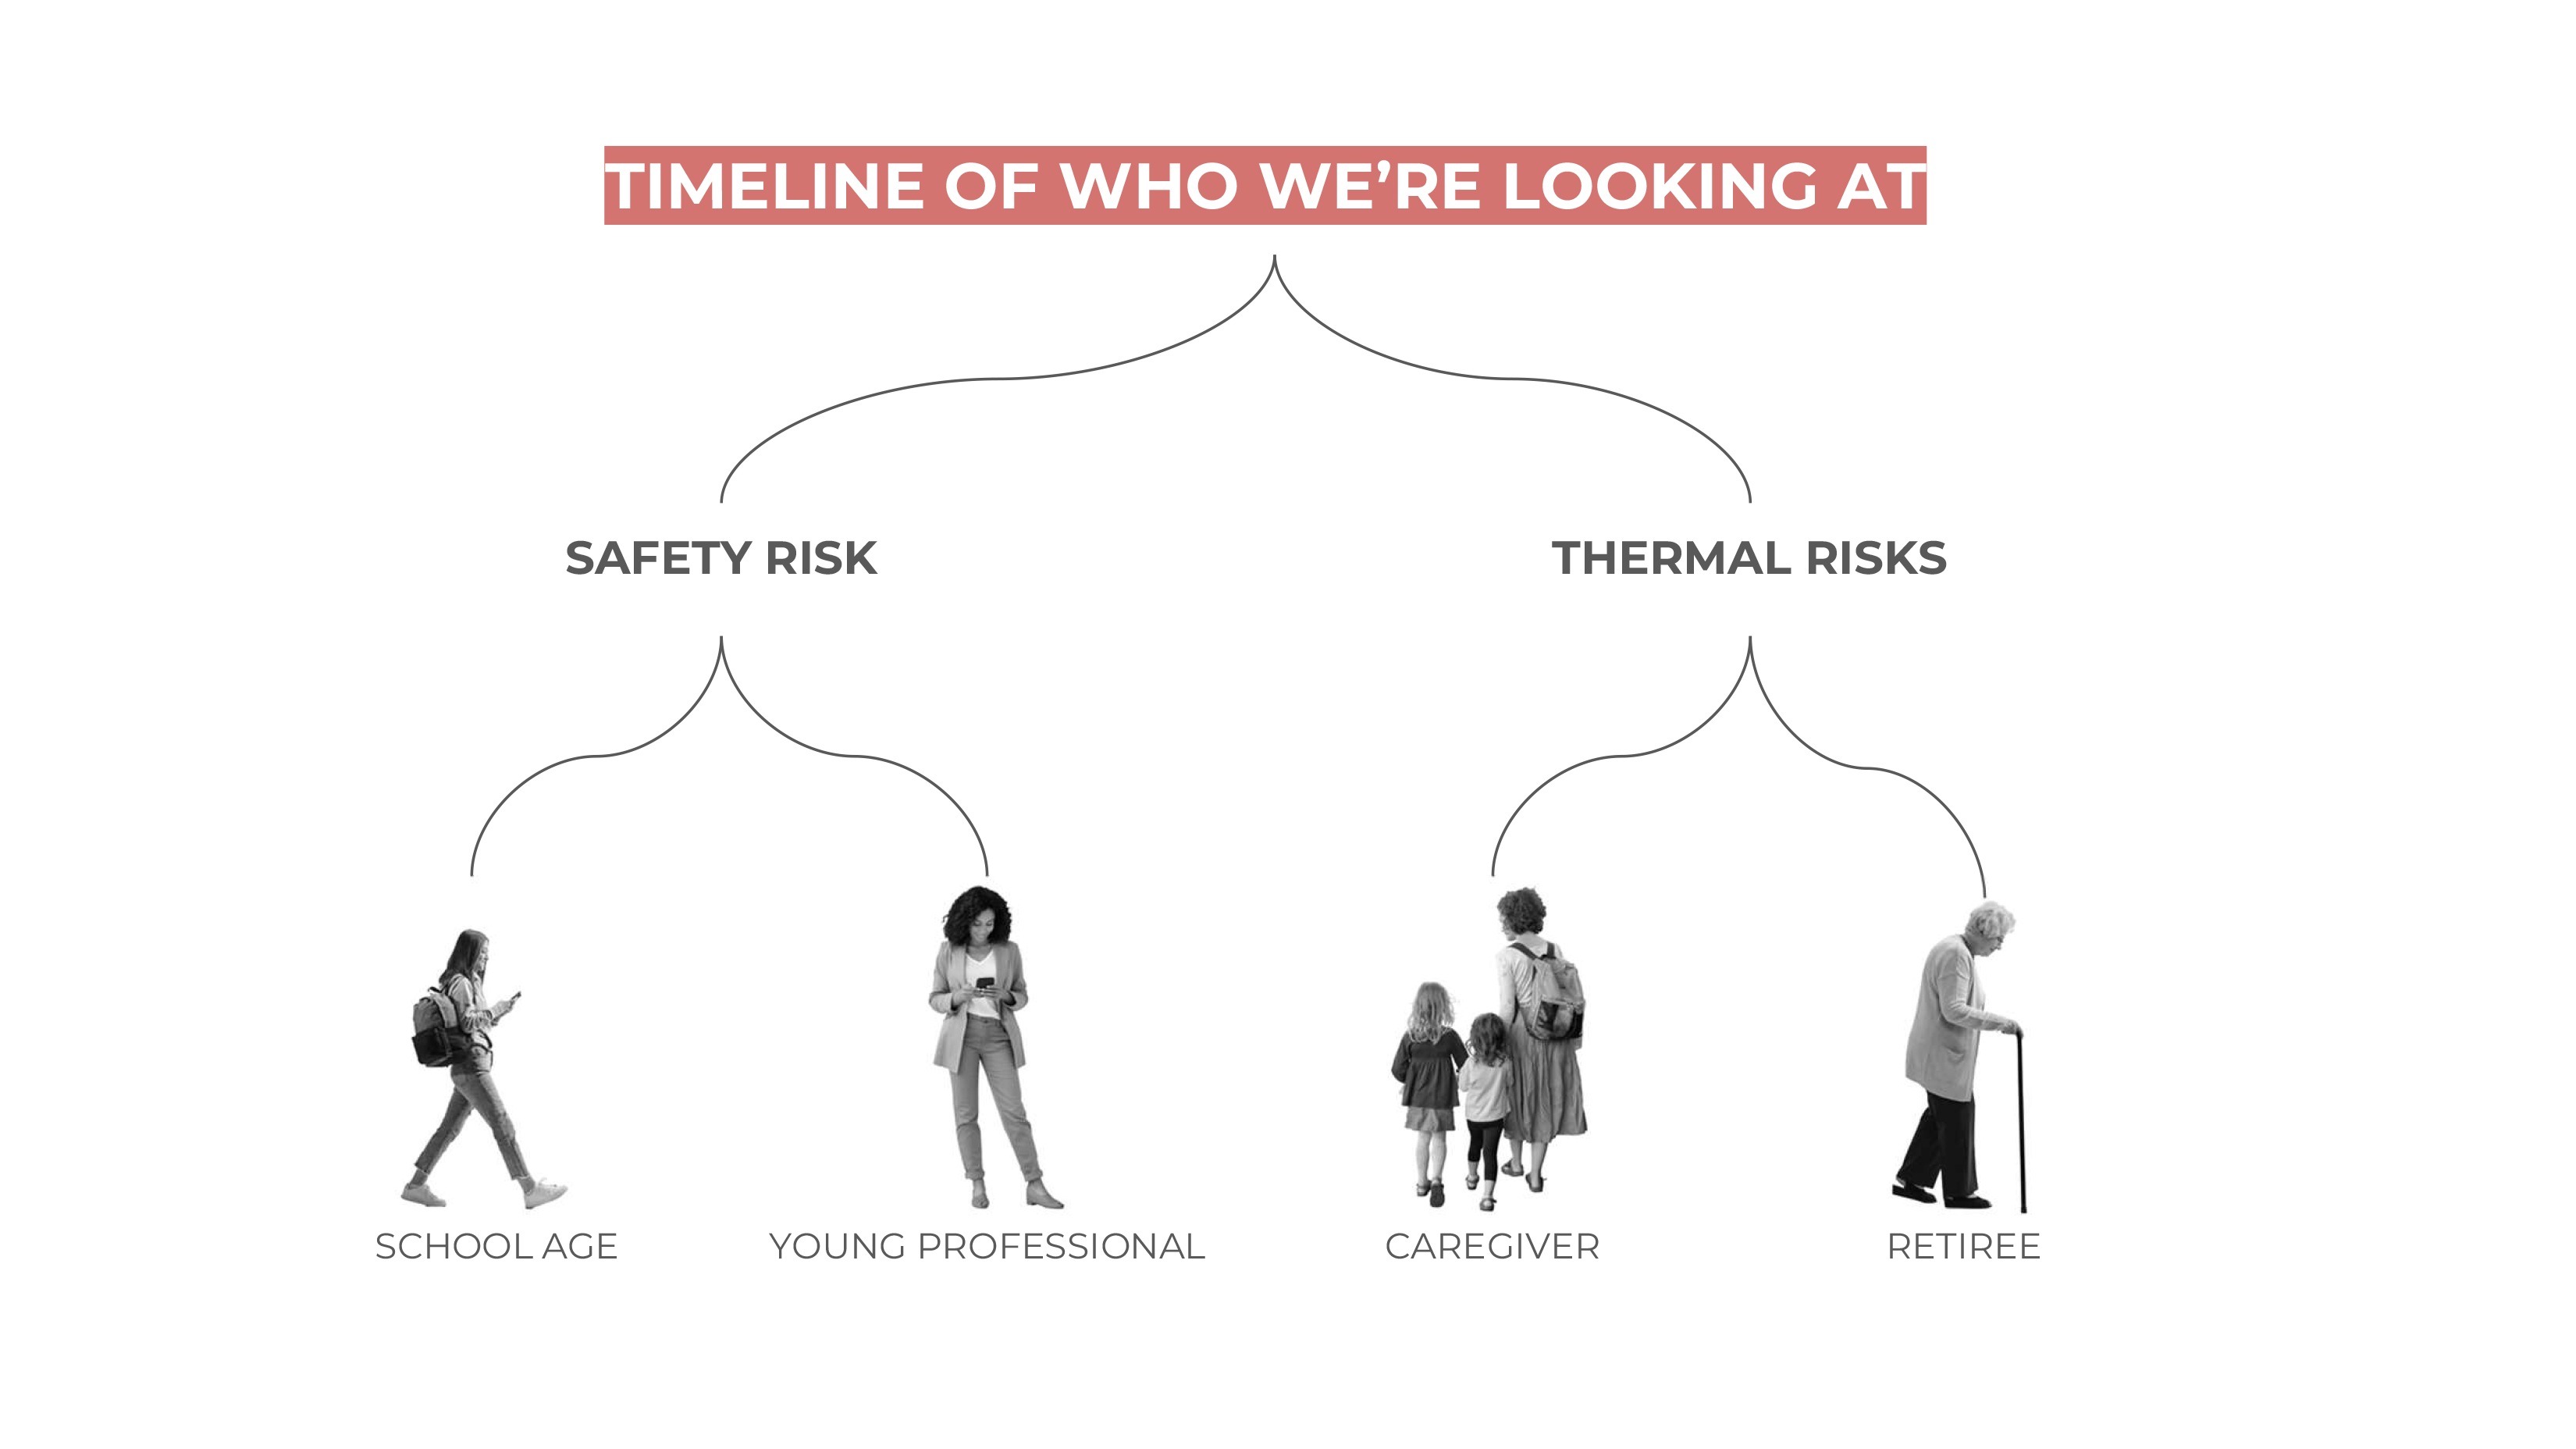
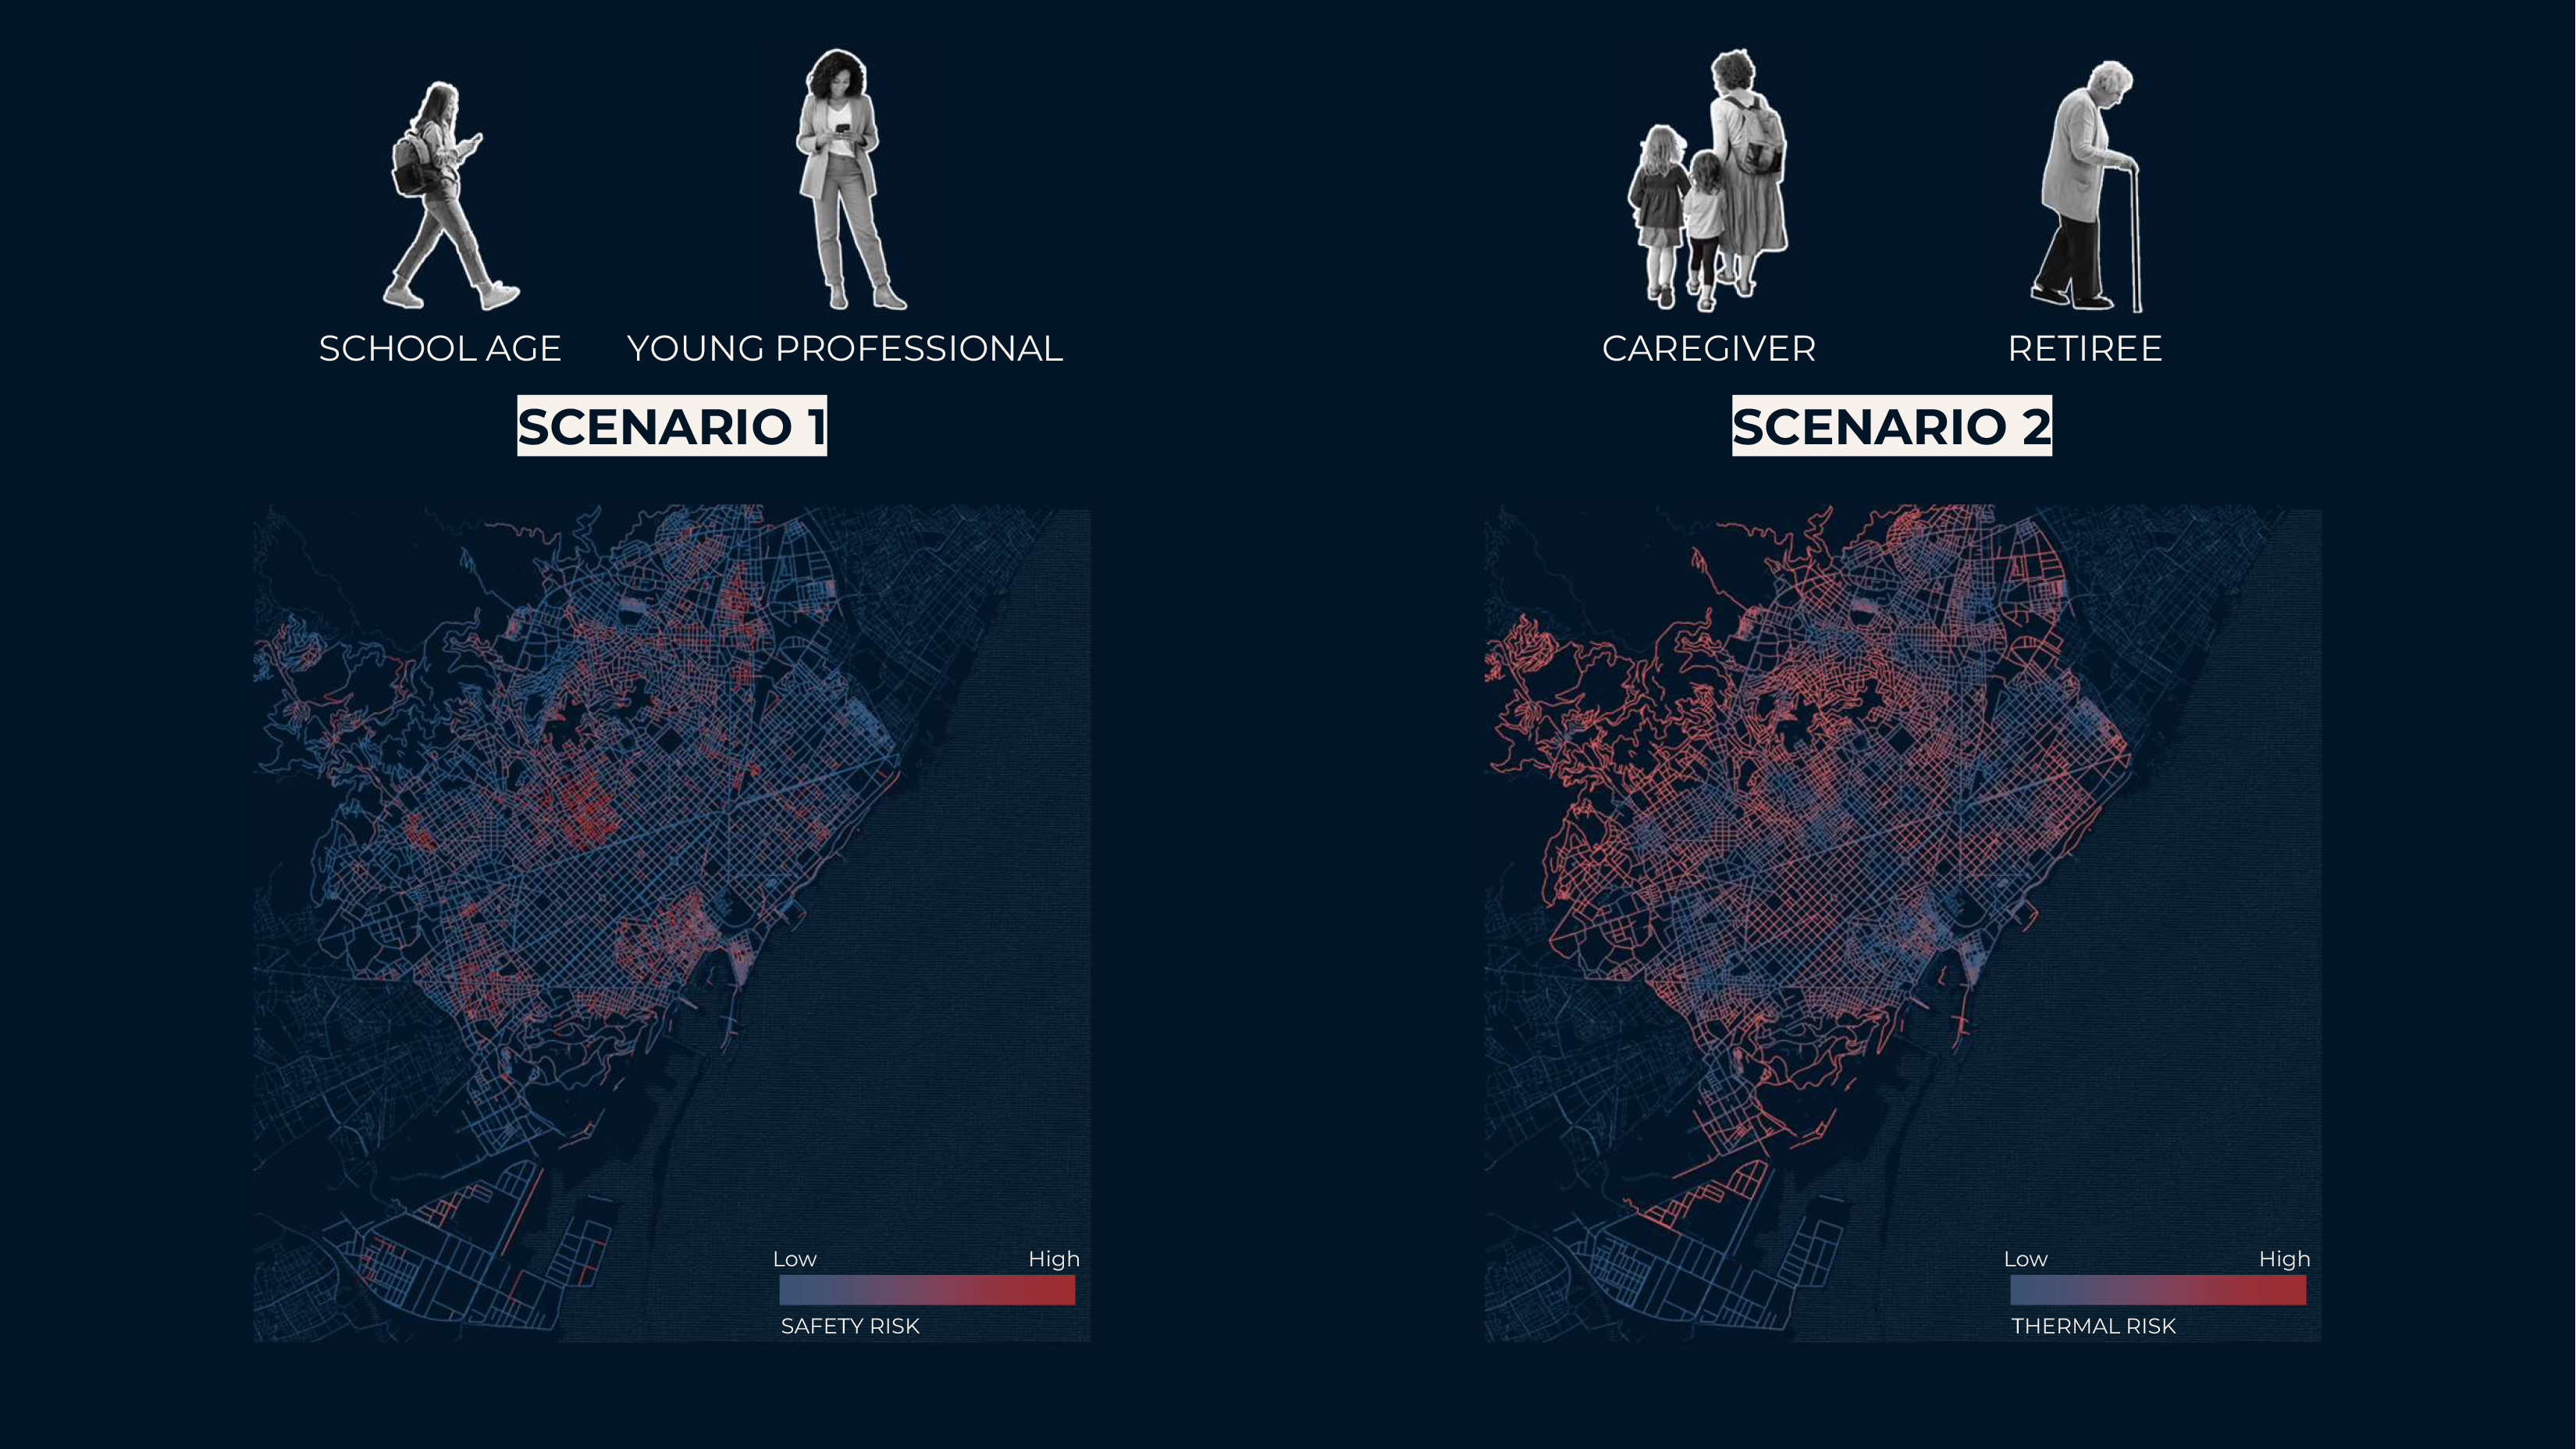
1. Safety Risks at Night: Younger women often feel unsafe due to poorly lit streets and narrow alleys.
2. Thermal Risks During Heatwaves: Older women and caregivers are more exposed to heat stress due to extended time spent outdoors or limited mobility.
By mapping these risks, we aim to uncover how gender-specific needs can inform better urban design, ensuring that public spaces work for all residents—at every stage of life.
METHODOLOGY PROXIMITY: RISK ASSESSMENT
Our research shifted from data collection to mapping proximity-based risks across Barcelona, focusing on how time and personal characteristics influence urban accessibility.
Understanding Proximity by Stakeholder
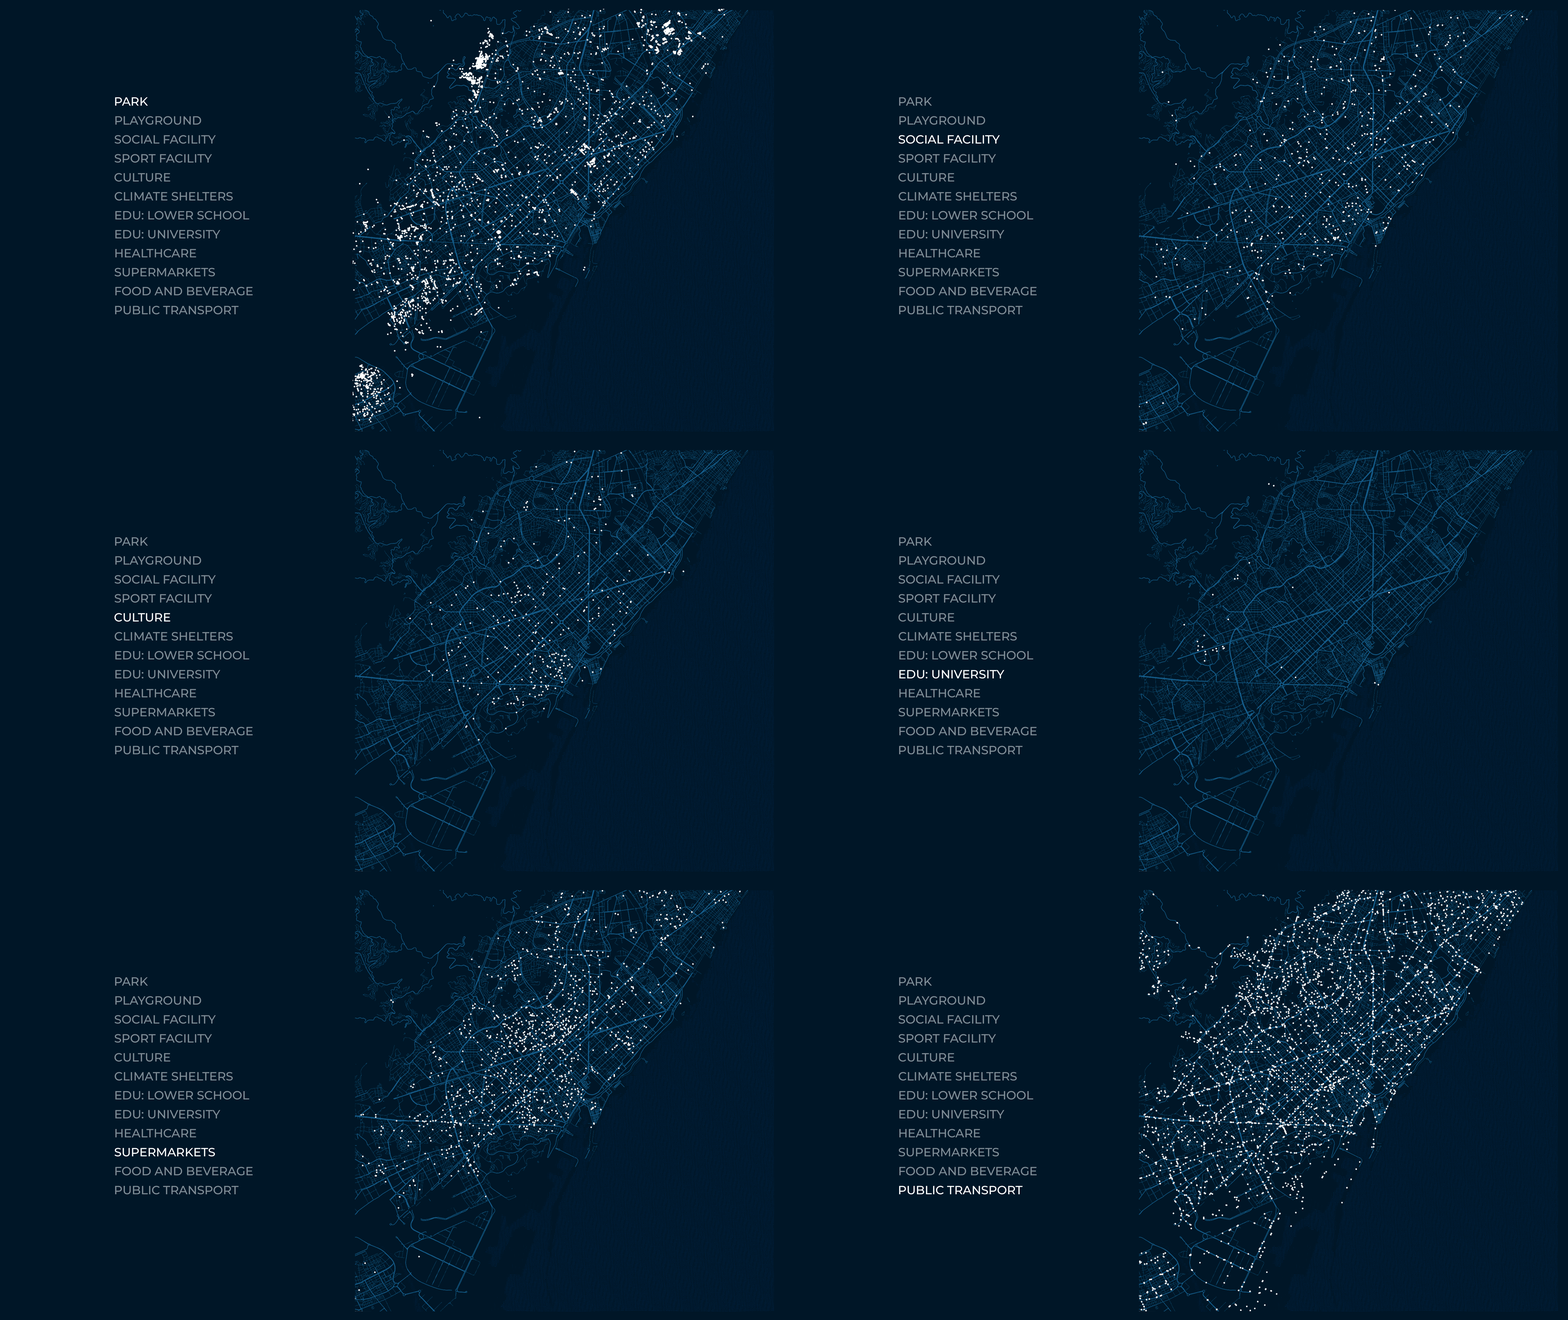
Mapping Key Destinations: We identified essential city destinations using data from Open Data BCN and OpenStreetMap.
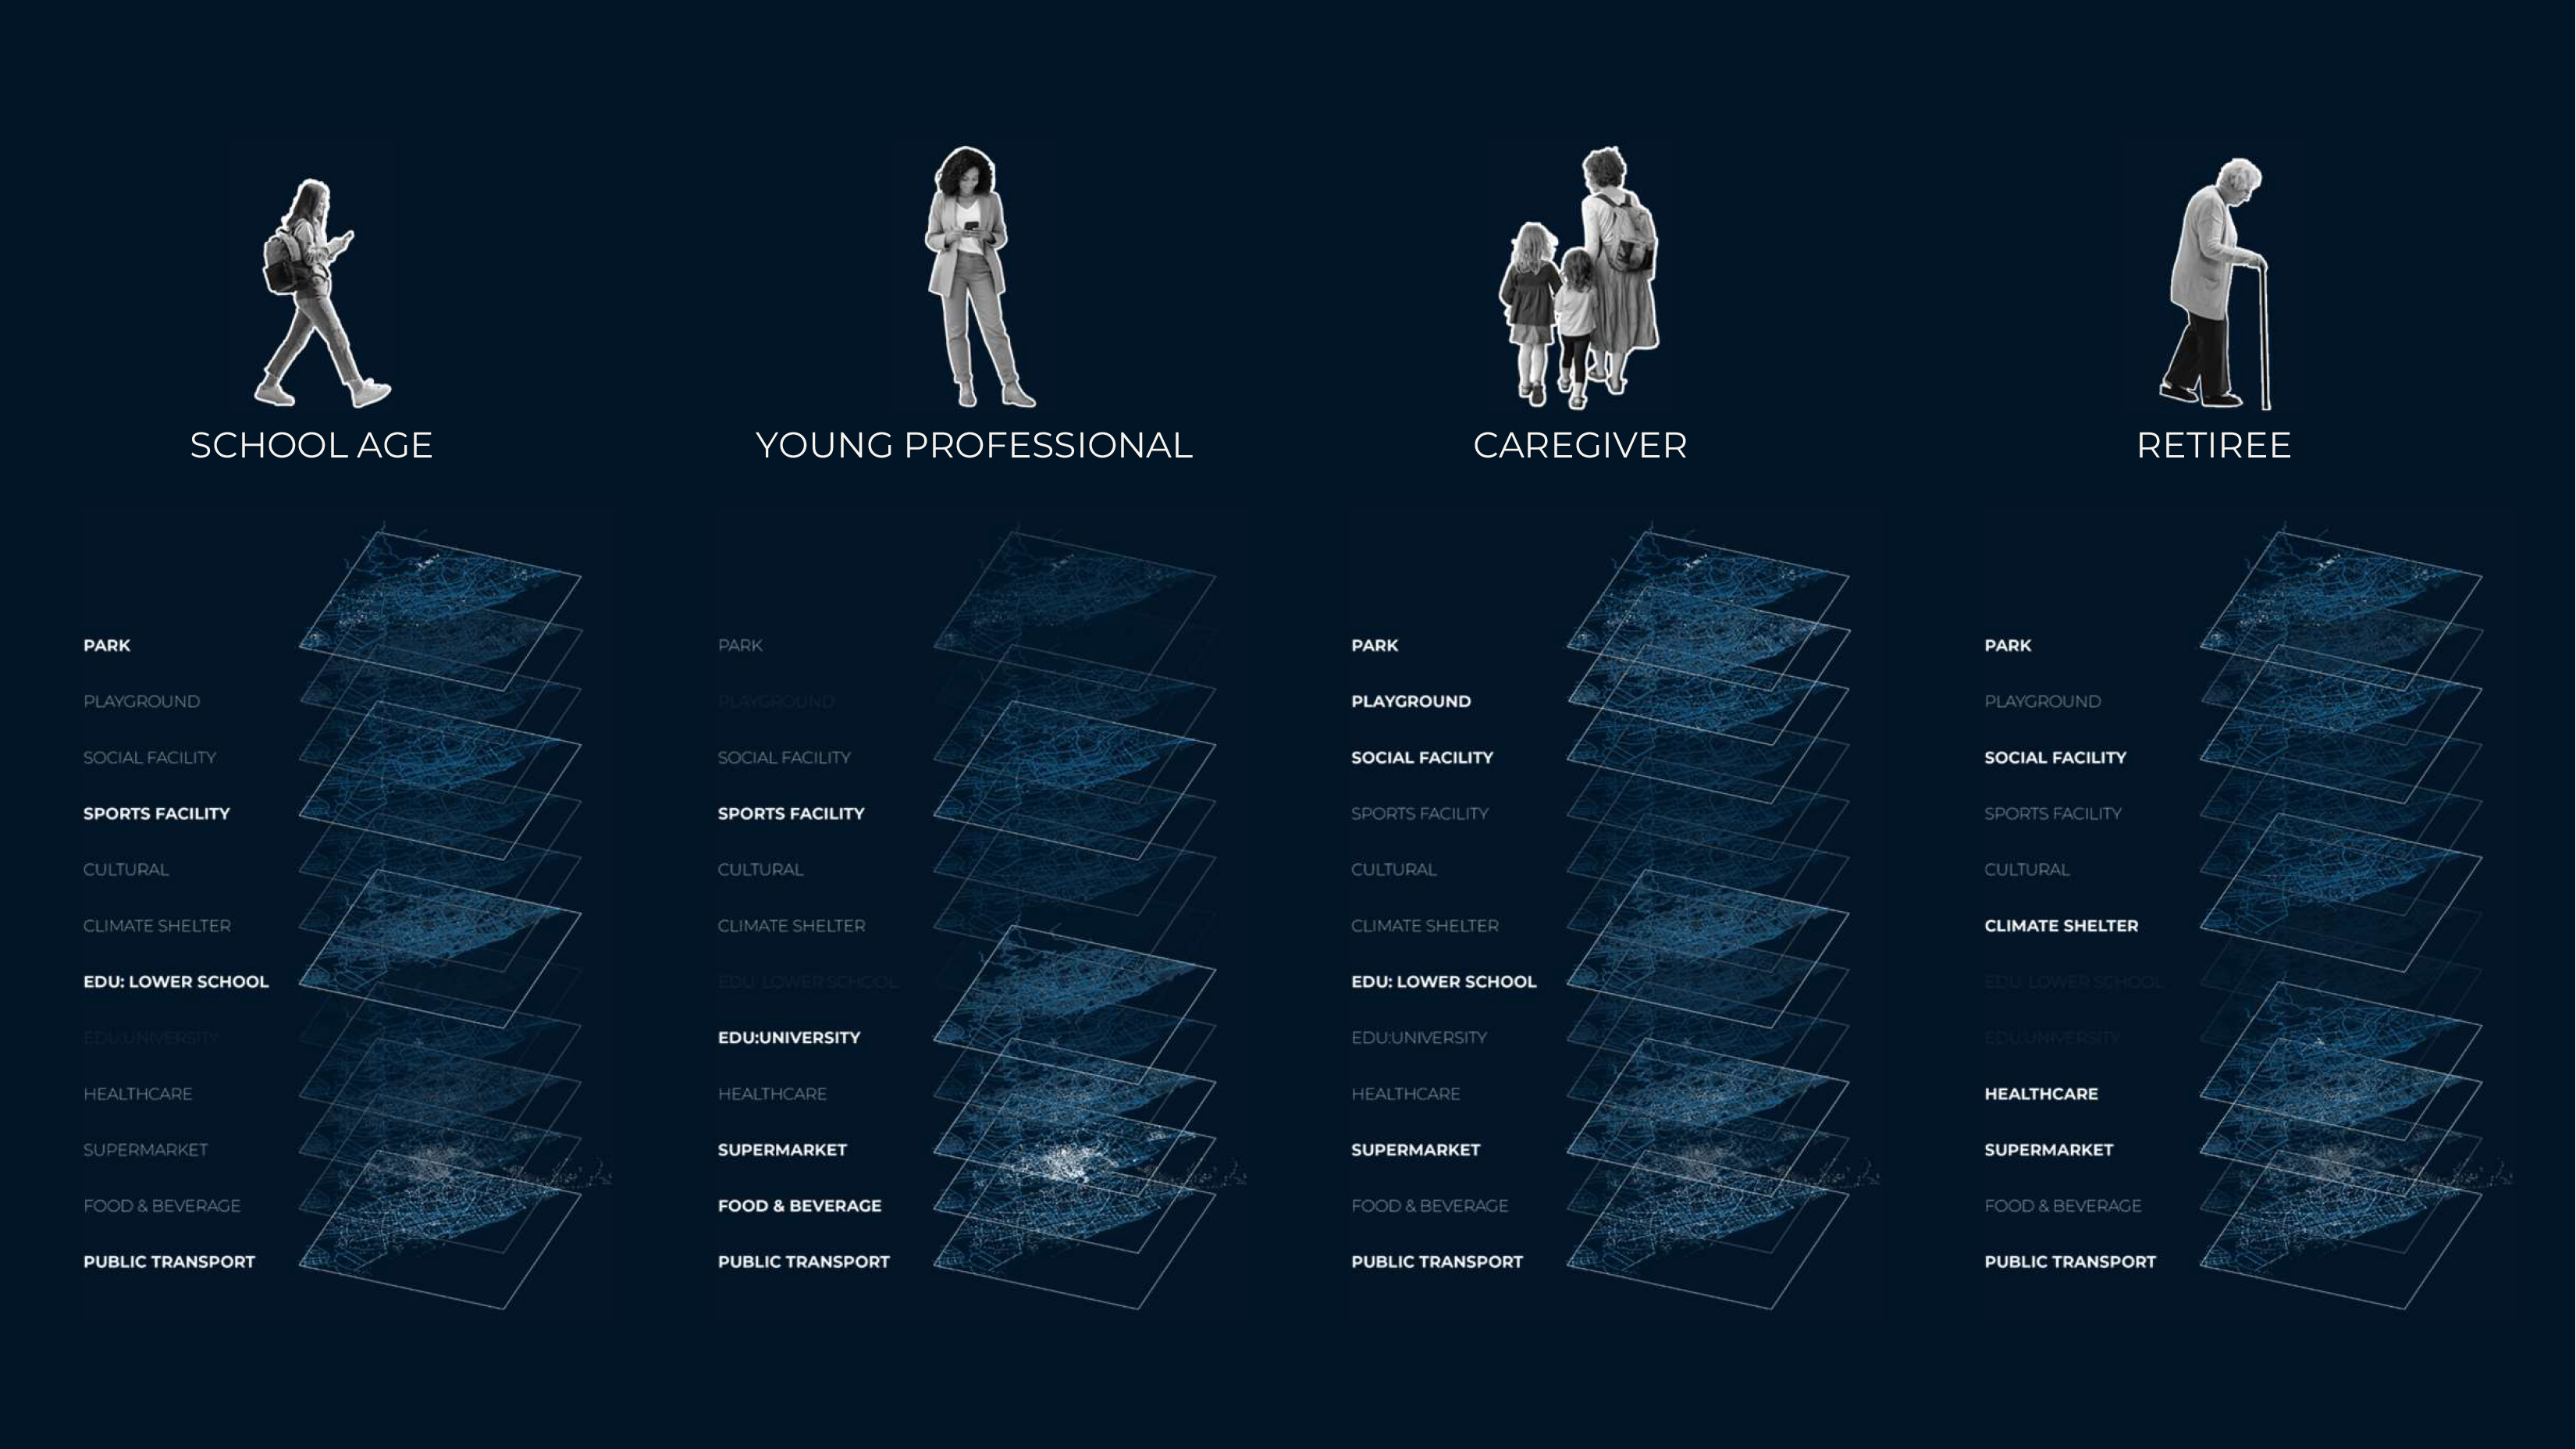
Weighing Destinations by Demographics: We assessed how women of different ages and roles navigate the city, factoring in destinations like schools for young students and health centers for elderly women.
Mobility Patterns and Walking Speeds: We analyzed how walking speeds and travel urgency vary.
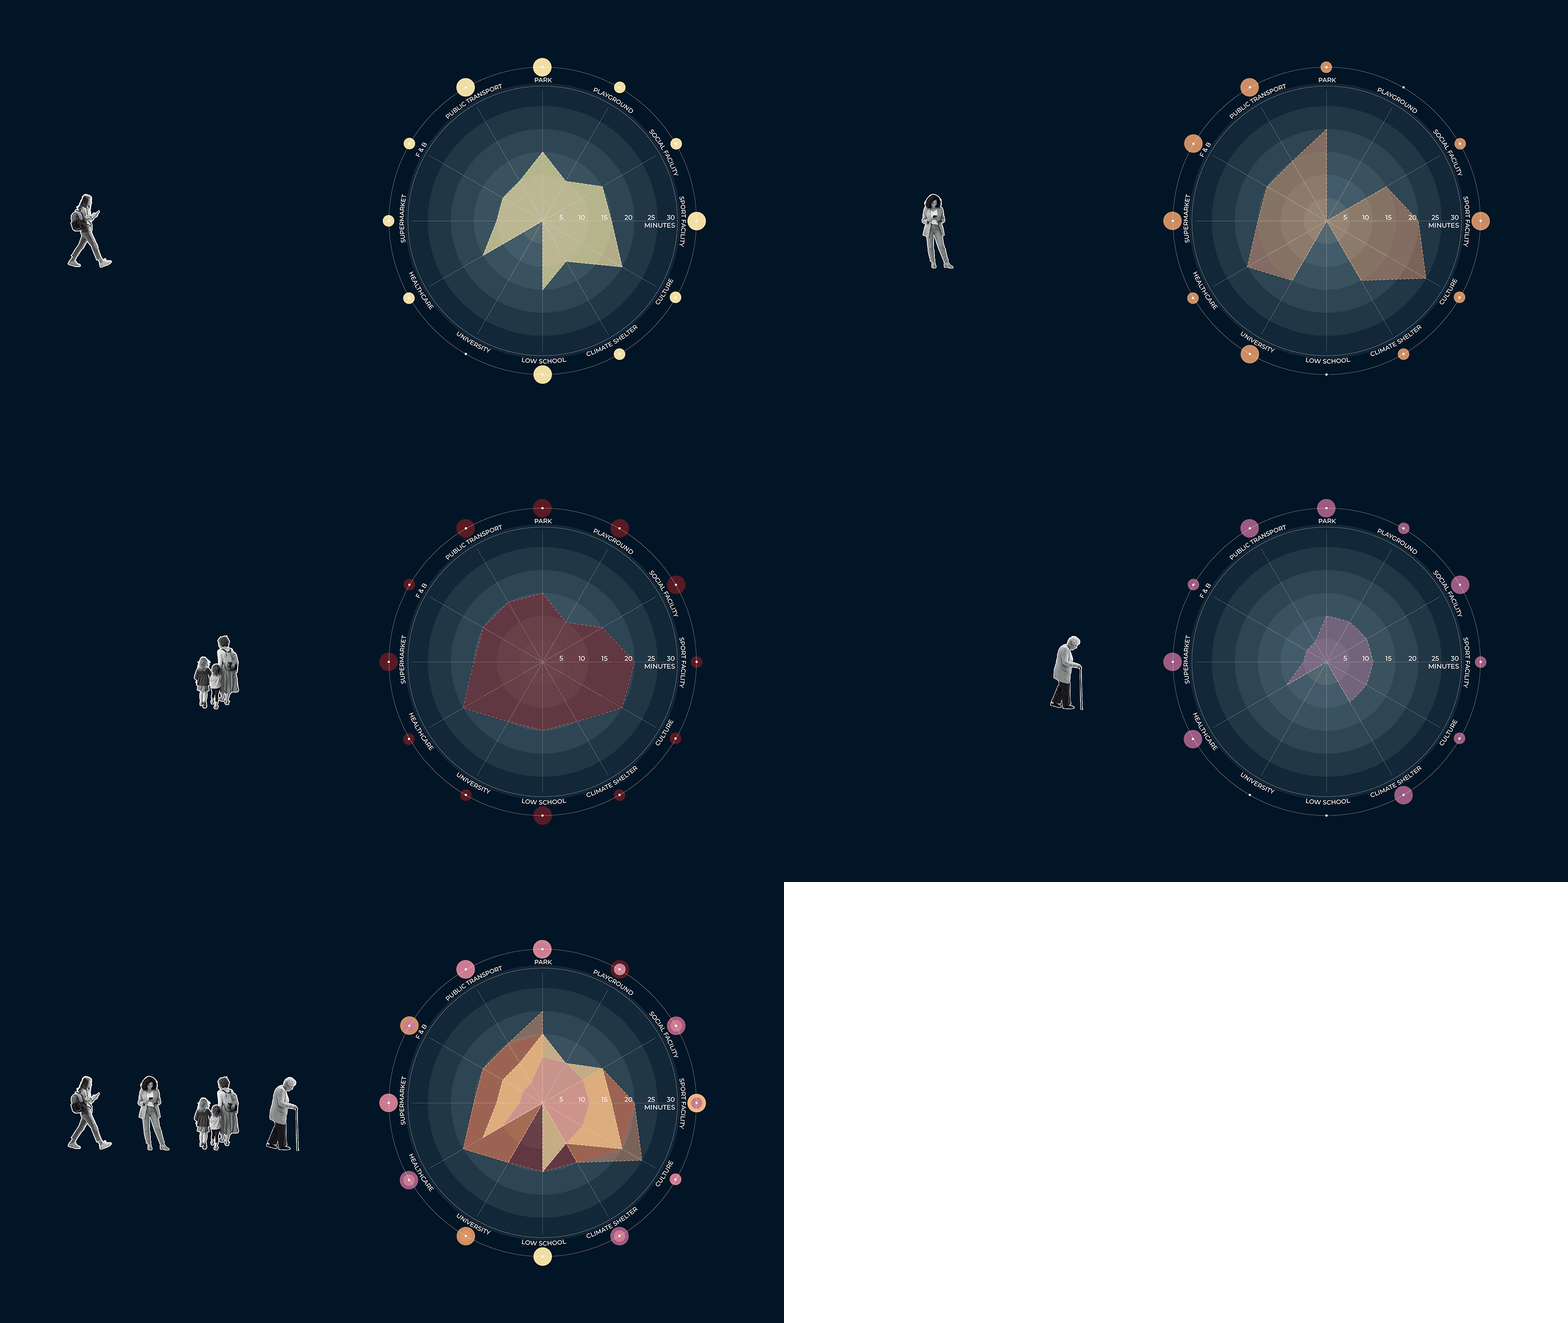
Proximity vs. Low Proximity: We discovered that proximity is not standardized. Adjusting only for age revealed significant variations in how accessible key destinations are.
Proximity

SCHOOL AGE
YOUNG PROFESSIONAL
CAREGIVER
RETIREE

Low Proximity and Risk Scenarios
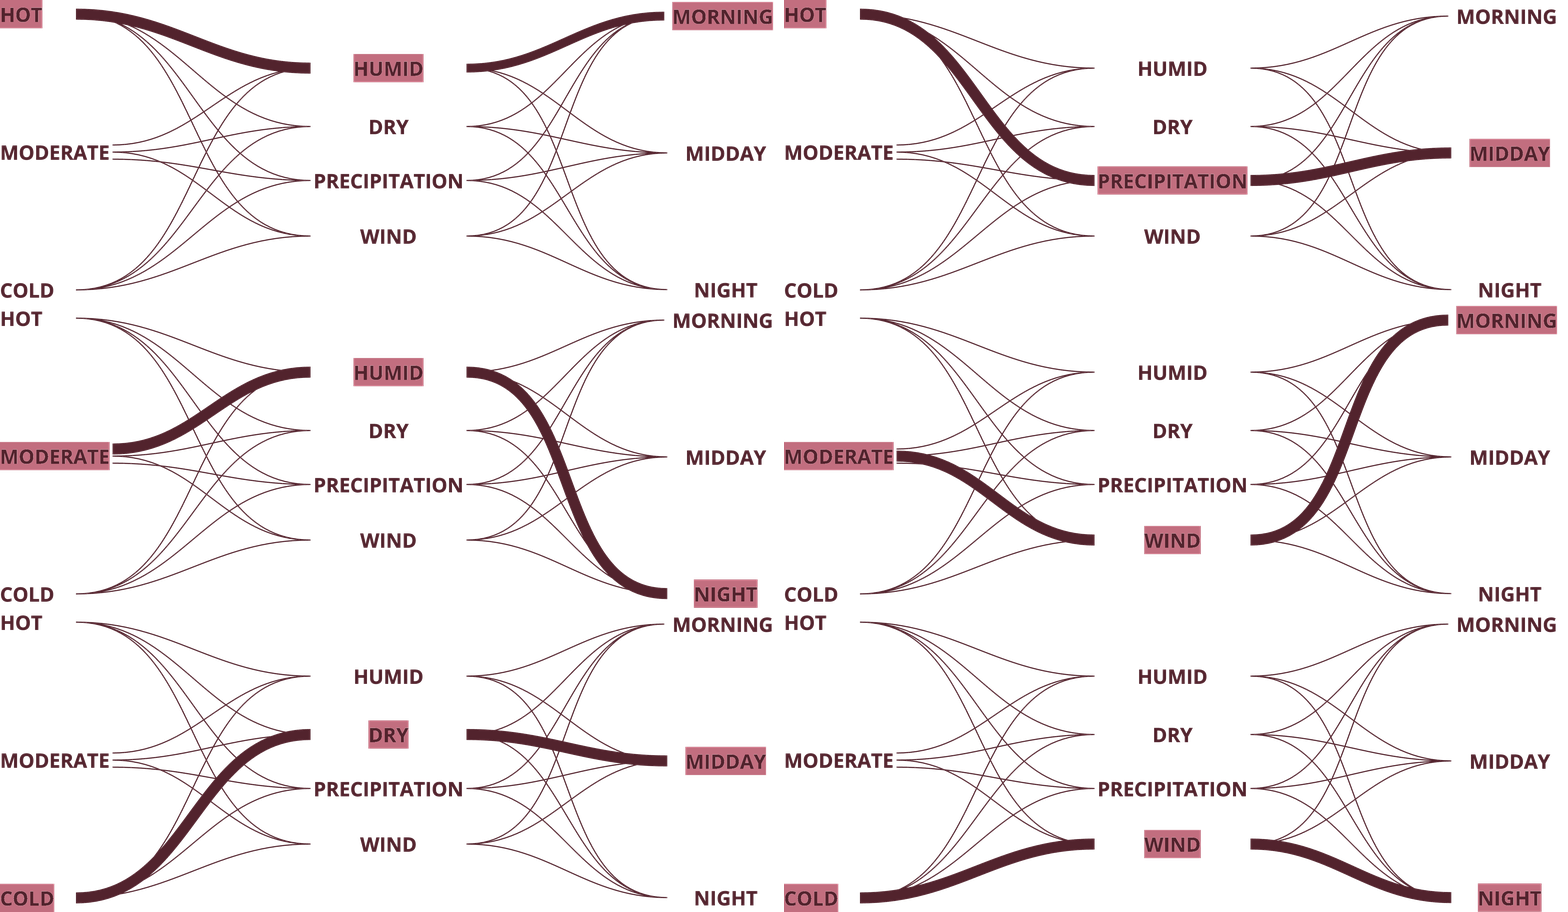
To assess low proximity zones, we considered additional time-based factors:
• Time of Day: Poorly lit streets pose safety risks for young women at night.
• Time of Year: High temperatures increase thermal risks for older women during heatwaves.
By applying a mobility reduction scale, we calculated how these risks expand low-proximity zones, showing that urban accessibility fluctuates across different times and for various users. Our findings reveal that cities are not homogenous—urban design must adapt to meet diverse needs for safer, more inclusive spaces.
SCHOOL AGE
YOUNG PROFESSIONAL
CAREGIVER
RETIREE

METHODOLOGY STREET NETWORK: CRITICAL INFRASTRUCTURE ANALYSIS
Analyzing Street Infrastructure and Urban Vulnerability
Our next focus was street infrastructure and how it affects women’s safety and mobility in low proximity zones. We examined various urban features linked to two key risk categories: Safety Risks and Thermal Risks.
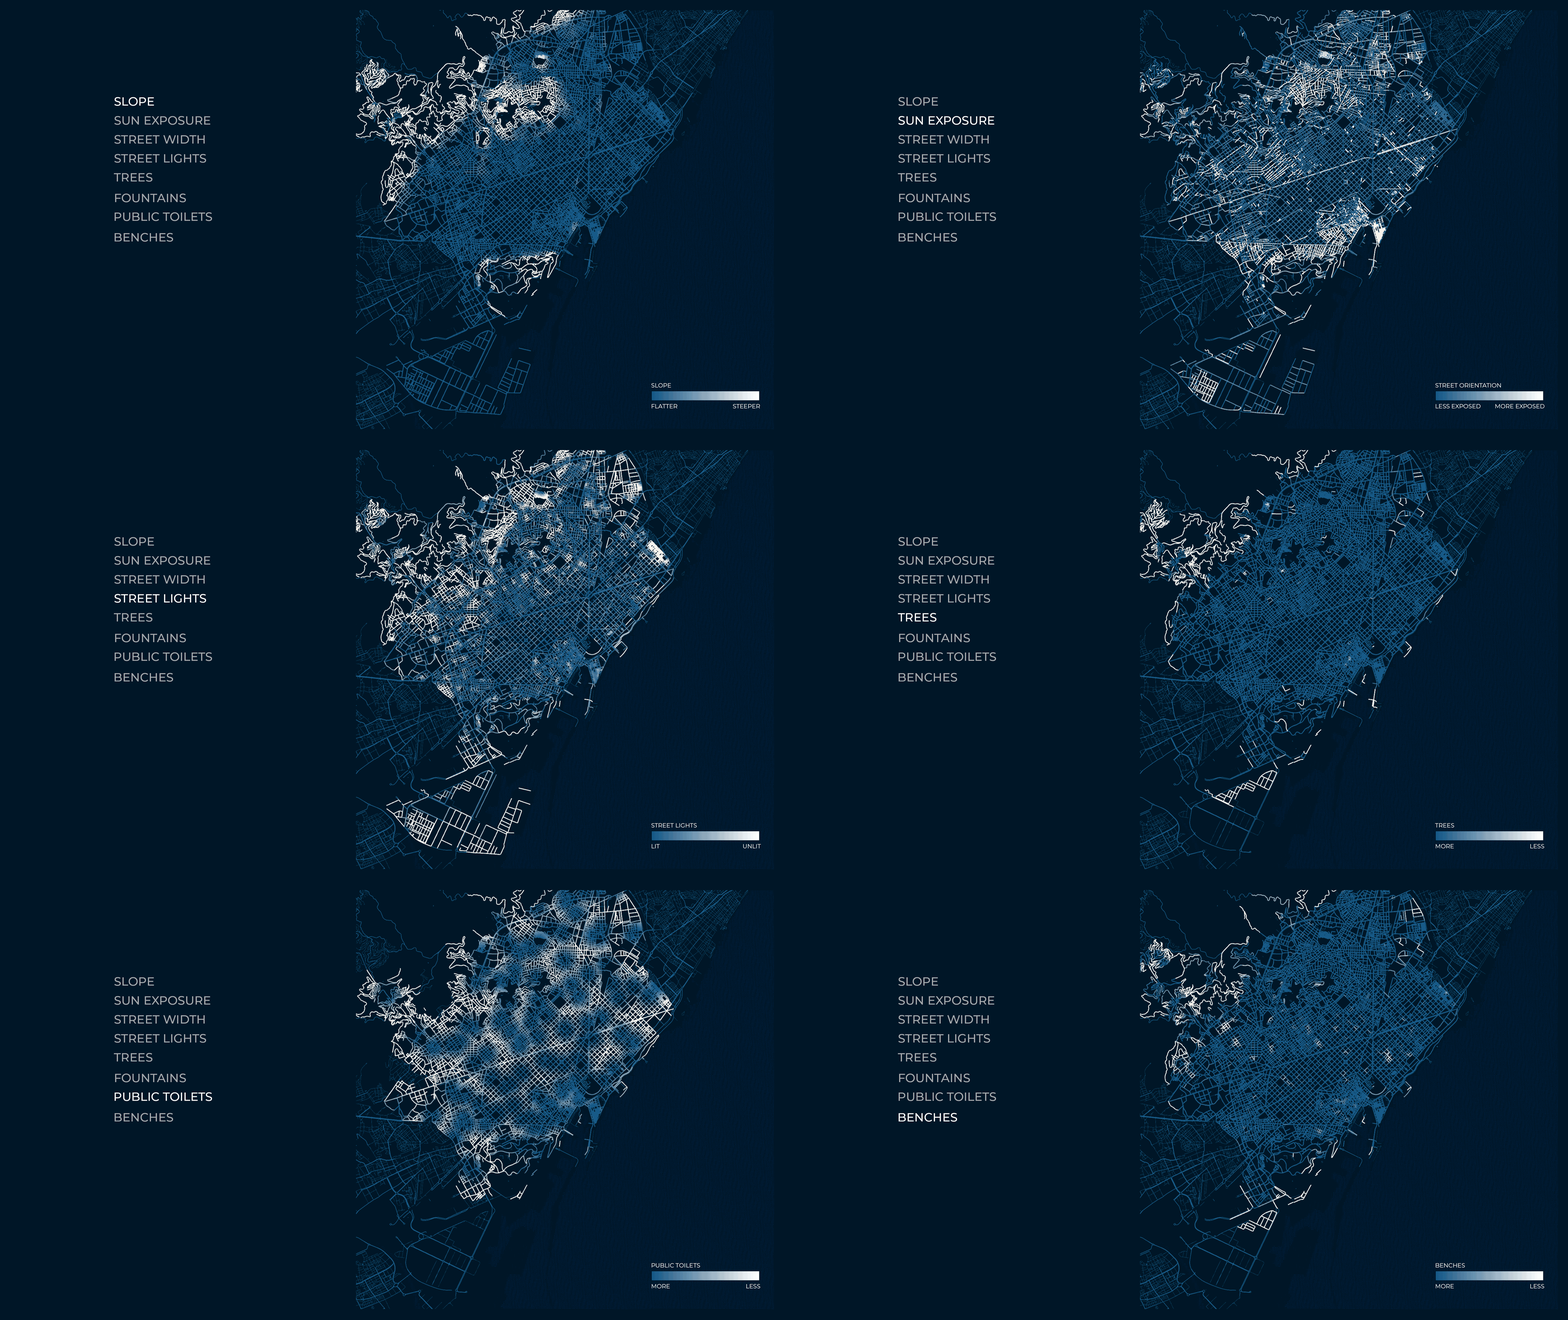
Key Street Infrastructure Layers Considered:
• Physical Features: Street width, slope, and orientation.
• Safety Enhancers: Lighting and visibility.
• Comfort Amenities: Trees for shade, water fountains, benches, and public toilets.
Risk Scenarios Analyzed:
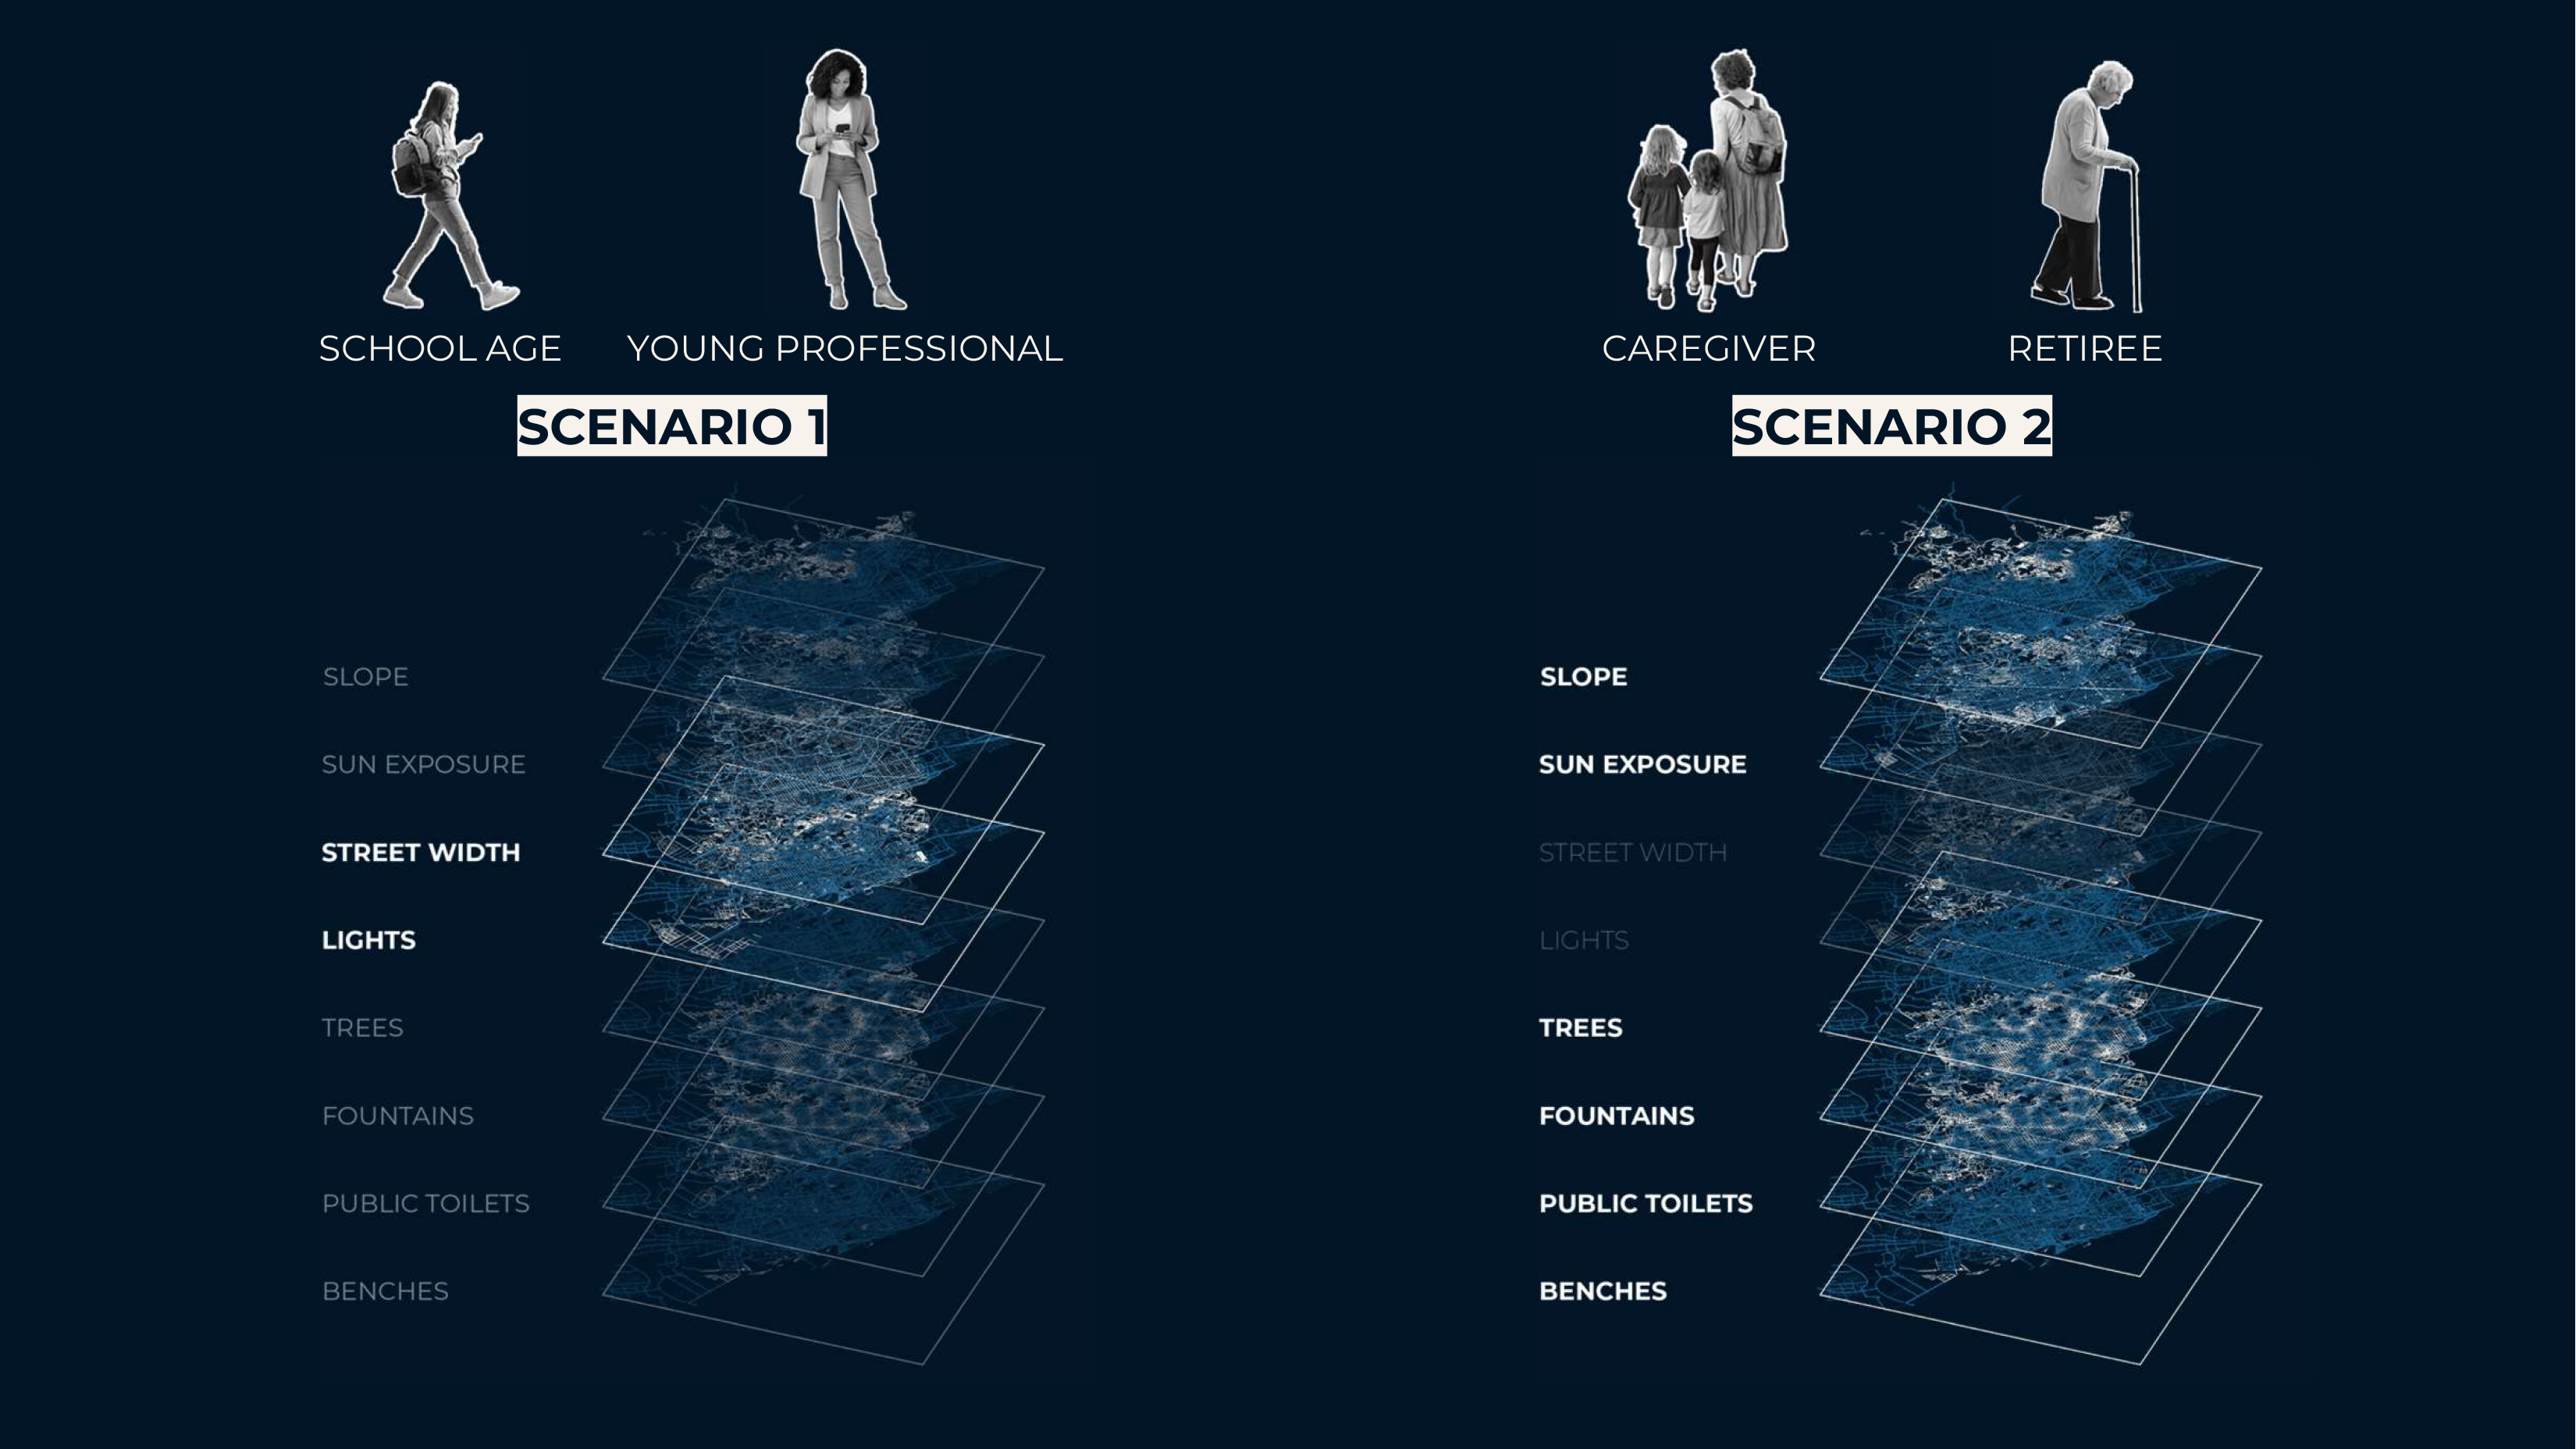
Scenario 1: Cold Night (Safety Risk)
• Critical Factors: Street width and lighting
• Insight: Narrow, poorly lit streets create a sense of isolation and insecurity, making women avoid these areas at night.
Scenario 2: Hot Day (Thermal Risk)
• Critical Factors: Shade, heat-absorbing surfaces, and cooling amenities like fountains and benches.
• Insight: Streets with little shade and minimal cooling features increase thermal stress, especially for older women and caregivers.
By evaluating these factors, we identified areas where insufficient street infrastructure worsens urban risks, highlighting where the city’s design could be improved for greater inclusivity and safety.
INCLUSIVE CITY: AN ADDENDUM
VULNERABILITY MAPPING: TOOL FOSTERING MORE INCLUSIVE CITIES
While proximity is inherently fluid and context-dependent, amenities—key to meeting urban needs—remain relatively static components of the city.
Similarly, the street network, though structurally fixed, has a dual potential: depending on its capacity to address user needs, it can either exacerbate or mitigate risks.
The integration of personalized proximity analyses with key street network features provides a robust framework to support policies aimed at fostering more inclusive urban environments. However, it is crucial to acknowledge that the accuracy and completeness of such analyses depend on the quality of the data used. Despite these limitations, this approach can effectively highlight areas that warrant further investigation. With systemic planning and targeted interventions, it can serve as a foundation for reducing inequalities through the provision of high-quality public spaces.
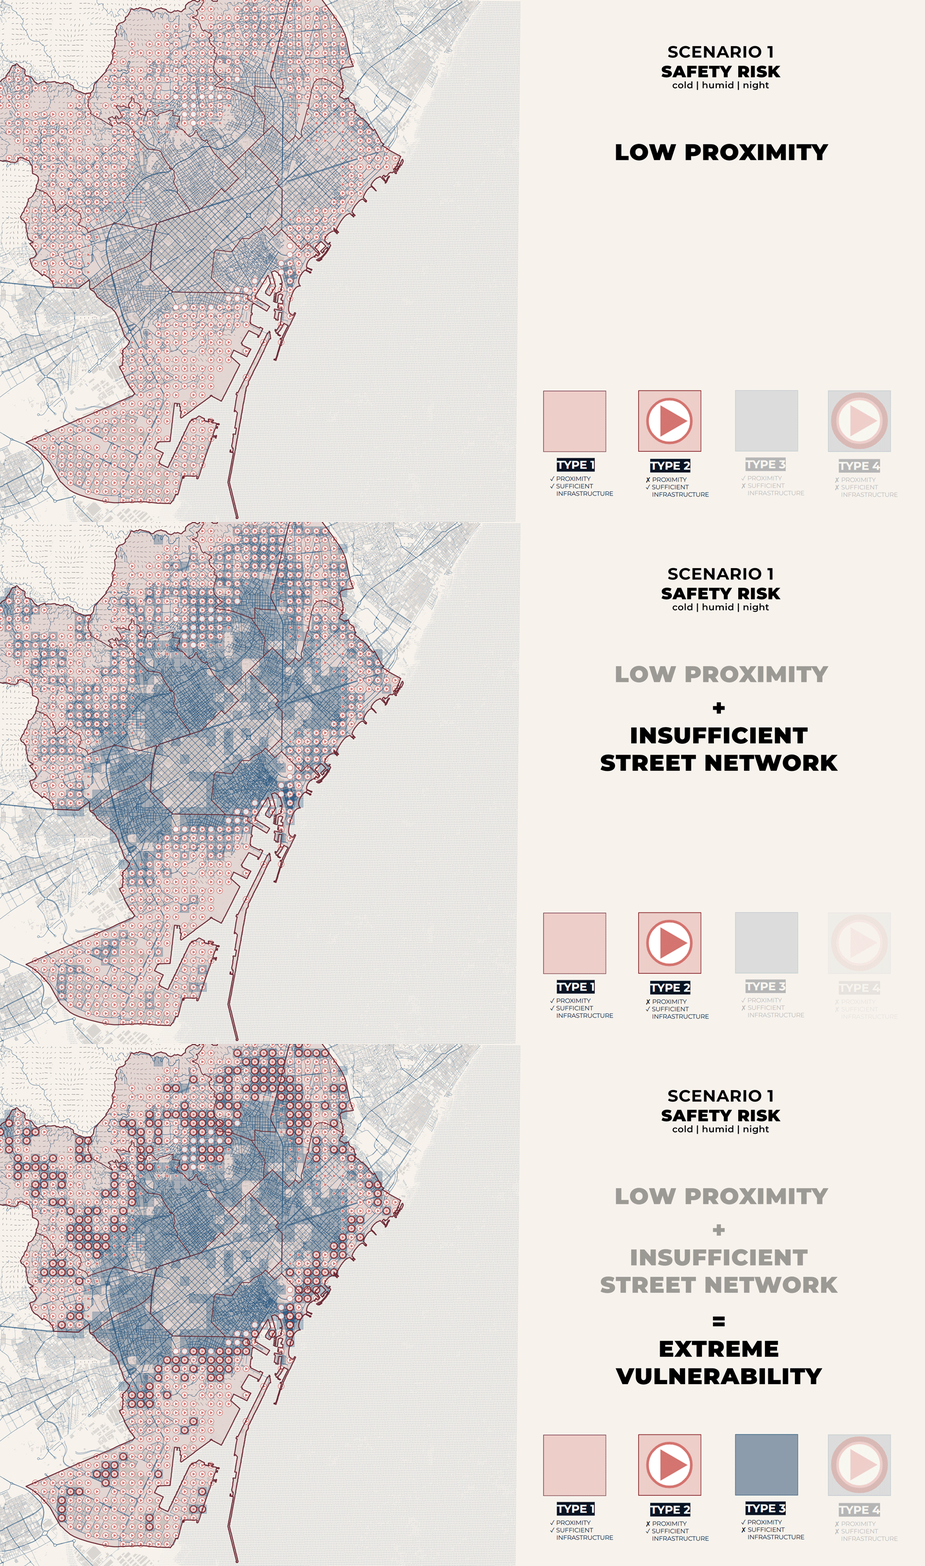
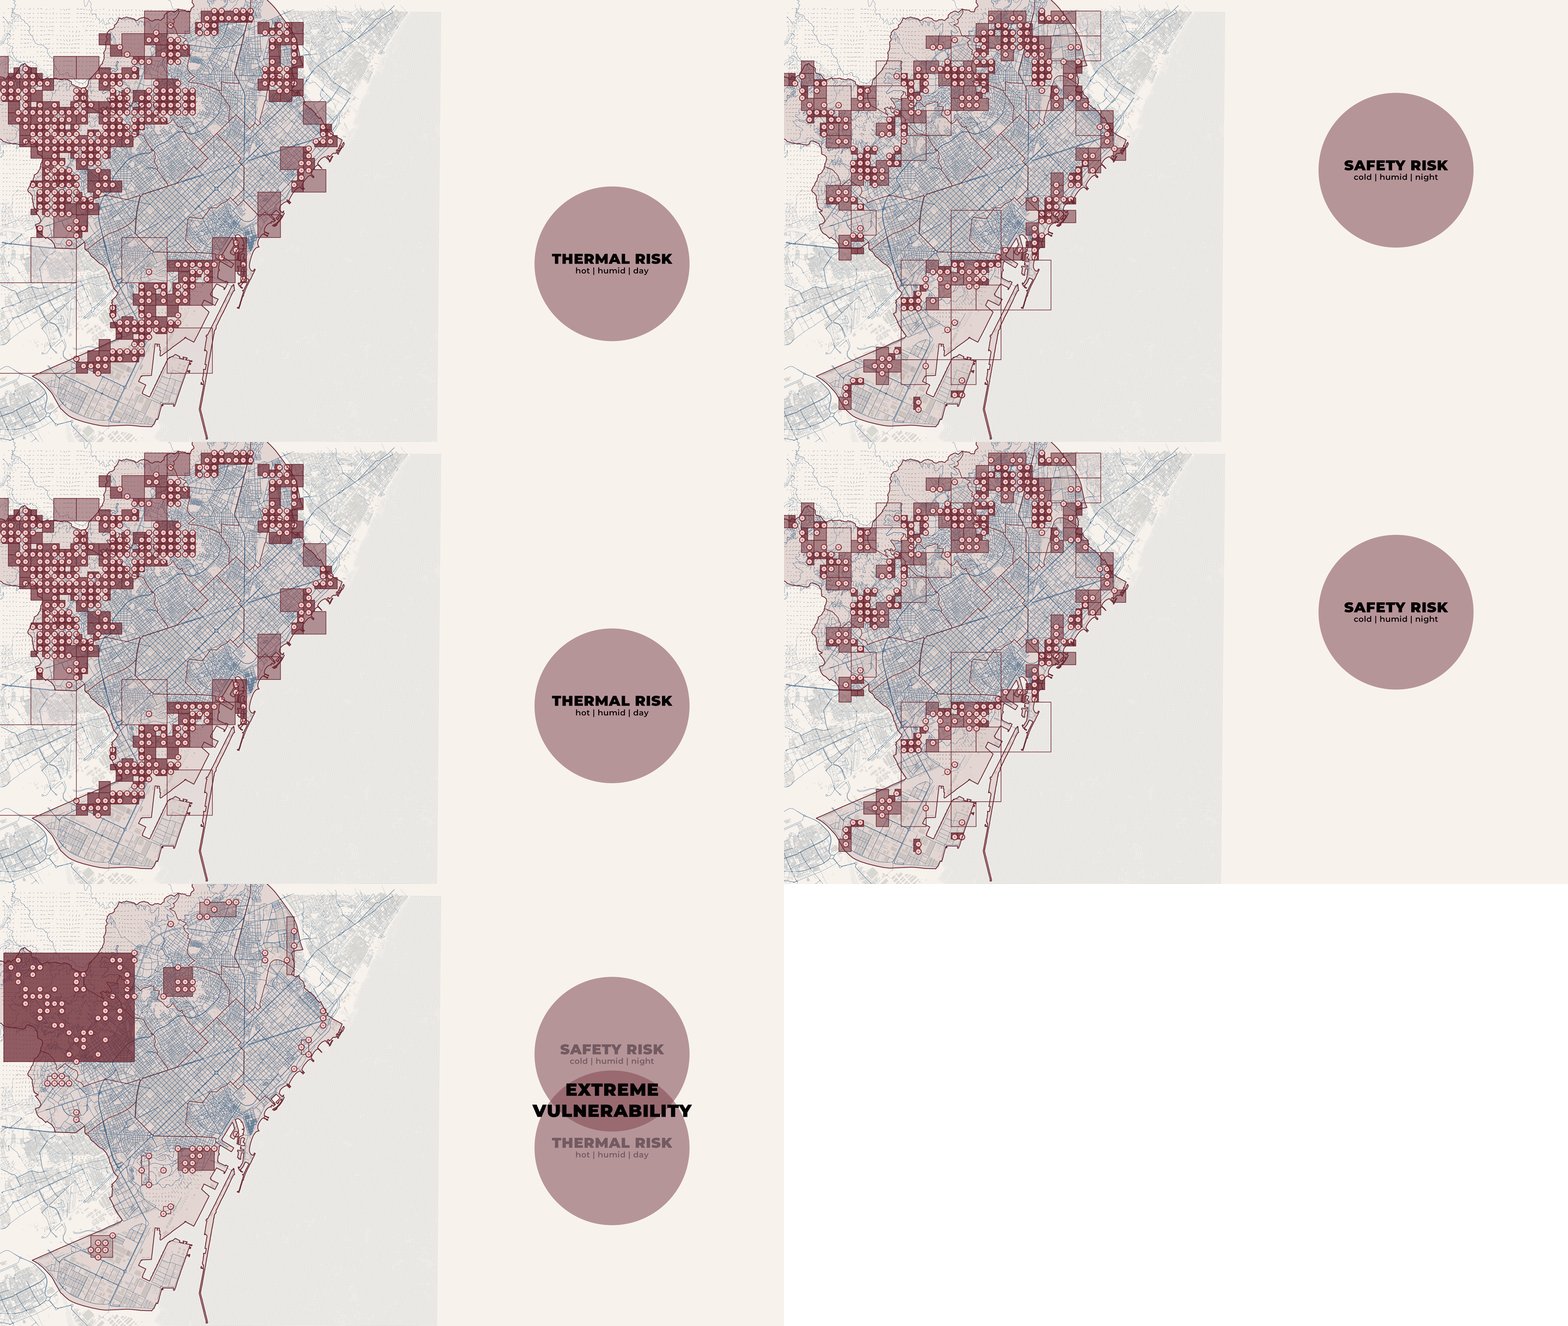
This overlapping methodology enables us to pinpoint areas with the greatest impact on vulnerable users in specific risk scenarios, underscoring the importance of closely investigating these zones.
Zones of extreme vulnerability are areas that may fail to meet the needs of women at different times of the day, year, or life. Viewing the urban fabric through the lens of its most vulnerable users provides an opportunity to build a stronger, more resilient city by addressing and mitigating these vulnerabilities.
VULNERABILITY MAPPING: ZONE TYPOLOGIES
To better capture the nature of these vulnerabilities, we classified four distinct types within a smaller urban grid of 250×250 meters. This categorization organizes the city into four zones based on two critical factors: proximity (ranging from low to high) and infrastructure quality (from insufficient to sufficient).
VULNERABILITY MAPPING: FURTHER STUDY ENHANCEMENT
Study Accuracy: Conduct a targeted survey of women in Barcelona to better understand their needs for amenities, the insecurities they experience, and the risks they prioritize.
Data Validation: Verify the data used in our mappings through physical investigations, ensuring that the findings reflect real-world conditions.
Closer Examination: Perform in-depth reviews of identified areas, examining their spatial layouts to understand the underlying sources of vulnerability and validate the outcomes.
Broader Application: Expand the methodology’s application to various scales, from individual neighborhoods to entire cities, to uncover broader patterns and reinforce existing inclusivity policies.

