
ABSTRACT
This thesis investigates the relationship between urban development patterns and outdoor thermal comfort, with a focus on Mean Radiant Temperature (MRT), a key factor in calculating the Universal Thermal Climate Index (UTCI).
While graph-based approaches have long been used in spatial analysis (e.g., space syntax, circulation networks), this research extends the application of graph theory to explore how urban form influences thermal stress, leveraging machine learning to model these interactions.
A hybrid framework is proposed that combines a Convolution Neural Network (CNN) with a Graph Neural Networks (GNNs) in order to predict the Mean Radiant Temperature based on a raster based analysis tool, UMEP in QGIS that calculate the MRT with the Solweig algorithm, enhanced with urban features that embed urban characteristic.
The central hypothesis is that the spatial structure of the city contains patterns that are predictive of outdoor thermal behavior, observable in both visual and numerical data. However, correlation analysis reveals that basic urban features alone (e.g., orientation, green percentage, height) are insufficient to explain local MRT variation, highlighting the need for richer spatial representations and higher-quality data.
The resulting models however, are capable of capturing spatial relationships at 1-meter resolution, enabling the prediction of MRT at the street scale. These models are integrated into a real-time design workflow, allowing users to modify geometry interactively and receive immediate feedback on the thermal implications of design decisions.
By linking environmental performance to urban morphology through machine learning and spatial computation, it opens new possibilities for integrating microclimate directly into the design process, enabling more informed and responsive urban environments.
SCENARIO
From raw thermal metrics to a topological representation of urban form
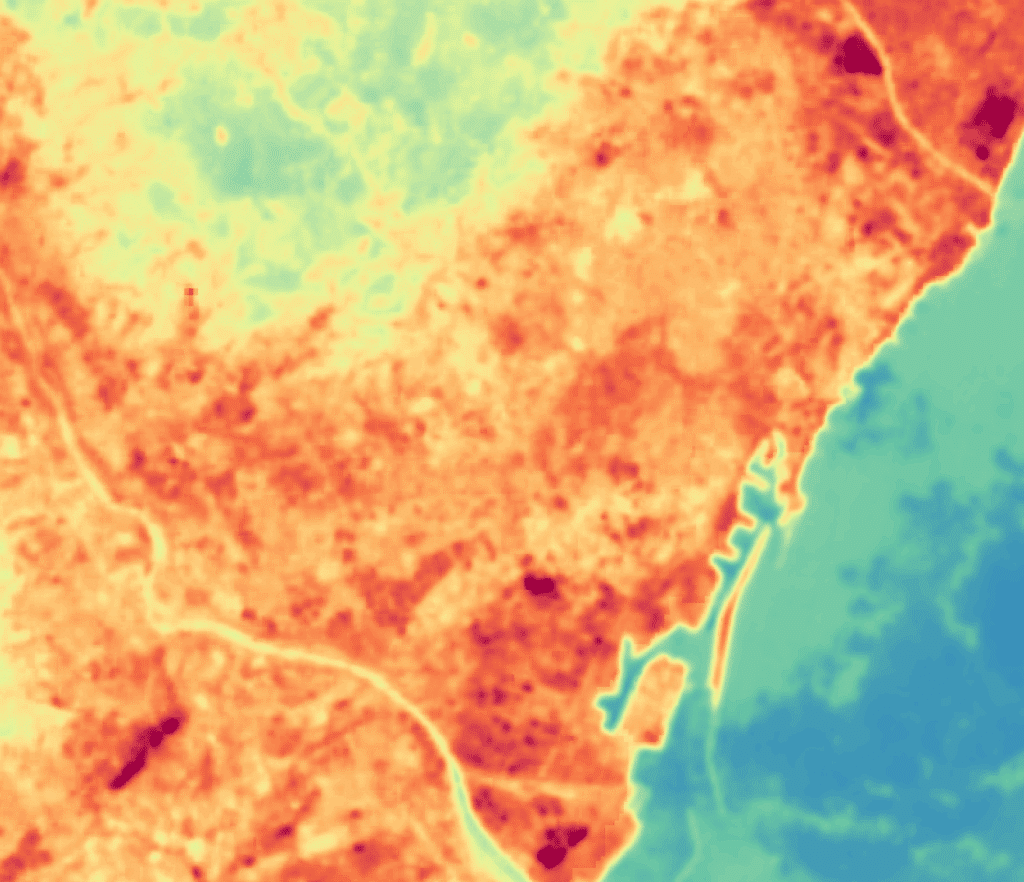
Typical Land Surface Temperature (LST) derived from NASA/USGS Landsat 8 Collection 2 Level-2 data (dataset: LANDSAT/LC08/C02/ T1_L2), have values that represent surface temperature in °C from the thermal band (ST_B10), scaled with official factors. At 30 m resolution (summer 2022), it reveals broad heat patterns across the city.
By translating thermal data into a network of spatial relationships, linking geometry, materiality, and environmental exposure, the workflow lays the foundation for a more precise and actionable understanding of urban heat dynamics.
UTCI: a comprehensive index of outdoor thermal comfort
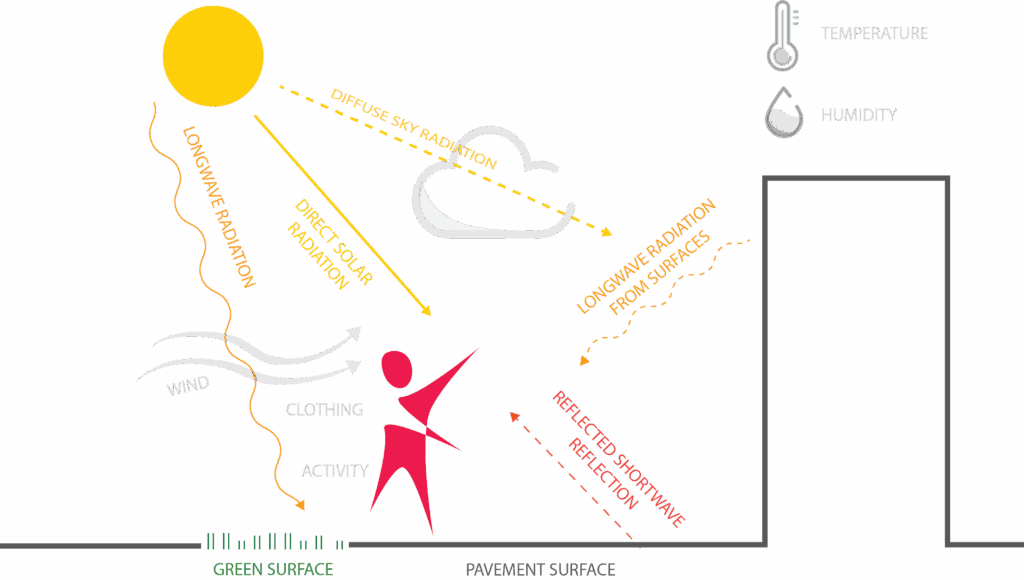
The Universal Thermal Climate Index (UTCI) combines air temperature, humidity, wind speed, and radiation to measure of outdoor thermal comfort. Among these variables, Mean Radiant Temperature (Tmrt) is especially relevant for urban studies, as it reflects the strongest influence of geometry, orientation, shading, and material properties.
Accordingly, this thesis will focus on the Mean Radiant Temperature (Tmrt), defined as the uniform temperature of an imaginary surrounding surface in which a person would exchange the same amount of radiant heat as in the actual, complex environment.
It accounts for:
-Longwave radiation from sky, ground, and surrounding buildings
-Direct and diffuse solar radiation
-Reflected shortwave radiation from surfaces
The formula for Tmrt can be expressed as:
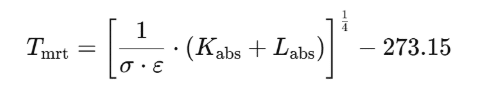
Kabs Absorbed shortwave radiation (direct +diffuse + reflected) [W/m²].
Labs Absorbed longwave radiation from sky, ground, and walls [W/m²].
ε Emissivity of the human body, typically ~0.95 (dimensionless).
σ Stefan–Boltzmann constant, 5.67 × 10⁻⁸ W/m²·K⁴.
The formula for UTCI can be expressed as:
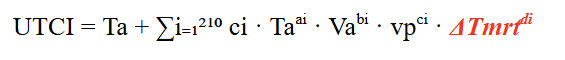
UTCI Universal Thermal Climate Index [°C]
Ta Air temperature [°C]
Va Wind speed at 10 m above ground [m/s]
vp Water vapor pressure (related to humidity) [hPa]
ΔTmrt Difference between mean radiant temperature and air temperature (Tmrt – Ta) [K]
cᵢ Regression coefficients determined from calibration of the UTCI model
ai, bi, ci, di Exponents corresponding to each term in the regression polynomial (i = 1 … 210)
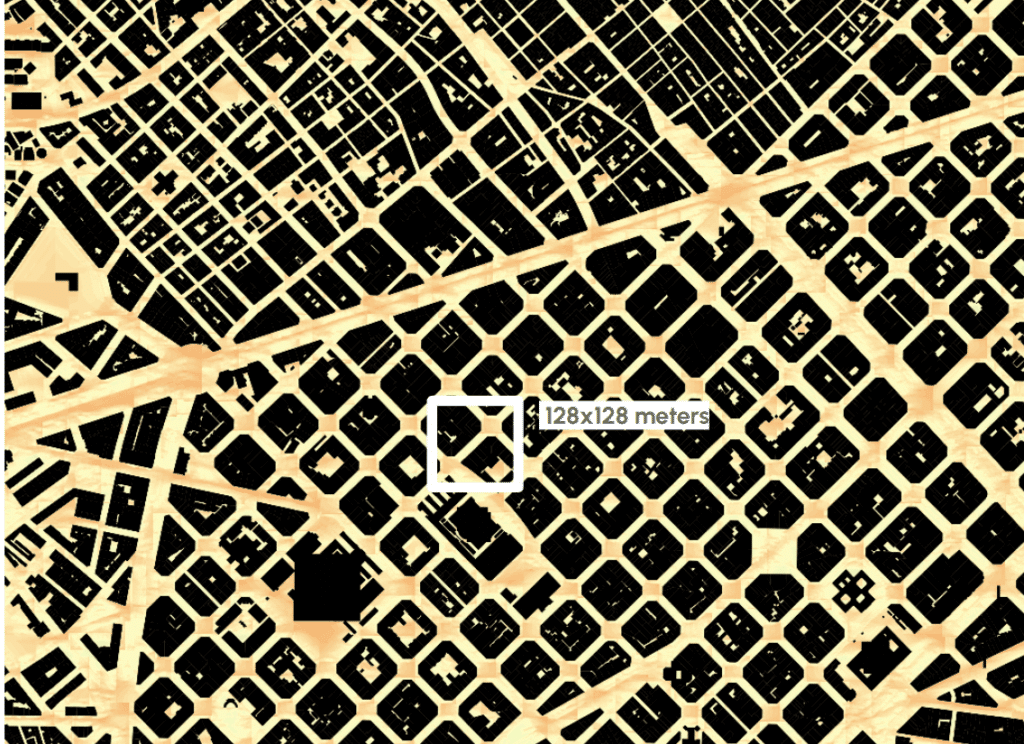
Barcelona: A homogeneous urban fabric, yet full of local variation
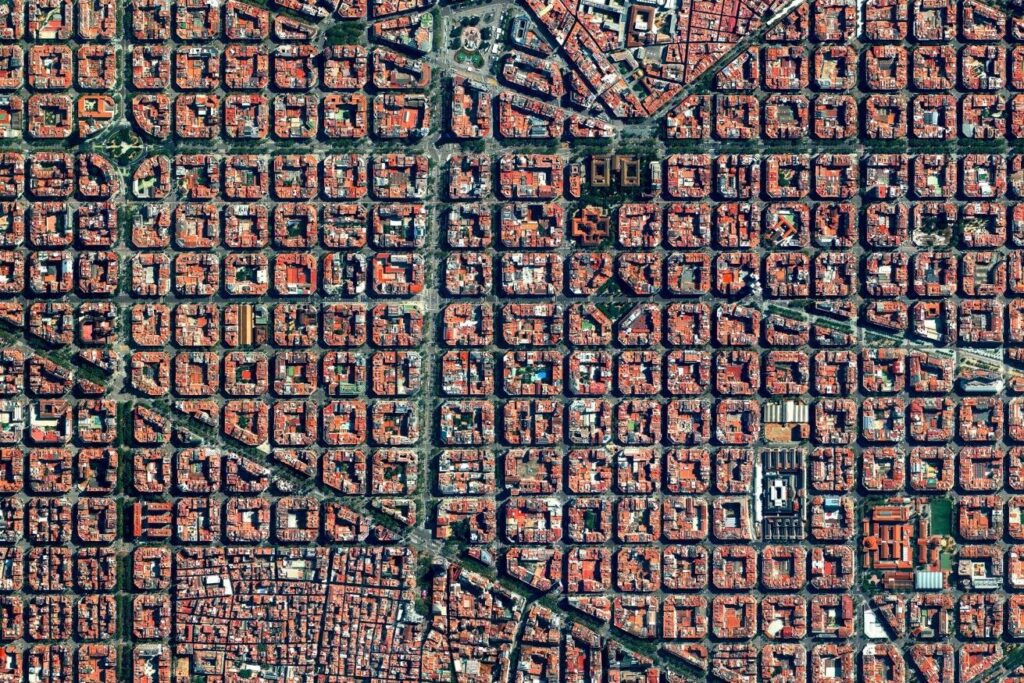
Barcelona was selected as a study site because its largely regular grid and consistent building morphology provide a controlled urban baseline, which helps isolate the effects of specific urban features on microclimate. At the same time, the city exhibits subtle, but meaningful variations in building height, street width, orientation, surface materials, and vegetation cover. These local differences create diverse microclimatic conditions, making it possible to observe how small-scale morphological and material variations influence thermal behaviour in outdoor spaces. This combination of consistency and variability makes Barcelona an ideal testbed for data-driven approaches: machine learning models can be trained to detect and analyze patterns related to thermal behaviour, while controlling for confounding factors inherent in more heterogeneous urban fabrics.
URBAN FEATURES: From Open Data to the Dataset
Workflow
This workflow outlines a structured methodology for transforming open geospatial datasets into a network analytical model using open source data. The process begins with the acquisition of raw data from Open Data BCN, the official open data platform of the City of Barcelona. The datasets include spatial and attribute information related to urban elements such as streets, buildings, trees, and land cover. These are provided in a variety of formats, including CSV, GeoJSON, SHP, GPKG, DXF, and other standard geospatial formats.
The initial phase of the workflow involves data preprocessing and spatial structuring using QGIS, a widely adopted open-source geographic information system. QGIS is utilized to visualize, clean, and convert the raw datasets into standardized formats suitable for computational analysis. Operations performed at this stage include coordinate system harmonization, urban elements geometry and relevant attribute fields extraction. At this stage attribute and spatial analyses were performed to expand the original dataset.
Once the spatial data has been prepared, it is imported, combined and analyzed into a Python environment. With the Python library NetworkX, spatial entities are represented as nodes, field attributes are encoded within each node. Spatial relationships, defined by proximity and adjacency are encoded as weighted edges. The final outputs of the workflow consist of structured files such as nodes.csv, edges.csv and geometry.geojson, which encapsulate both the topological structure and spatial attributes of the network.
These outputs can be imported into graph databases such as Neo4j for advanced querying, semantic enrichment, and interactive exploration, or visualized into platforms such as Rhino+Grasshopper, or QGis itself for visualization and urban design. So graph does not merely serve to build relationships between geometric elements; it also functions as a tool to match and integrate entities and their relations across a wide range of heterogeneous datasets, by providing a common relational structure.

Input
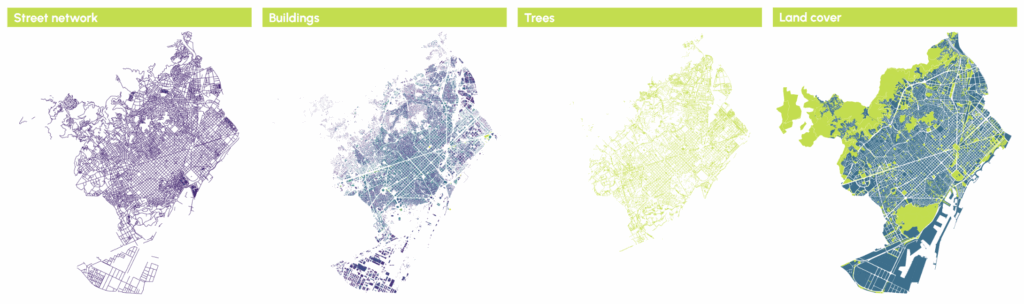
Street Network
The map illustrates the structure of Barcelona’s urban street network, enabling a visual interpretation of spatial connectivity and circulation. Roads and intersections are clearly delineated, forming the backbone of the city’s spatial organization. Each street segment is defined by its centerline geometry and attributes such as length, direction, and width, along with contextual properties including the number of trees located within the segment and the overall height of the buildings facing it.
Buildings
The buildings map displays the spatial distribution and density of built structures. The gradient from yellow to purple represents the overall height of each building.
The building layer attributes include the buildings’ height, their position, the street they are facing and the distance from the street itself.
Trees
This map displays in green the presence and spatial distribution of urban trees. The tree layer includes detailed attributes such as geographic position, species, canopy height, and diameter at breast height (DBH).
Landcover
The land cover map offers a classification of surface types, including vegetation, water bodies, pavement and building surfaces. Colors are used to distinguish between different land cover categories. Albedo and reflectivity are associated to each type of surface.
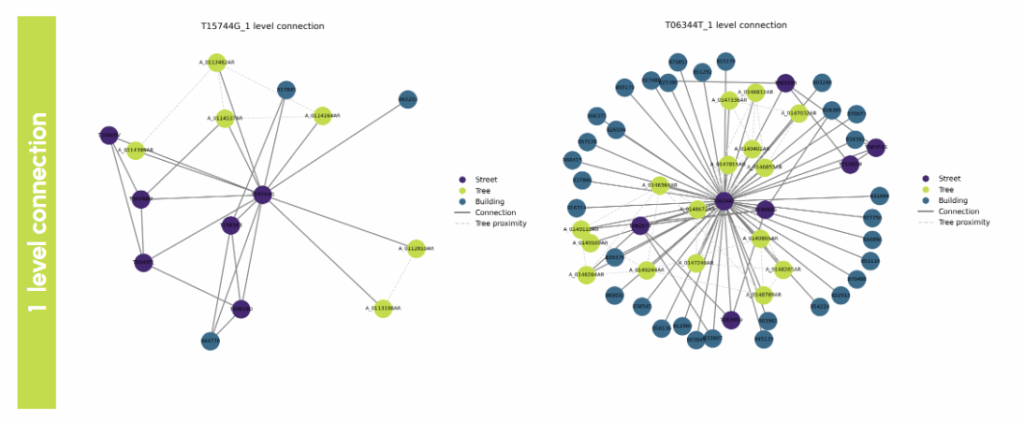
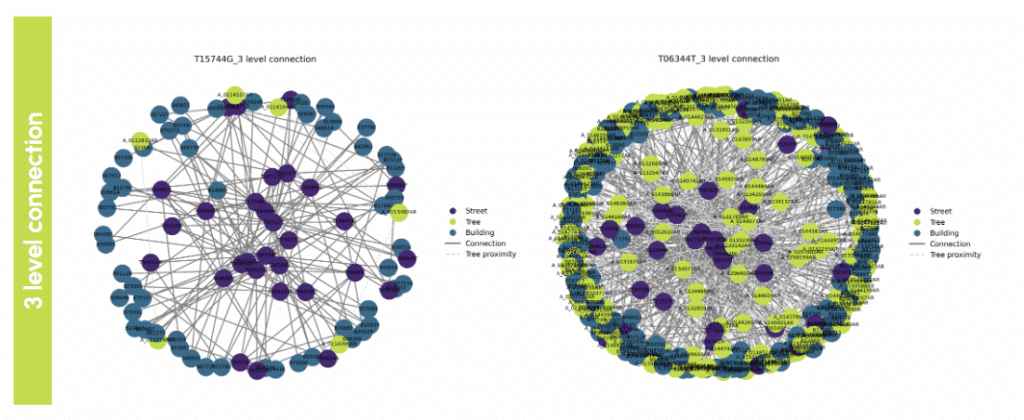
Topological Relationships
The graphs below show the spatial and relational relationship among three urban elements: streets, trees, and buildings.
Nodes are categorized by type and color-coded for clarity, purple for street segments, green for trees, and light blue for buildings. Each node is uniquely labeled, allowing for precise identification and traceability within the dataset.
The graph includes two types of edges: solid lines indicate spatial connections between entities, while dashed lines represent proximity relationships specifically among trees. This dual-edge system enables the representation of both structural and environmental relationships within the urban fabric.
By integrating spatial attributes and proximity logic, the graph supports multi-layered analysis of built environment interactions.
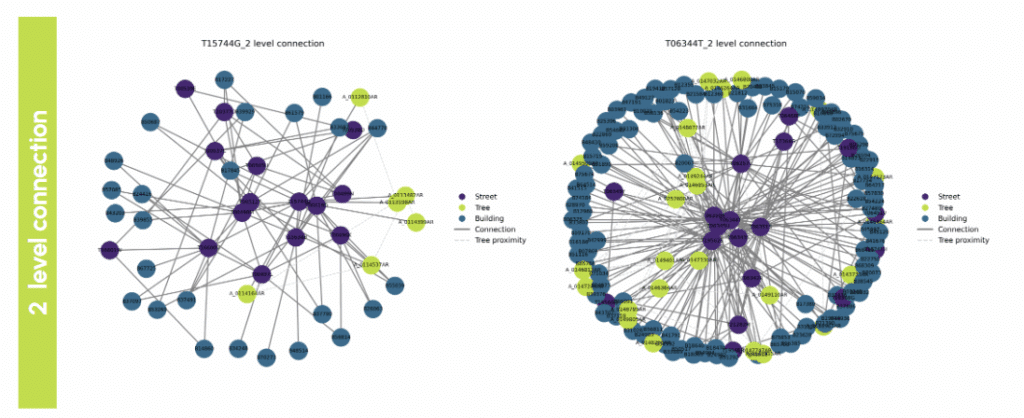
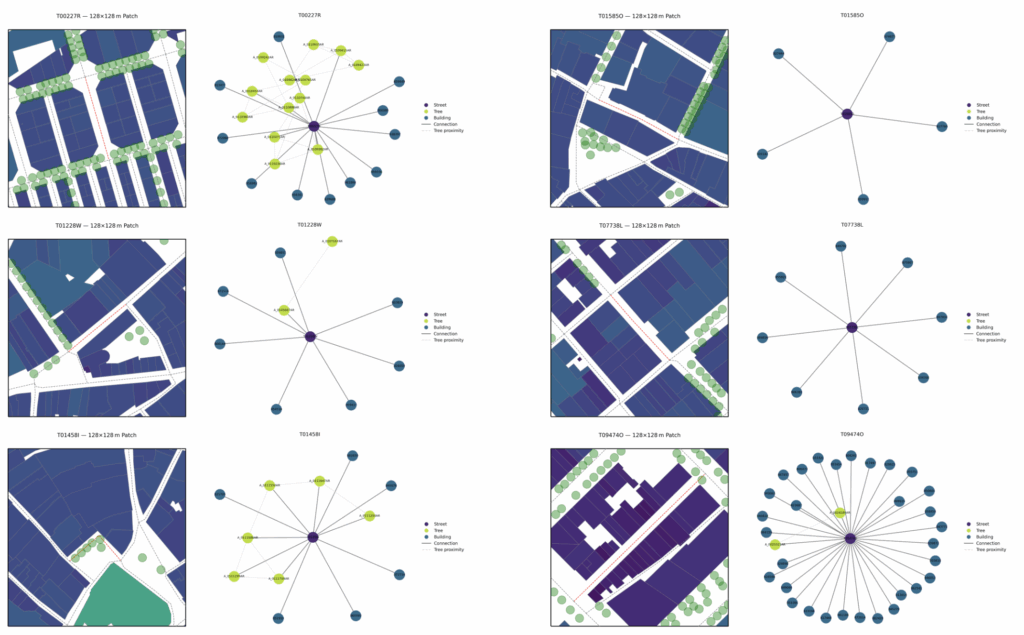
The following figures show the topological representation of some of the analyzed urban elements within a 128×128 meter patch, in relation to a particular street.
On the left, the map visualizes the geographic layout of streets, buildings, and trees. Lines indicate the street network, with the analyzed street in a red dashed line.
On the right, the corresponding network graph translates the spatial configuration into a node-edge structure, where the central node represents the analyzed street segment.
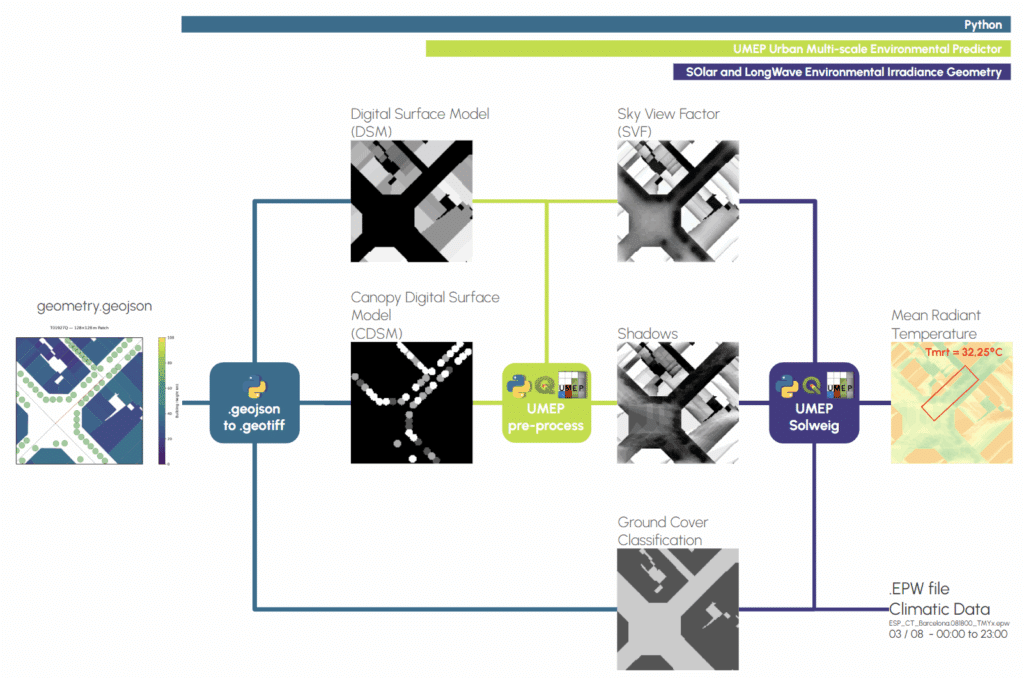
MRT Calculation
The analysis is done with the UMEP Urban Multi-scale Environmental Predictor plug-in for QGIS. SOLWEIG stands for SOlar and LongWave Environmental Irradiance Geometry model. It’s one of the modules available in the UMEP (Urban Multi-scale Environmental Predictor) plugin for QGIS, widely used in urban climate and environmental analysis. It calculates spatial variations in mean radiant temperature (Tmrt).
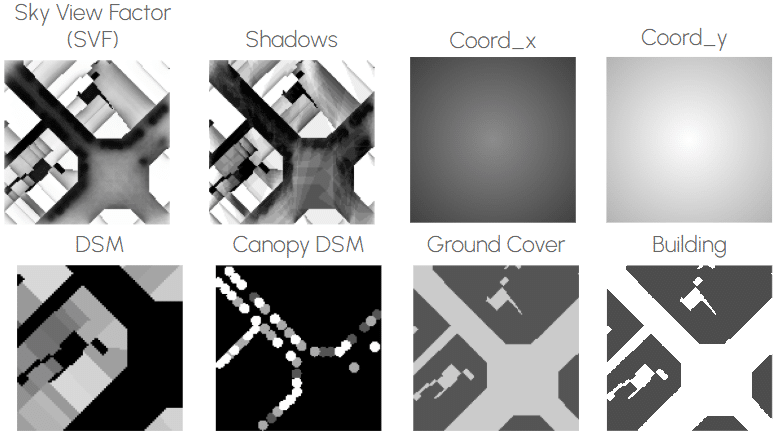
The process begins with a GeoJSON file containing the urban features as geometry of a selected urban patch. This geometry is converted into a Digital Surface Model (DSM) and a Canopy Digital Surface Model (CDSM) through a GeoJSON-to-GeoTIFF transformation, which encodes elevation data.
The models are pre-processed in QGis with the UMEP plug-in to calculate the Sky View Factor (SVF) and the shadows’ analysis.
All outputs, in a TIFF format, converge, together with the Ground Cover Classification (GCC) and the climatic data sourced from an EPW (EnergyPlus Weather) data file, within the Solweig module of UMEP, which performs the calculation of the Mean Radiant Temperature (Tmrt).
All spatial and environmental data collected throughout the workflow were analyzed using both a linear regression model and an XGBoost machine learning model, in order to evaluate the relative importance of each feature in influencing thermal behavior. The analysis includes a wide range of input variables, such as geometric attributes and vegetation metrics.
This approach enables a systematic comparison of how different morphological and environmental factors contribute to Mean Radiant Temperature (MRT), providing useful insight into the key drivers of outdoor thermal comfort. The target variable, Tmrt_Buffer_Mean, represents the average radiant temperature within each street, calculated using the UMEP Solweig model.
To evaluate the influence of each feature on the Mean Radiant Temperature, a Random Forest model is used. As shown in the feature importance chart, variables like the overall building height (BuildingHeight_Mean), the street orientation (ANGLE_rad), and the Height_Diff emerge as key predictors, while others such as The number of trees (Number_of_Trees) contribute less significantly. In parallel, an XGBoost model is tested to assess predictive performance, yielding a Mean Absolute Error (MAE) of 1.07 and an R² score of 0.31.
Results reveal that basic urban features alone, structured at a street level (e.g., orientation, green percentage, overall building height) are insufficient for the tested ML models to explain local MRT variation, highlighting the need for richer spatial representations and higher quality data.


Barcelona Mean Radiant Temperature Map: The Tiles Mosaic
A map of the city of Barcelona showing the complete mosaic of 14,381 street patches, each measuring 128×128 meters, and displaying calculated Mean Radiant Temperature (MRT) values.
These values were derived from microscale environmental simulations, generating a continuous thermal field that covers the entire urban fabric. The map enables the visualization of climatic variations at the street level, highlighting areas that are more exposed to solar radiation versus those benefiting from shading and enclosure.
This visualization serves a dual purpose. On one hand, it provides a spatially detailed representation of outdoor thermal comfort across a dense and morphologically complex city like Barcelona. On the other hand, it allows for the identification of spatial correlations between urban form and thermal stress. Higher MRT values tend to occur in areas with low vegetation cover, high solar exposure, and open spatial configurations, while lower values are typically observed along narrow streets, in the presence of tree canopies, or where building shadows reduce radiation during peak hours.
MACHINE LEARNING
Workflow to Mean Radiant Temperature Prediction
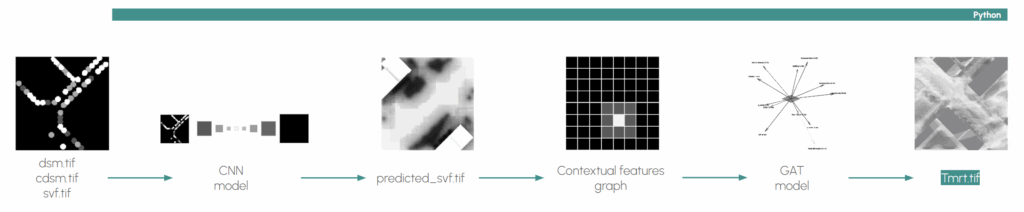
The process is structured as a two-stage hybrid model that integrates Convolutional Neural Networks (CNNs) and Graph Attention Networks (GATs). The rationale for this architecture is to combine the strengths of image-based spatial feature extraction with graph-based reasoning, enabling the model to learn both local and relational patterns that influence thermal behavior.
In the first stage, a CNN based on the U-Net architecture is used to predict the Sky View Factor (SVF) — a key environmental parameter that reflects the openness of the urban fabric to the sky, and which plays a central role in determining MRT. The CNN processes rasterized morphological inputs such as the Digital Surface Model (DSM) and Canopy DSM (CDSM), extracting spatial features and generating SVF maps at 1-meter resolution
In the second stage, a Graph Attention Network (GAT) is employed to predict the final MRT values, using the SVF predictions along with additional spatial and environmental features. Each urban patch is converted into a graph structure, where nodes represent 1 meter × 1 meter spatial cells and edges encode spatial adjacency. The GAT processes 15 input features per node, including SVF, solar exposure, vegetation, building height, orientation, and other context-aware descriptors. The network consists of 8 attention layers, enabling it to learn how the urban context of each cell influences its thermal condition.
This hybrid approach allows the system to model thermal behavior in a way that is both spatially fine-grained and aware of the relational structure of the urban environment. Once trained, the model is deployed within an interactive design environment, where it receives geometry and context data from Grasshopper, runs inference via a Flask-based Python server, and returns a predicted MRT map as a colored mesh for real-time visualization.
By integrating CNN and GAT architectures, the model bridges the gap between raw morphological data and microclimatic performance, offering a novel tool for climate-responsive design at the scale of buildings, blocks, and streets.
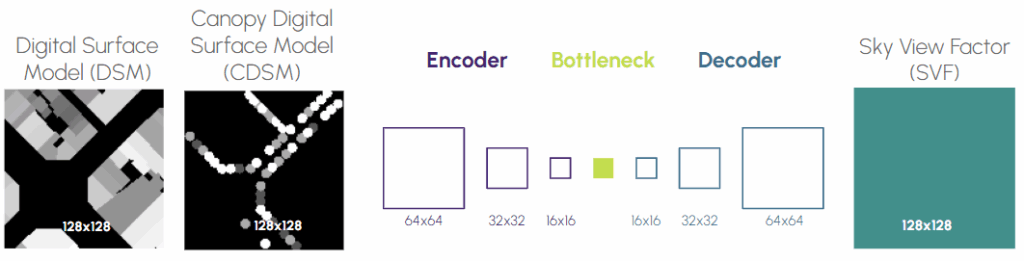
CNN – Convolutional Neural Network (U-Net) to predict SVF
# Merge Urban Structure Layers
32–64–128 conv layers
2 layer input
Input Layers:
Digital Surface Model (DSM)
Canopy Digital Surface Model (CDSM)
Filter progression:
The convolutional layers use 32 – 64 – 128 filters
Architecture:
An encoder with progressively down-sampling convolutional blocks
A bottleneck layer for compressed spatial representation.
A decoder with upsampling blocks and skip connections that preserve spatial detail
Output:
The model produces a high-resolution SVF raster, aligned with a 128×128 urban patch at 1 m resolution.
A Mean Absolute Error of 0.044, a Root Mean Square Error of 0.0647, and a coefficient of determination of 0.962 confirm that the CNN model prediction of SVF is accurate.
The histogram reveals a distribution centered around zero, while the scatter plot comparing predicted and expected SVF values demonstrates high correlation, with most points aligned along the ideal diagonal.
MAE: 0.044
RMSE: 0.0647
R²: 0.9612


Context: According to different parts of the city, the model performs differently as shown in the examples below.
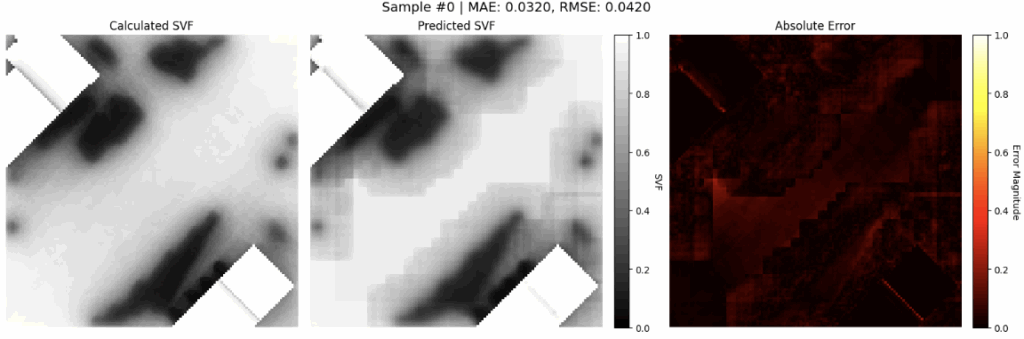
Wide Street: In a wide street layout, the model generally performs well. However, it shows reduced accuracy in areas farther from buildings, likely due to a loss of contextual reference. Still, the overall prediction error is minimal and remains within acceptable limits.
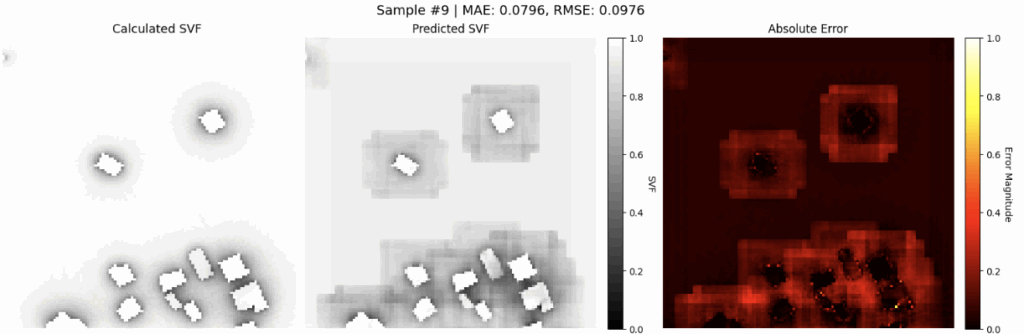
Street with isolated buildings: In layouts with isolated buildings, the model shows lower overall accuracy. Errors are particularly evident around the building edges, suggesting that the predictions are closely tied to the building footprint as a dominant feature.
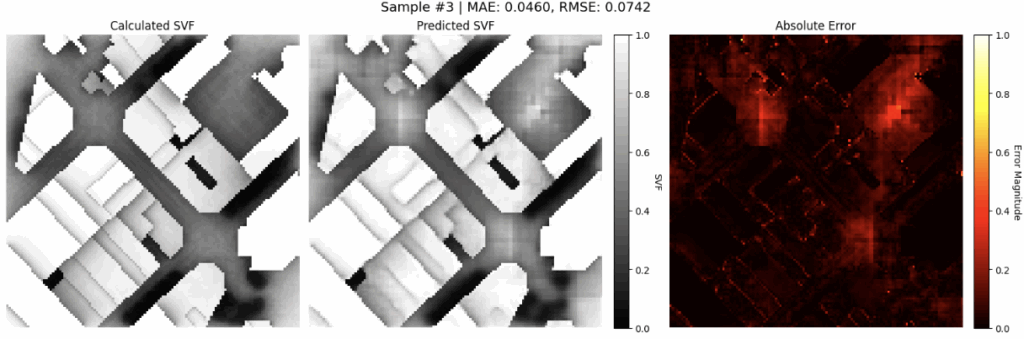
Typical Barcelona Block: In the typical Barcelona block layout, the model provides generally reliable predictions. However, it shows noticeable errors in the inner courtyards and at the street corners where buildings are more distant from each other. These areas seem to challenge the model due to reduced spatial enclosure and a lack of nearby features to anchor the prediction.
GAT – Graph Attention Network to predict Tmrt
15 channels
8 layer input
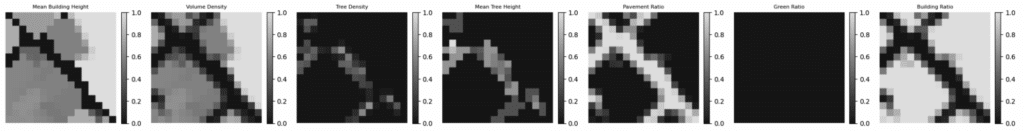
7 contextual urban features
- Building ratio
- Volume Density
- Mean Building Height
- Tree Density
- Mean Tree Height
- Green Ratio
- Pavement Ratio
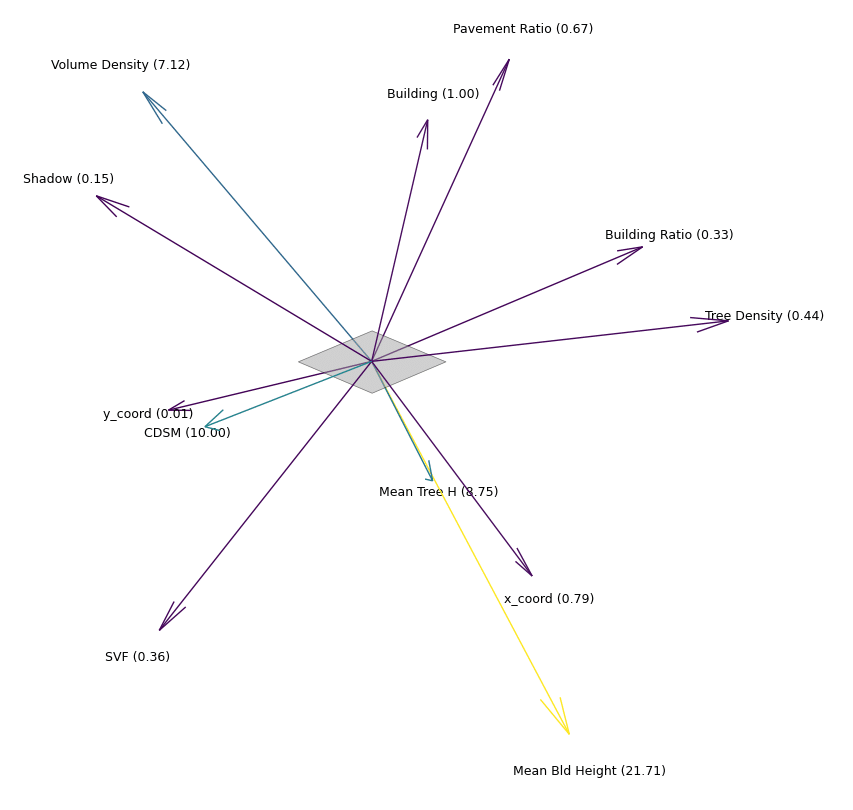
The scatter plot compares predicted and true Tmrt values, showing a dense alignment along the ideal diagonal (y = x), indicating strong model performance.
Quantitative metrics confirm this accuracy, with MAE = 0.449, RMSE = 0.606, and R² = 0.964.
MAE : 0.4495
RMSE : 0.6964
R² : 0.9668


Context: According to different conditions, the model performs differently as shown in the examples below.
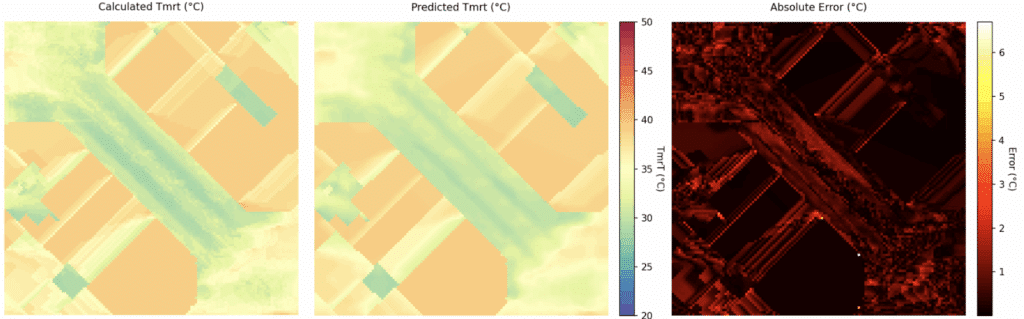
South-facing facades: The ML prediction results appear promising, with a generally accurate understanding of building geometry, tree placement, and orientation. However, there are some notable discrepancies near the south-facing façade, where the model shows larger errors.
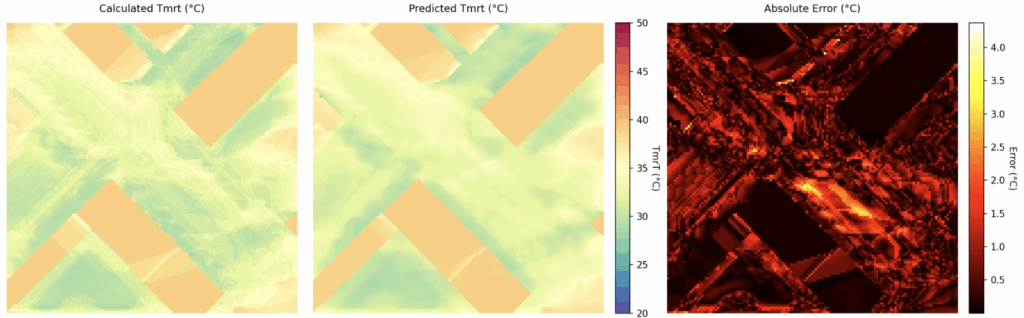
Sparse areas: Larger errors are observed in sparse areas, particularly near the south-facing façade. In regions further from prominent features, the model appears to rely more on inference than on relevant data, leading to reduced accuracy.
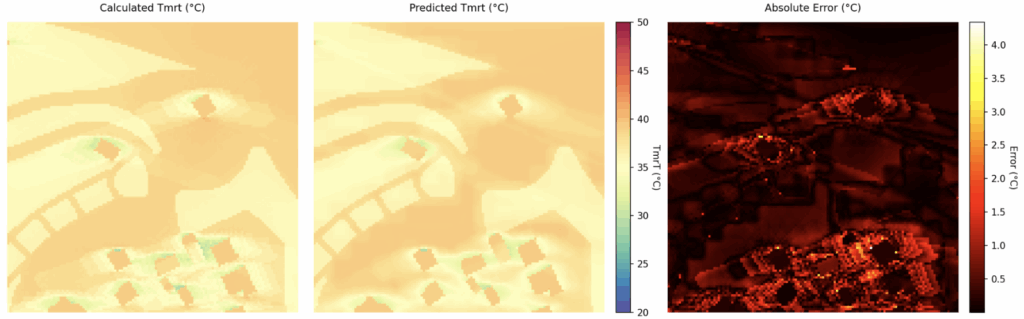
Isolated buildings: In the less dense layout, the ML model successfully identifies differences in ground coverage materials. However, it still struggles with accuracy around isolated buildings, especially near the south-exposed façade.
INTERACTION
To support spatial exploration and facilitate user interaction with the urban dataset, an interactive HTML map was developed. This map allows users to navigate the city of Barcelona, visualizing the computed Mean Radiant Temperature (MRT) across the entire urban fabric at high spatial resolution. Users can zoom, pan, and explore different districts, identifying zones of thermal stress or comfort.
A key feature of the interface is the ability to select individual street segments directly on the map. Upon clicking a street, the system retrieves its unique identifier and enables further processing.
By embedding this interactive map within the workflow, the tool bridges geospatial visualization and parametric modeling, enabling users to initiate design and analysis tasks from a simple interface.
Predictive Analysis on the User Selected Street
The visualization process begins with a spatial map of Mean Radiant Temperature (MRT) over the urban fabric of Barcelona. Users can select individual street segments directly from this map to query their associated thermal performance. Upon selection, the corresponding street code is used as input for a custom Python script that generates the necessary dataset for downstream analysis. This script creates a folder containing the geometry in .geojson format and a statistical summary in .csv format, both describing the spatial and environmental characteristics of the selected segment.
Shadow Calculation
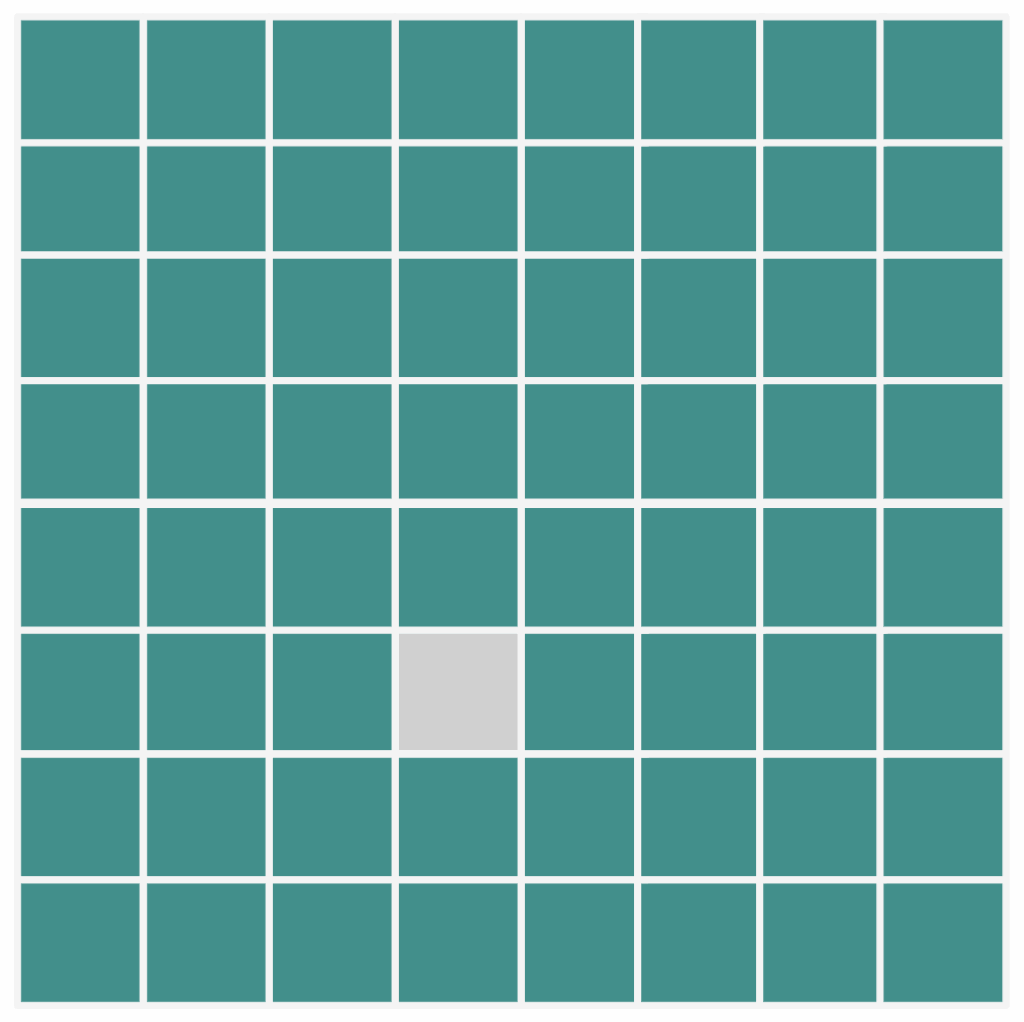
This folder is directly connected to a Rhino–Grasshopper environment, where the .geojson files are read and translated into a parametric 3D model of the street patch. The model is then analyzed using a solar radiation simulation for a single day,August 3rd, selected as a representative summer condition. A uniform 128×128 mesh overlays the patch, and for each mesh cell, the analysis computes the normalized number of hours of solar exposure.
The result is a matrix of values that quantifies solar radiation distribution across the patch. This matrix is used to visually encode the performance data in 3D, allowing the user to perceive the intensity and spatial distribution of solar exposure. Through this process, the system enables direct visual exploration of how urban geometry influences thermal behavior at the street scale.
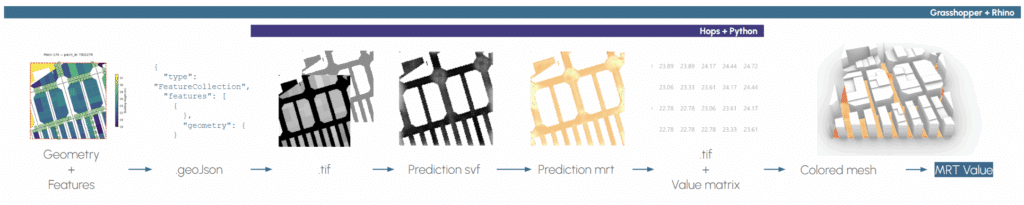
Workflow & Visualization
Once the solar exposure and shadow data are computed, the next step involves passing this information to a Flask-based Python server using Grasshopper Hops. This connection enables the transmission of geometry and simulation results to a backend processing pipeline, where additional data preparation and prediction tasks are carried out.
Within the server, a Python script processes the incoming data to generate georeferenced .tif raster files representing the geometry and associated environmental layers. Simultaneously, it extracts a set of contextual features required for model inference, including spatial relationships, shading conditions, and surface characteristics.
These datasets are then used to run a two-stage deep learning prediction pipeline. First, a Convolutional Neural Network (CNN), trained to estimate Sky View Factor (SVF) from spatial and environmental data, produces a raster map of SVF values. This intermediate output captures the degree of sky obstruction at each point within the urban patch.
Next, the predicted SVF map and other contextual features are passed into a Graph Attention Network (GAT) model, trained to predict Mean Radiant Temperature (MRT). The GAT model leverages the spatial graph representation of the urban form to refine predictions based on morphological relationships and learned thermal behavior patterns.
The output of this process is a matrix of predicted MRT values, which is returned to the Grasshopper environment. These values are then visualized as a colored mesh, with each face of the 128×128 grid shaded according to its corresponding MRT value.
This final visualization step provides an immediate, spatially explicit representation of mean radiant temperature, enabling designers to interpret, compare, and respond to heat-related phenomena within the urban context.
Real-time Mean Radiant Temperature Prediction
At this stage, the system enables direct geometric interaction within the design environment. Users can add or remove buildings, introduce or modify trees and green spaces in real time.
Each intervention dynamically updates the underlying data structure and triggers a new prediction cycle through the integrated pipeline. As a result, the impact of design decisions on Mean Radiant Temperature (MRT) can be immediately visualized across the entire patch, with a spatial resolution of 1 meter.
This level of interactivity transforms the model from a passive evaluation tool into an active design companion, allowing users to iteratively explore, test, and optimize spatial configurations with full awareness of their thermal implications.
Designers, planners, and municipal authorities can use the system to assess the benefits or challenges associated with specific interventions, such as densification, tree planting, or open space redesign, based on quantifiable and spatially explicit thermal comfort feedback.
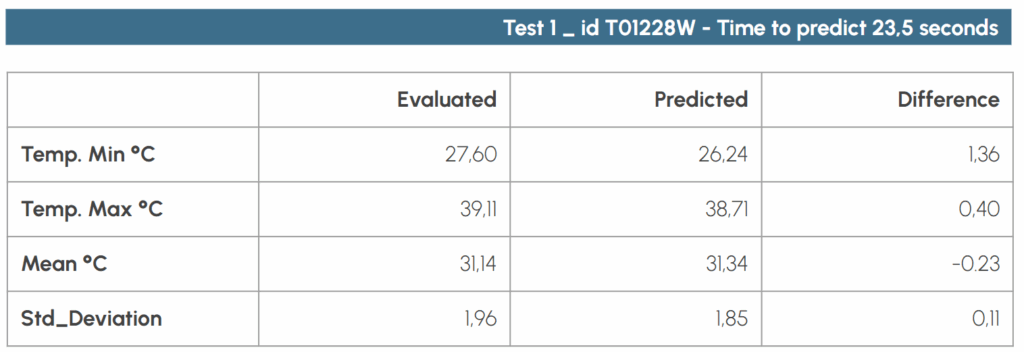
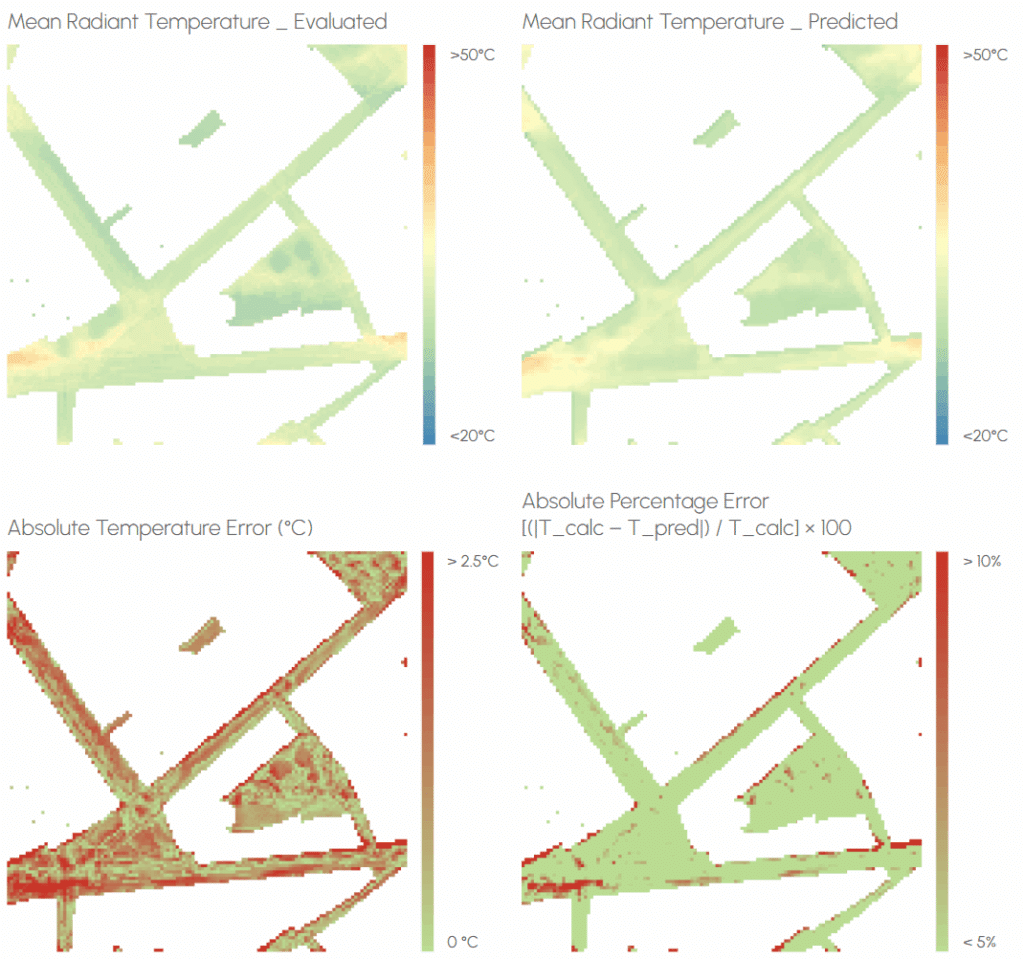
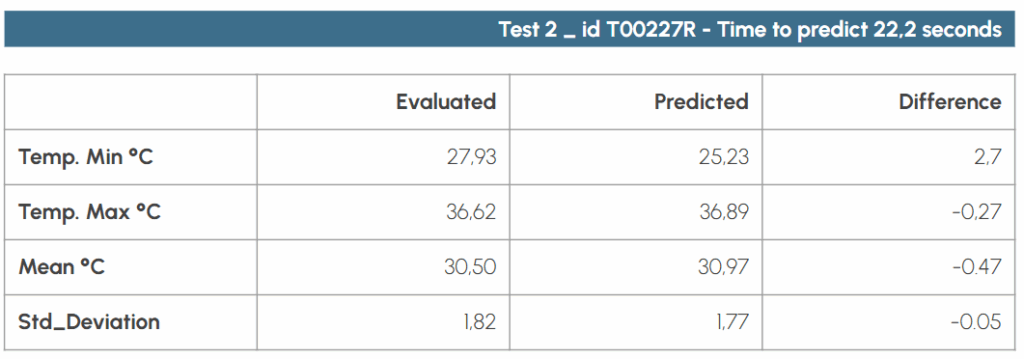
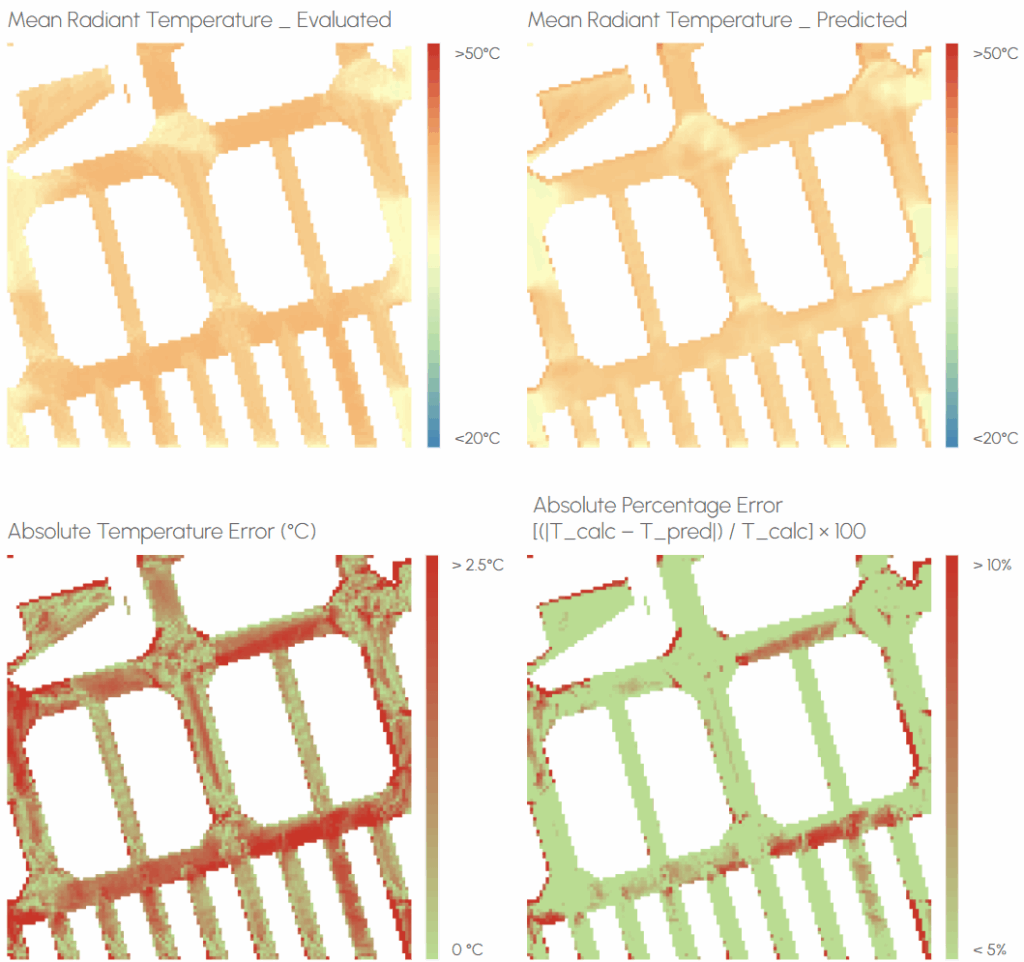
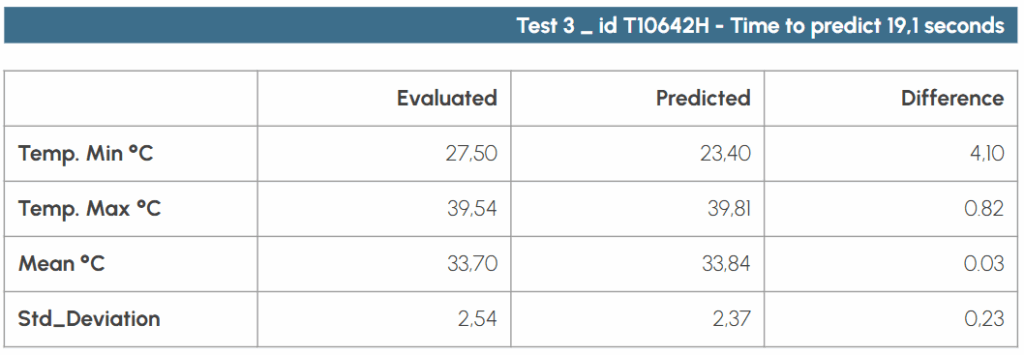
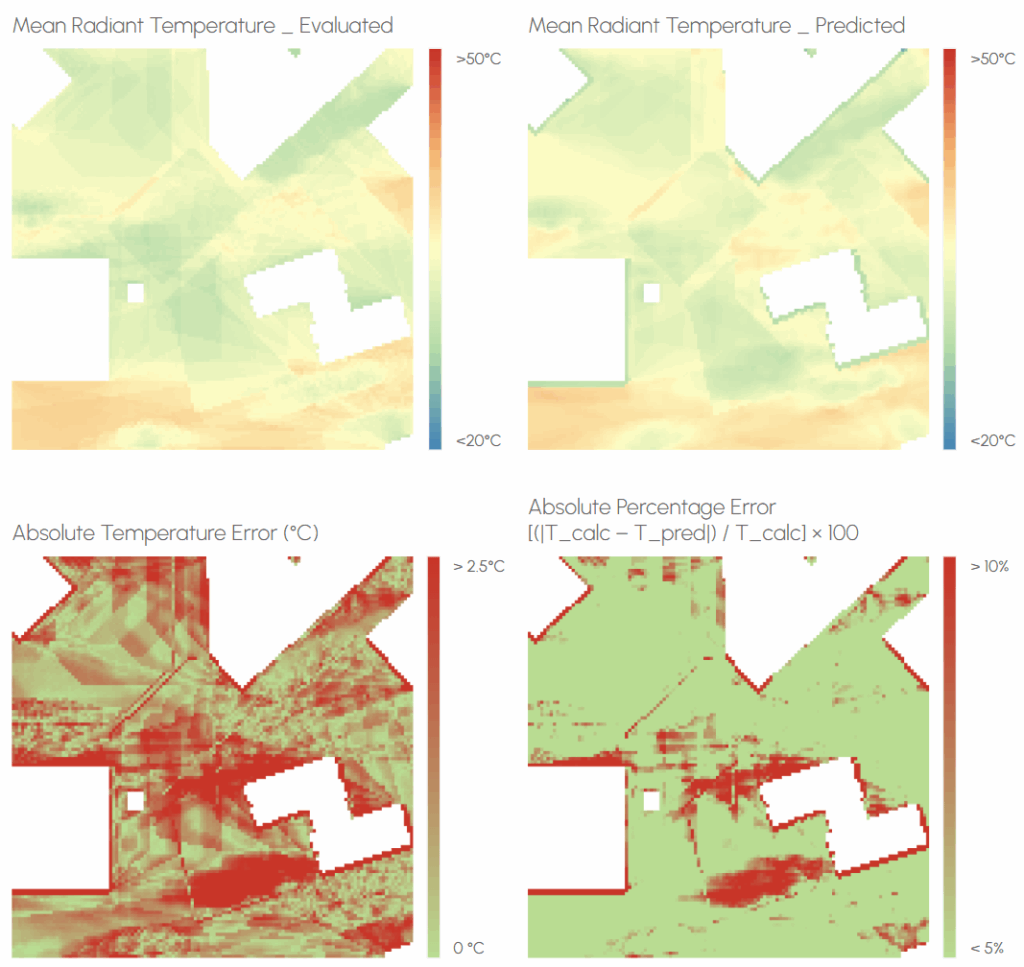
Model Validation
To evaluate the accuracy of the proposed machine learning model, we compared the predicted Mean Radiant Temperature (MRT) outputs with reference MRT values calculated using the SOLWEIG a module of the UMEP plugin in QGIS, the same used in the original calculation.The reference dataset was generated under the same environmental and morphological conditions, ensuring alignment in terms of spatial resolution (1 m) and input parameters.
The comparison was performed on a cell-by-cell basis across a representative set of urban patches. For each patch, we computed both the absolute temperature difference (ΔMRT) and the normalized squared error between predicted and simulated values.
To interpret model performance, we adopted two evaluation thresholds:
A temperature difference threshold of 2.5 °C, beyond which discrepancies were considered significant in the context of outdoor thermal comfort.
Two bands of relative error:
≤ 5%: considered acceptable
5–10%: considered moderately acceptable
10%: considered outside the acceptable range
The results of the evaluation process allowed us to identify both well-performing areas and spatial zones where the model under or overestimated thermal values. This analysis was essential for validating the predictive capacity of the system and for understanding the limitations related to input data quality, model generalization, and urban complexity.
CONCLUSION
This thesis is set out to investigate a fundamental and urgent question: How does urban form shape outdoor thermal comfort, and how can this relationship be made visible and actionable during the design process? In the face of rising urban temperatures and increasing environmental stress, the ability to understand and anticipate microclimatic behavior is no longer optional.
The first phase of the research focused on identifying the urban features that most strongly influence thermal conditions in Barcelona. Through the use of open spatial data and climate simulations, it became possible to extract how geometry, orientation, materials, and vegetation correlate with Mean Radiant Temperature (MRT).
A key element of this phase was the implementation of graph structures to relate and organize the various elements of the urban fabric, connecting streets, buildings, and trees. This graph served not only as a spatial representation but as a tool to bring structure and order to diverse and heterogeneous open datasets, which often lack clear relationships between features. By encoding spatial connectivity and proximity, the graph enabled a consistent framework for integrating geometry, simulation, and urban features.
However, correlation analysis between urban features and MRT values at the street scale revealed that there is no consistent relationship between basic descriptors, such as street orientation, percentage of greenery, or average building height, and outdoor thermal performance.
This limitation points to the need for either higher-quality environmental and geometric data, or more sophisticated methods to embed spatial and contextual knowledge into the representation of each street segment. The graph-based approach developed in this thesis offers a first step in that direction, providing a structure capable of organizing fragmented open datasets and establishing spatial relationships between different urban elements.
Looking forward, the use of topological graphs could provide a more robust framework — one that doesn’t simply connect data, but begins to capture the relational logic of urban systems. Such a model could represent not just spatial proximity, but more meaningful relationships such as adjacency, enclosure, visibility, and connectivity, moving beyond geometry alone. In this sense, topology becomes a tool to encode how spaces interact, and how the form of the city actively drives its microclimate.
To move beyond explanation toward prediction, the thesis explored the potential of machine learning models to capture complex spatial-thermal relationships at human scale. By combining Convolutional Neural Networks (CNNs) and Graph Attention Networks (GATs), a predictive framework was developed that learns how spatial configurations and material influence MRT. These models effectively translated spatial patterns into climate outputs, offering a flexible and extensible approach. Yet, they too rely on city specific and aligned datasets and require careful calibration before being applied in new settings.
The final phase of the project asked: What if we could see the climate impact of our design decisions while we are designing? This led to the development of an interactive workflow, where geometry and climate prediction are linked in real time. By connecting parametric modeling environments (Rhino and Grasshopper) with trained machine learning models via a lightweight server architecture, the system enables users to modify urban form and instantly visualize how these changes affect local thermal comfort. It allows designers, planners, and municipalities to explore alternatives, test ideas, and understand the implications of their decisions at a resolution that aligns with the human experience of the city.
What’s next?
The work presented is not a final product, but the prototype of a new kind of design tool, a workflow that goes beyond analysis to become a design partner. A tool that helps us not only to draw forms, but to shape thermal comfort, and urban livability.
The next challenge is to embed such tools into real design case workflows., to make them accessible, robust, and generalizable across cities and climates. To ensure that they not only predict, but guide and respond, empowering us to design cities that are not only functional and beautiful, but able to adapt to a changing climate.
In a time where the thermal performance of urban space can no longer be treated as an afterthought, this thesis proposes a path forward: one where environmental intelligence is built into the design process, able to connect the design at the building level to the urban design scale.
BIBLIOGRAPHY
- Błażejczyk, K., Jendritzky, G., Bröde, P., Fiala, D., Havenith, G., Epstein, Y., Psikuta, A., & Kampmann, B. (2013a). An introduction to the Universal Thermal Climate Index (UTCI). Geographia Polonica, 86(1), 5–10. https://doi.org/10.7163/gpol.2013.1
- Chang, S., Saha, N., Castro-Lacouture, D., & Pei-Ju Yang, . (2019). Generative design and performance modeling for relationships between urban built forms, sky opening, solar radiation and energy. Energy Procedia, 158, 3994–4002. https://doi.org/10.1016/j.egypro.2019.01.841
- Colaninno, N., Salvati, A., Lopez-Besora, J., & Morganti, M. (2025). District-scale cumulative heat stress mapping using very-high-resolution spatiotemporal simulation. Sustainable Cities and Society, 130, 106498. https://doi.org/10.1016/j.scs.2025.106498
- Dirksen, M., Ronda, R. J., Theeuwes, N. E., & Pagani, G. A. (2019). Sky view factor calculations and its application in urban heat island studies. Urban Climate, 30, 100498. https://doi.org/10.1016/j.uclim.2019.100498
- Duering, S., Chronis, A., & Koenig, R. (2020). Optimizing urban systems: Integrated optimization of spatial configuration. In Proceedings of the Symposium on Simulation for Architecture and Urban Design (SimAUD 2020). https://simaud.org/2020/proceedings/109.pdf
- Hoang, N.-D., & Nguyen, Q.-L. (2025). Geospatial Analysis and Machine Learning Framework for Urban Heat Island Intensity Prediction: Natural Gradient Boosting and Deep Neural Network Regressors with Multisource Remote Sensing Data. Sustainability, 17(10), 4287. https://doi.org/10.3390/su17104287
- Jendritzky, G., Maarouf, A., Fiala, D., Staiger, H., Wetterdienst, D., & Canada, E. (n.d.-b). J5B.4 AN UPDATE ON THE DEVELOPMENT OF A UNIVERSAL THERMAL CLIMATE INDEX. https://www.utci.org/resources/develop_utci.pdf
- Lindberg F, Grimmond CSB, Gabey A, Huang B, Kent CW, Sun T, Theeuwes N, Järvi L, Ward H, Capel- Timms I, Chang YY, Jonsson P, Krave N, Liu D, Meyer D, Olofson F, Tan JG, Wästberg D, Xue L, Zhang Z (2018) Urban Multi-scale Environmental Predictor (UMEP) – An integrated tool for city-based climate services. Environmental Modelling and Software.99, 70-87 https://doi.org/10.1016/j.envsoft.2017.09.020
- Komi Bernard Bedra, Zheng, J., Li, J., Sun, Z., & Zheng, B. (2023). Automating Microclimate Evaluation and Optimization during Urban Design: A Rhino–Grasshopper Workflow. Sustainability, 15(24), 16613–16613. https://doi.org/10.3390/su152416613
- Li, Y., Zhou, X., & Pan, M. (2022, January 3). Graph Neural Networks in Urban Intelligence. https://doi.org/10.1007/978-981-16-6054-2_27
- Naboni, E., Meloni, M., Coccolo, S., Kaempf, J., & Scartezzini, J.-L. (2017). An overview of simulation tools for predicting the mean radiant temperature in an outdoor space. Energy Procedia, 122, 1111–1116. https://doi.org/10.1016/j.egypro.2017.07.471
- Naboni, E., Natanian, J., Brizzi, G., Florio, P., Chokhachian, A., Galanos, T., & Rastogi, P. (2019). A digital workflow to quantify regenerative urban design in the context of a changing climate. Renewable and Sustainable Energy Reviews, 113, 109255. https://doi.org/10.1016/j.rser.2019.109255
- Pacheco Diéguez, A., Duckart, C., Coccolo, S., Dahman, S., Dubois, M.-C., & Background. (n.d.). URBAN THERMAL COMFORT STUDY Kiruna square (68°N 22°E) WRL (0500478500) -DIGITAL DESIGN AND BIM. Retrieved September 14, 2025, from
- Reinwald, F., Thiel, S., Kainz, A., & Hahn, C. (2024). Components of urban climate analyses for the development of planning recommendation maps. Urban Climate, 57, 102090–102090. https://doi.org/10.1016/j.uclim.2024.102090
- Wu, Z., Li, M., Liu, W., Jack, Wang, Z., Helen, Huang, C., & Hou, F. (2025). Developing surrogate models for the early-stage design of residential blocks using graph neural networks. Building Simulation. https://doi.org/10.1007/s12273-025-1237-7
- Xia, Y., Lu, W., Peng, Z., Lou, J., Huang, J., & Niu, J. (2025). Understanding the impacts of space design on local outdoor thermal comfort: An approach combining DepthmapX and XGBoost. Energy and Buildings, 115451–115451. https://doi.org/10.1016/j.enbuild.2025.115451
