Project Concept
Establishing a Martian food colony around a Mohole, designed based on growth morphology of alfalfa for efficient organization and development using L-systems. These terminologies are further explained below.
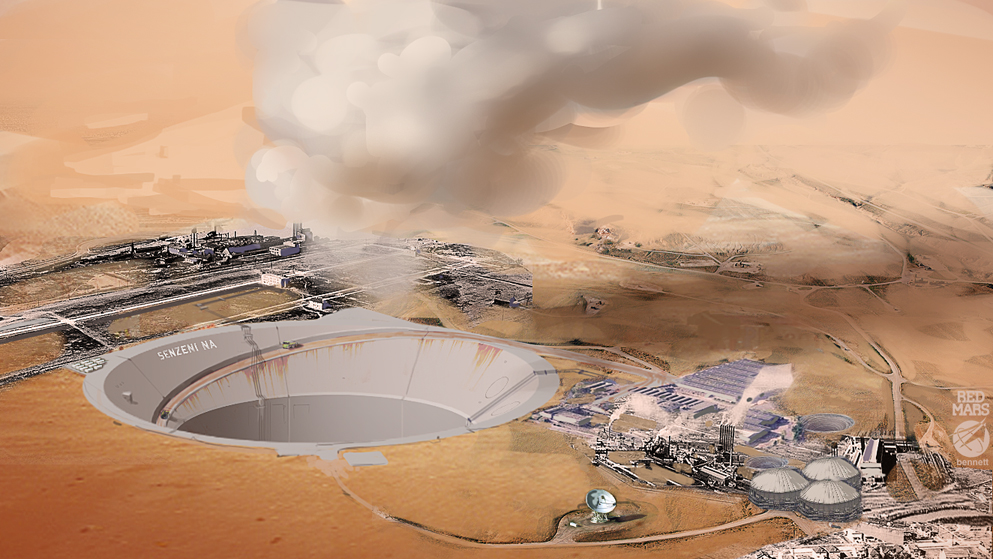
Moholes
Moholes on Mars are massive cylindrical excavations in the regolith, reaching up to 1 km in diameter and 7 km in depth. With temperatures surpassing 49°C and increased pressure at the bottom, they create a human-friendly environment. The excavation process also extracts valuable ores. Moholes act as natural heating systems and atmospheric ventilators, contributing to terraforming. Their construction near volcanic uprises harnesses updrafts, releasing heat and creating visible thermal plumes. Downwind areas experience clear air, showcasing moholes’ significant role in Martian environmental adaptation.
-Red Mars, Kim Stanley Robinson
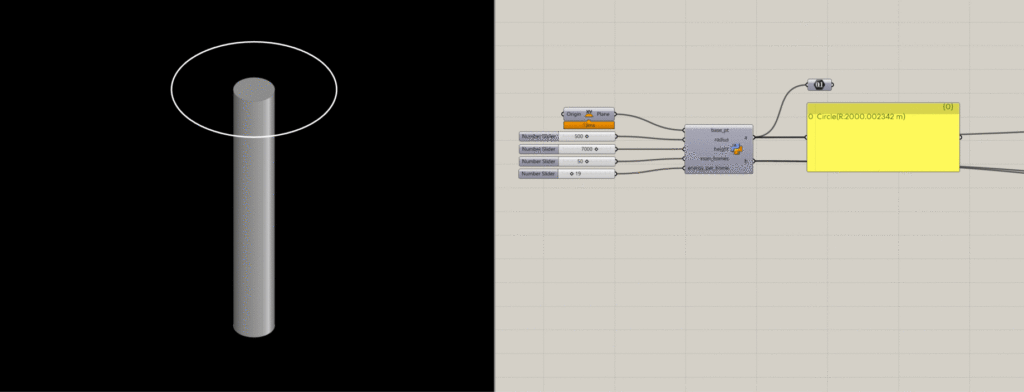
We started to look at the concept of the mohole to add a bit more science or fact to them, so we decided to reverse engineer the details from the book to create a formula that was relative to all the factors. The resultant python script through grasshopper is to calculate the heating radius around a Mohole based on several parameters. The script considers the size of the Mohole, the number of homes it needs to heat, and the energy requirement per home to eventually give out a resultant radius.
The calculate_heating_radius function is responsible for computing the heating radius. It takes the following parameters:
- radius: Radius of the Mohole cylinder.
- height: Height of the Mohole cylinder.
- num_homes: Number of homes that need heating.
- energy_per_home: Daily energy requirement per home (in kWh).
- ref_radius: Reference radius of the original Mohole used for comparison.
- ref_height: Reference height of the original Mohole used for comparison.
Constants:
- energy_output: The energy output per square meter from the Mohole’s surface, assumed to be 610 W/m².
- seconds_per_day: The number of seconds in a Martian day (a “sol”), calculated as 24.65 hours × 60 minutes × 60 seconds.
Cylinder Area Calculation:
- The script calculates the surface area (new_area) of the top of the Mohole cylinder using the formula for the area of a circle (? * radius²).
- Scale Factor Based on Area and Height:
- area_ratio: The ratio of the new Mohole’s surface area to the reference Mohole’s surface area.
- height_ratio: The ratio of the new Mohole’s height to the reference Mohole’s height.
- The scale factor is the product of these two ratios, representing how the size of the new Mohole compares to the original one.
Total Energy Requirement:
The total daily energy requirement for all homes is calculated by multiplying the number of homes, the energy requirement per home, and the number of seconds in a Martian day.
Heating Radius Calculation:
The heating radius is calculated using the formula sqrt((area_ratio * height_ratio * energy_output * ? * 10?) / total_energy_required). This formula accounts for the increased heating capacity with larger Mohole size (area and height) but reduced heating capacity with greater energy requirements.
Input Validation:
The script checks if the provided base_pt (base point for the Mohole) is a valid Plane and that other inputs like radius, height, num_homes, and energy_per_home are positive.
Cylinder and Heating Circle Creation:
A cylinder representing the Mohole is created, extending in the negative Z direction from the origin point. Its dimensions are based on the given radius and height.
A circle representing the heating radius is created at the origin point with the calculated radius.
Outputs:
- a: The circle representing the heating radius.
- b: The cylinder representing the Mohole.
Formula Explanation
The key formula in the script calculates the heating radius:
\text{heating_radius} = \sqrt{\frac{\text{area_ratio} \times \text{height_ratio} \times \text{energy_output} \times \pi \times 10^6}{\text{total_energy_required}}}
- Area Ratio (area_ratio): Compares the new Mohole’s surface area to that of a reference Mohole. A larger area ratio implies a larger Mohole, capable of heating a larger area.
- Height Ratio (height_ratio): Similar to the area ratio, but for the Mohole’s height. A taller Mohole can also heat a larger area.
- Energy Output (energy_output): The constant energy output per square meter from the Mohole’s surface.
- Total Energy Required (total_energy_required): The sum of the energy requirements for all homes. Higher energy requirements or more homes reduce the heating radius.
The formula incorporates these factors to calculate the heating radius. A larger Mohole (in terms of area and height) increases the heating radius, while higher energy requirements per home or more homes decrease the heating radius. The result is a balance between the Mohole’s capacity and the demand placed upon it.
L-System
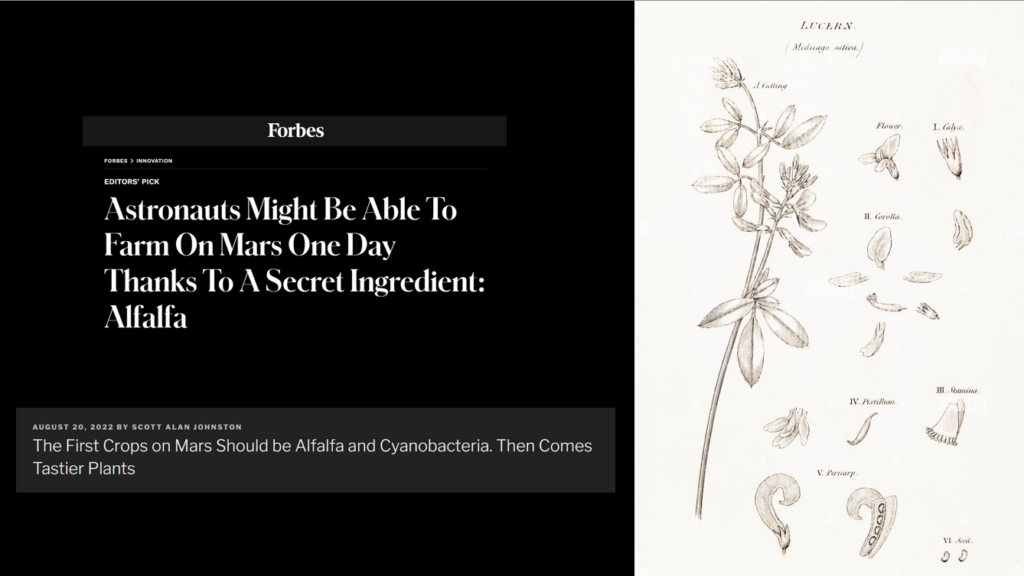
Our main intention of solving how we are approaching martian ground Is based on the abstraction of the growth logic of plants, inspired by diagrams made by Charles Waldheim and Agrarian Urbanism. This looks at an urban plan that is a reflection of the place or in particular, the dominant food culture of the place. Designing on a new planet without a history we started to think about what sort of crop could start to shape the future culture of the colony, which led to the discovery of the Alfafa plant.
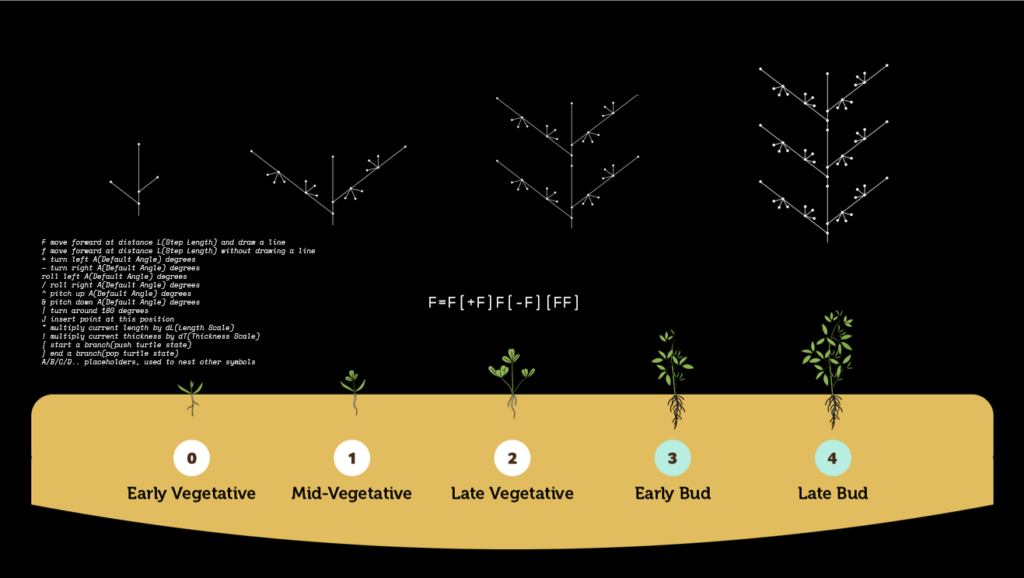
L-systems, also known as Lindenmayer systems after their creator Aristid Lindenmayer (1925-1989), enable the creation of intricate forms through iterative processes. They employ a formal mathematical syntax where a starting sequence of symbols undergoes repeated transformations based on a set of rules, with the outcomes utilized to produce geometric shapes. This allowed us to recreate the growth morphology of the Alfafa plant for development of our colony urban plan.

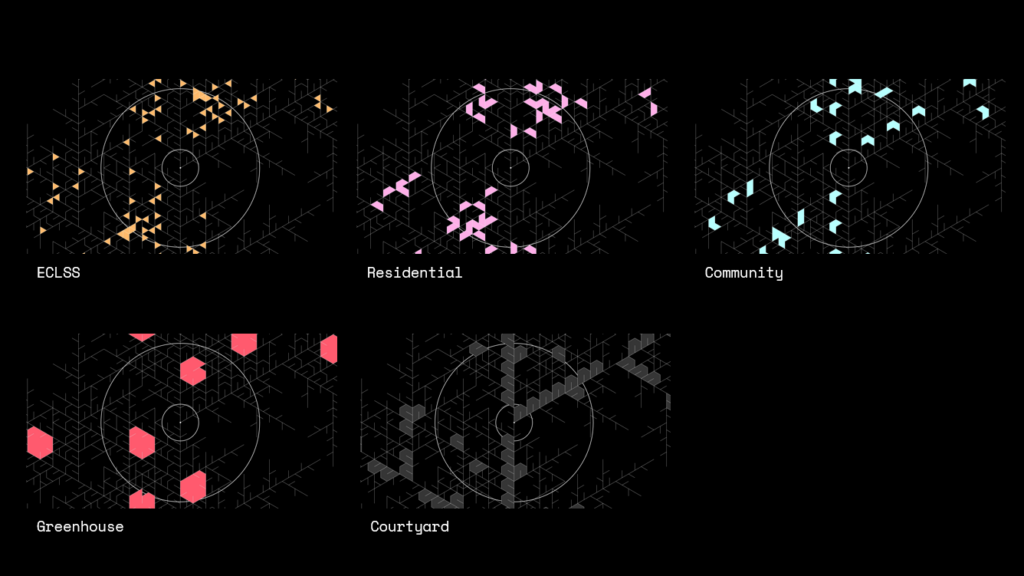
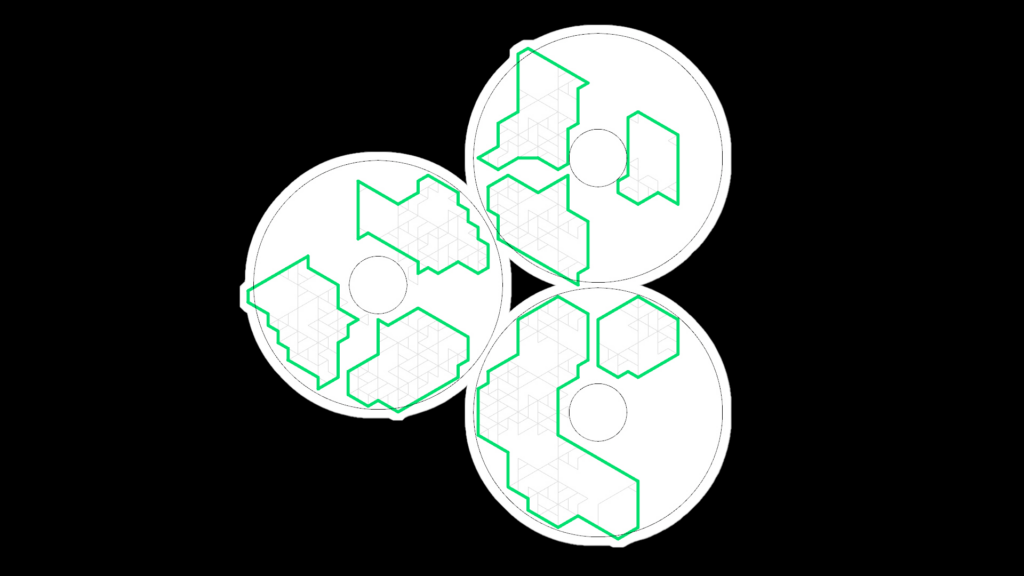
From that we start to derive the bounded regions as our programmable space within the resultant cluster, and from those regions we start to define an area range for the different programs, for example 33m2 to 50m2-Residential Units, and a different area zoned for the courtyards for light penetration. Thereby automating the plan and zoning.
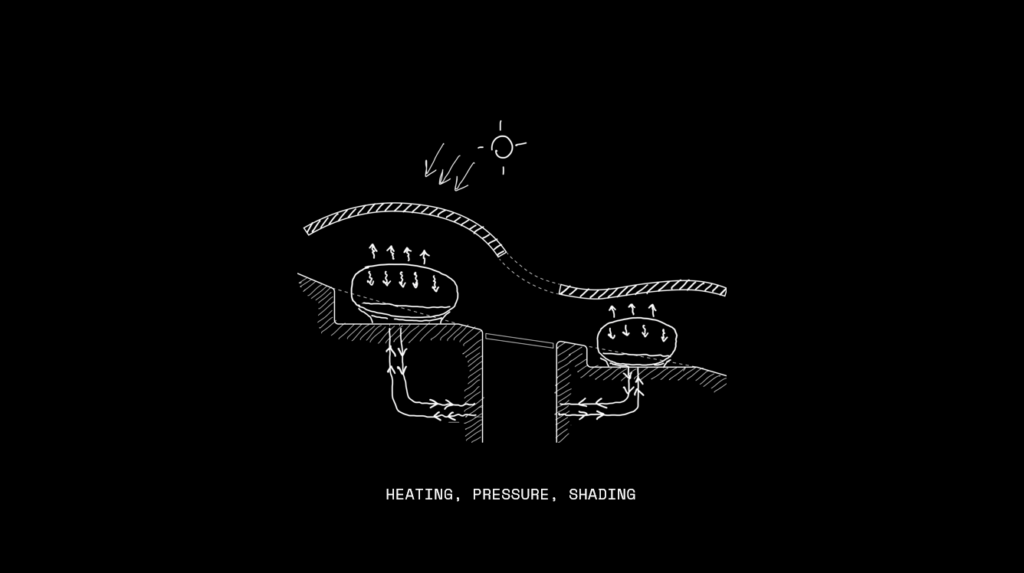
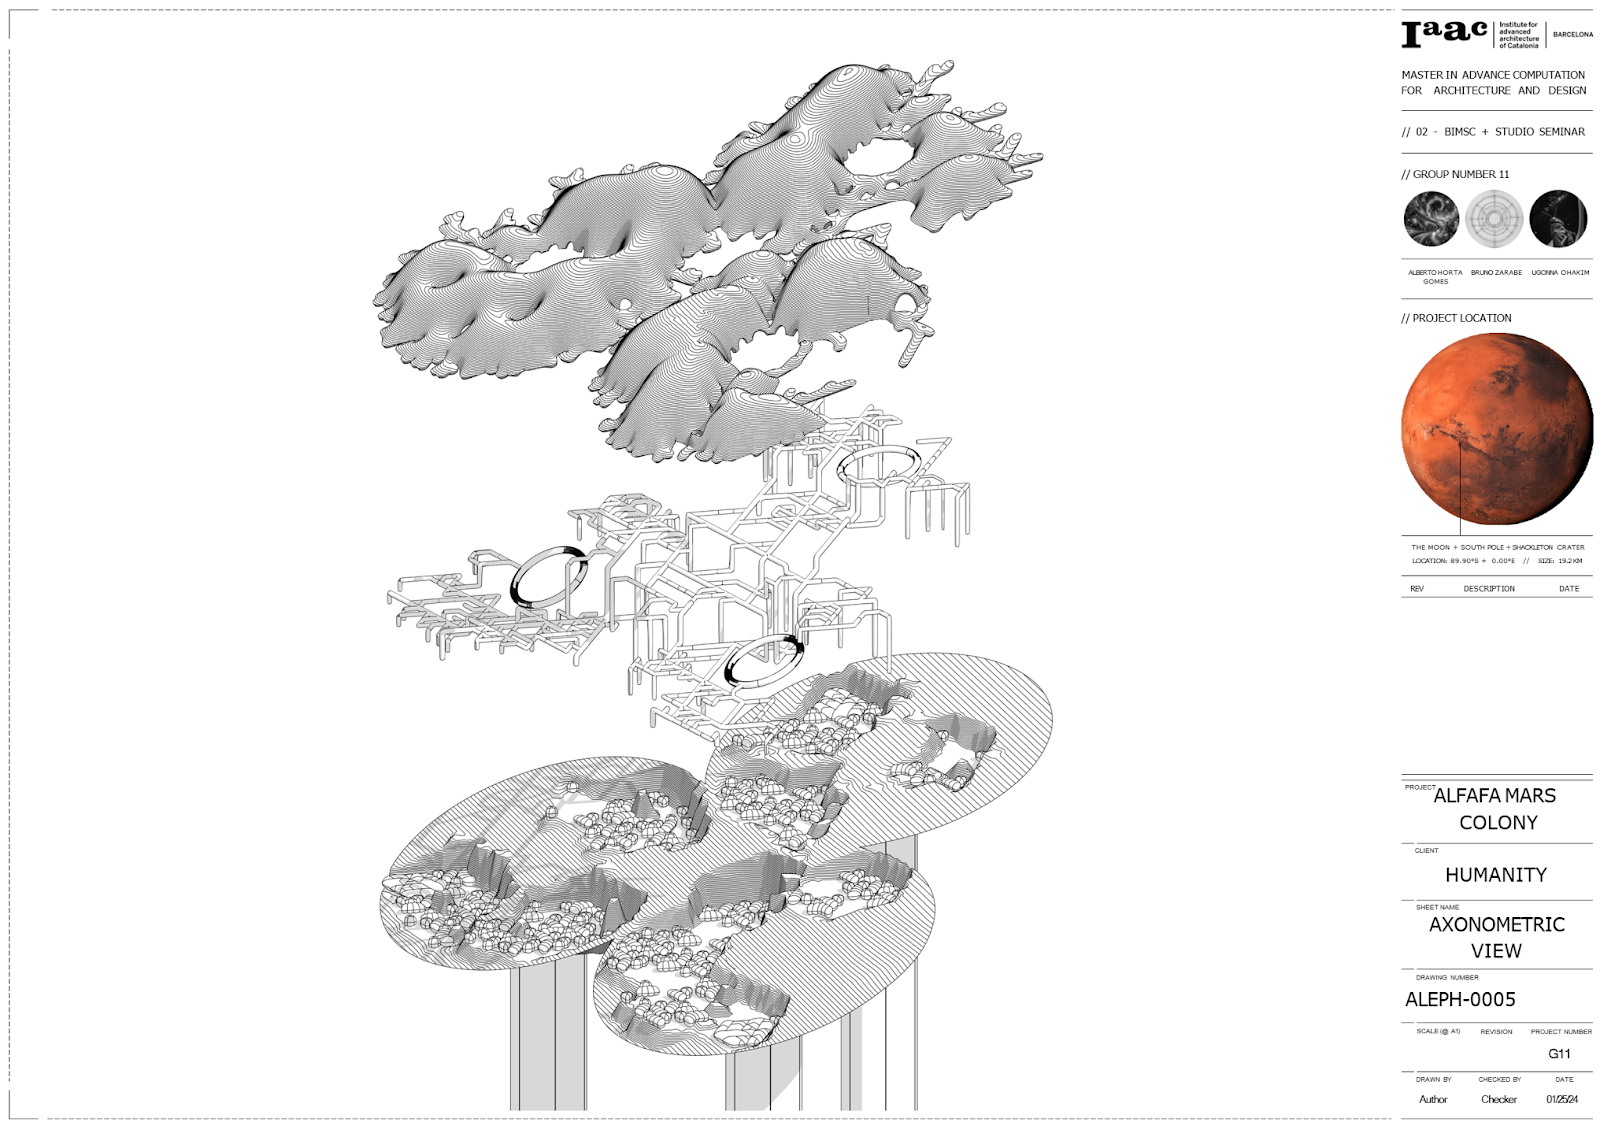
Form Finding
Our Martian adaptation approach caters for 3 different conditions, heating provided by the Mohole excavation through the ground, pressure from the inflatable modules, and shading from the canopy. These 3 conditions start to dictate the 3 layers of our project and the work divisions we use to collaborate.
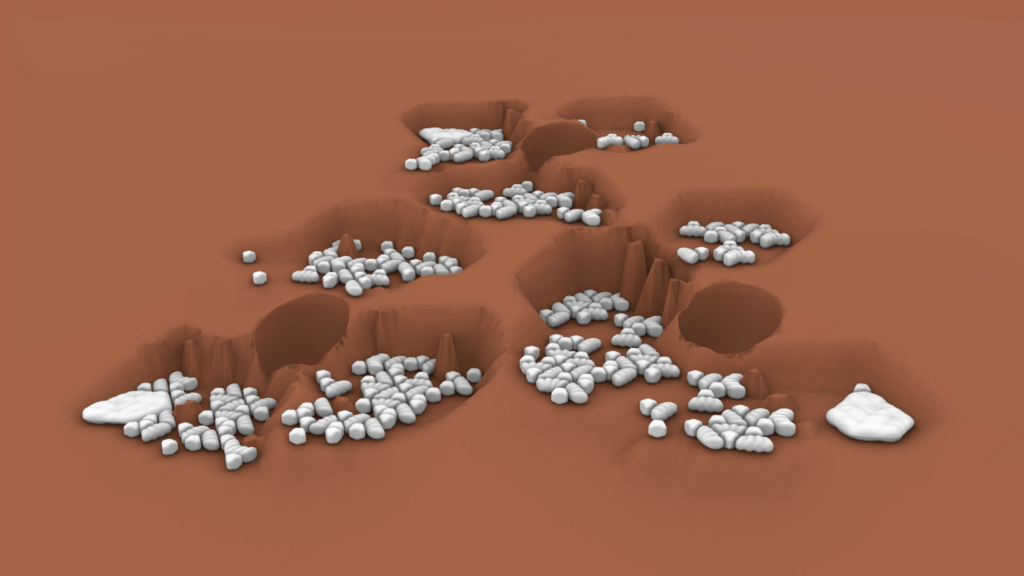
Topography Form Finding
To get to our topography, first we got rid of the excessive lines on our original l-system, then we divided the units in smaller clusters.
With the smaller clusters defined, we places their outlines on the site, joined them with the mesh, lowered the level of the plateaus, placed the support for the canopy and finally added the moholes.

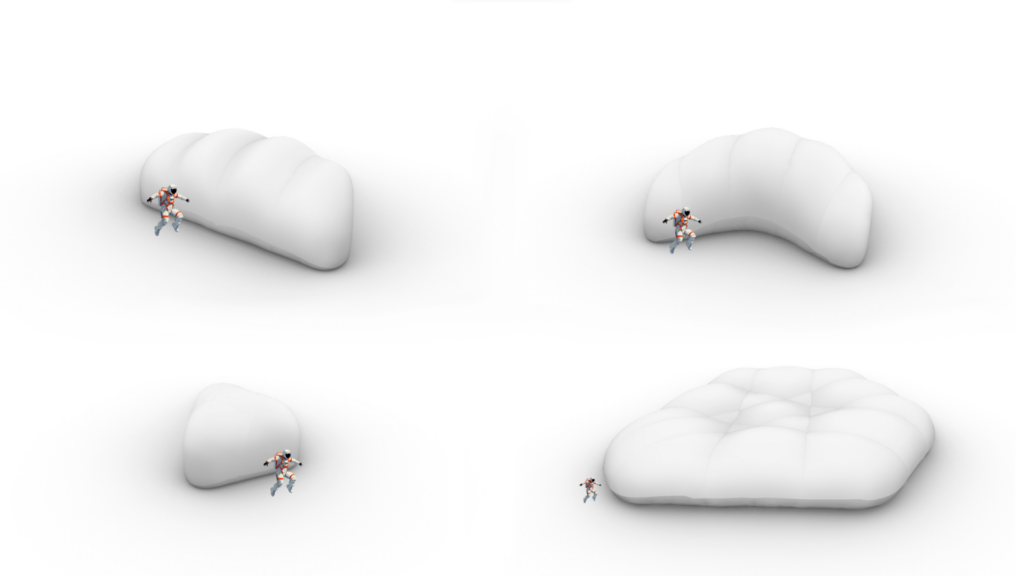
Units Form Finding
To get the units, we used the l-system lines, offsetting and filleting it to create the developable area, to create a double layered mesh, then we added seams and finally the pressure, using a floor to force the inflatable to only go up.

Then we basically repeated the process, only adjusting the seams and the kangaroo settings to get to our 4 unit types.
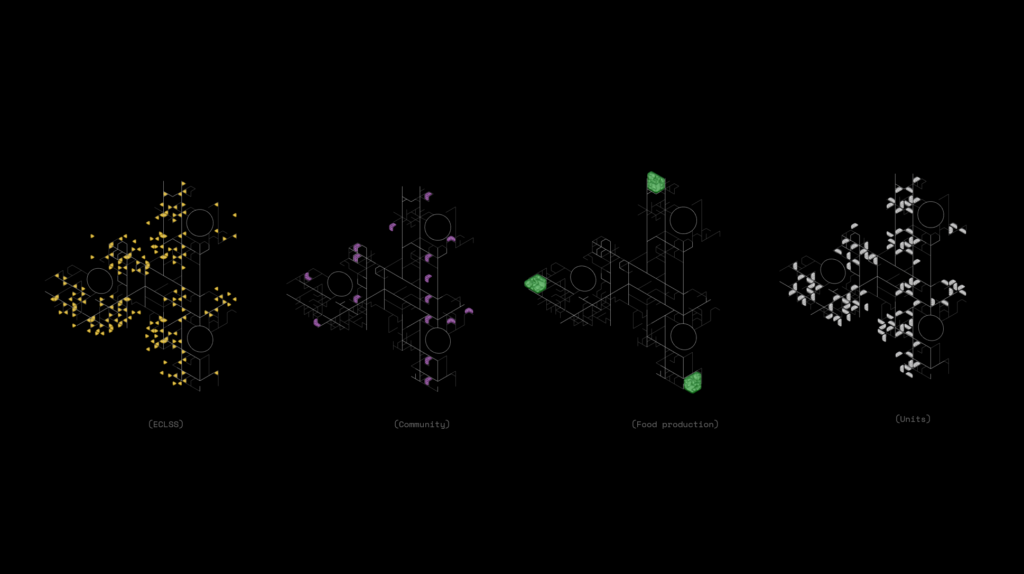
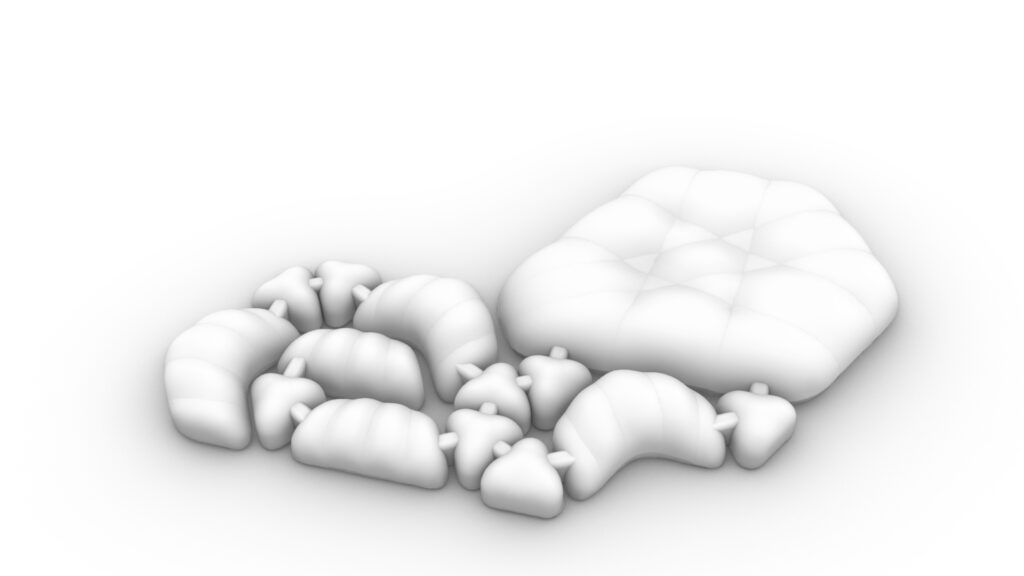
With the units final shape determined we populated the units with interior blocks.
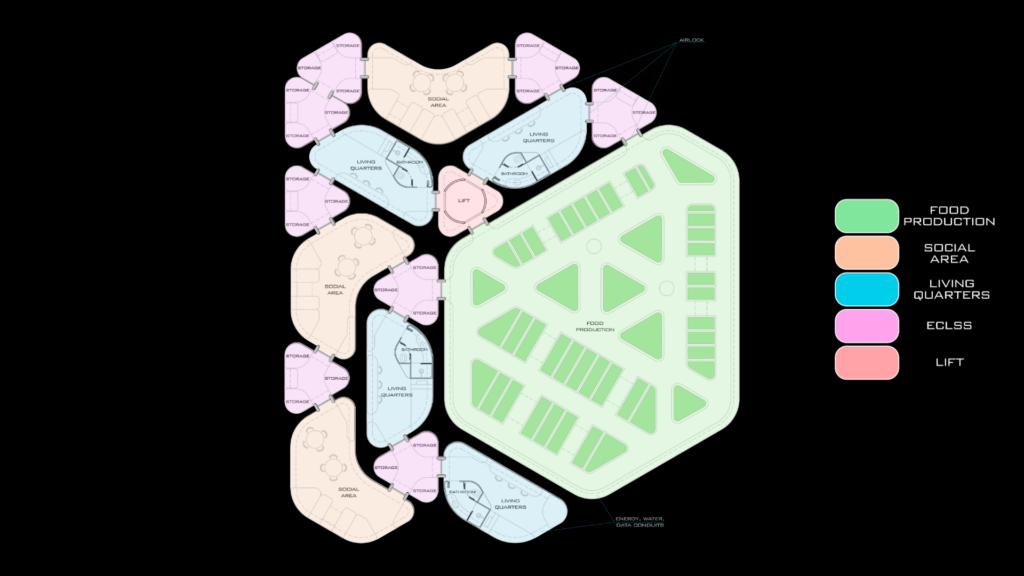
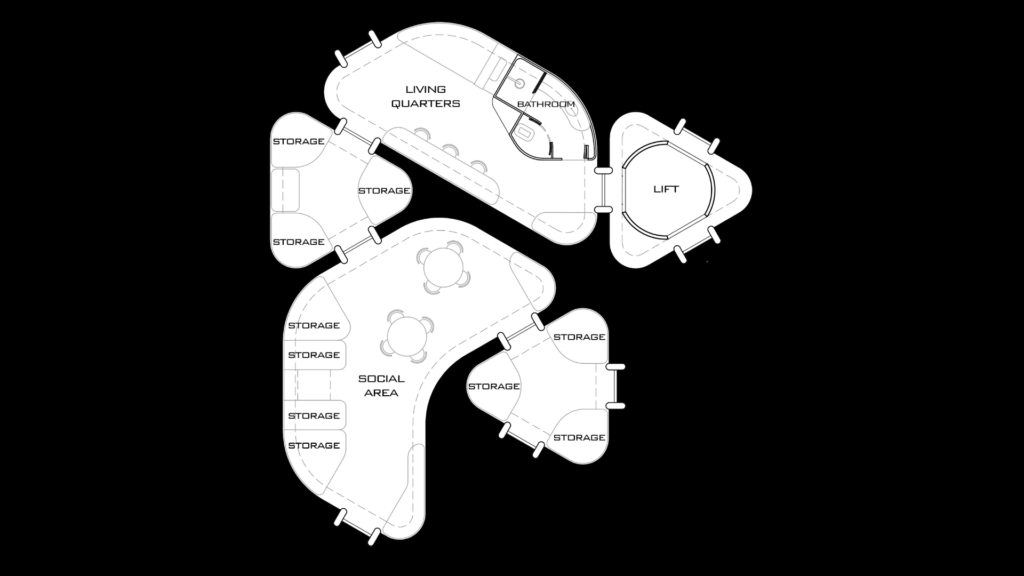
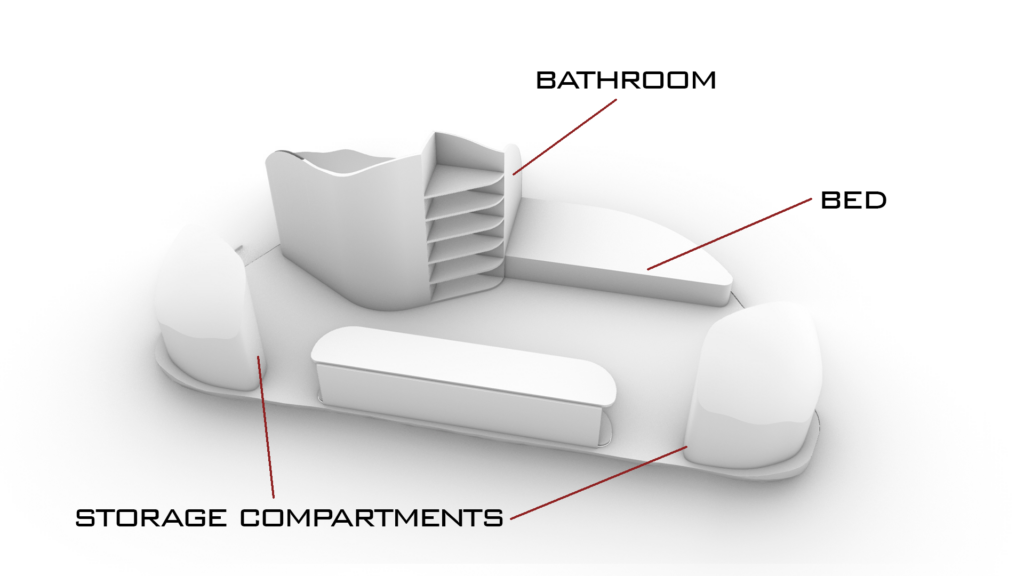
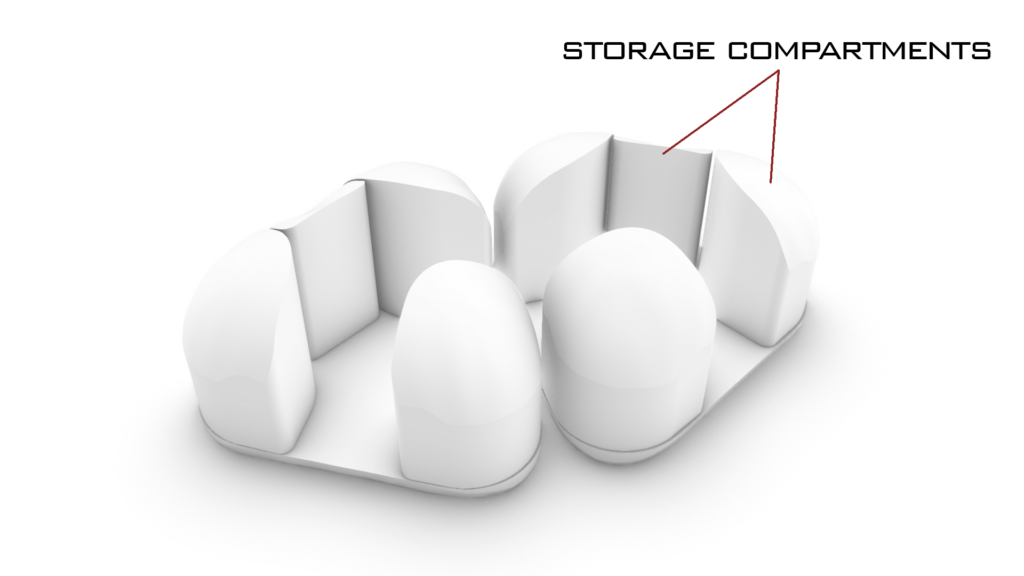
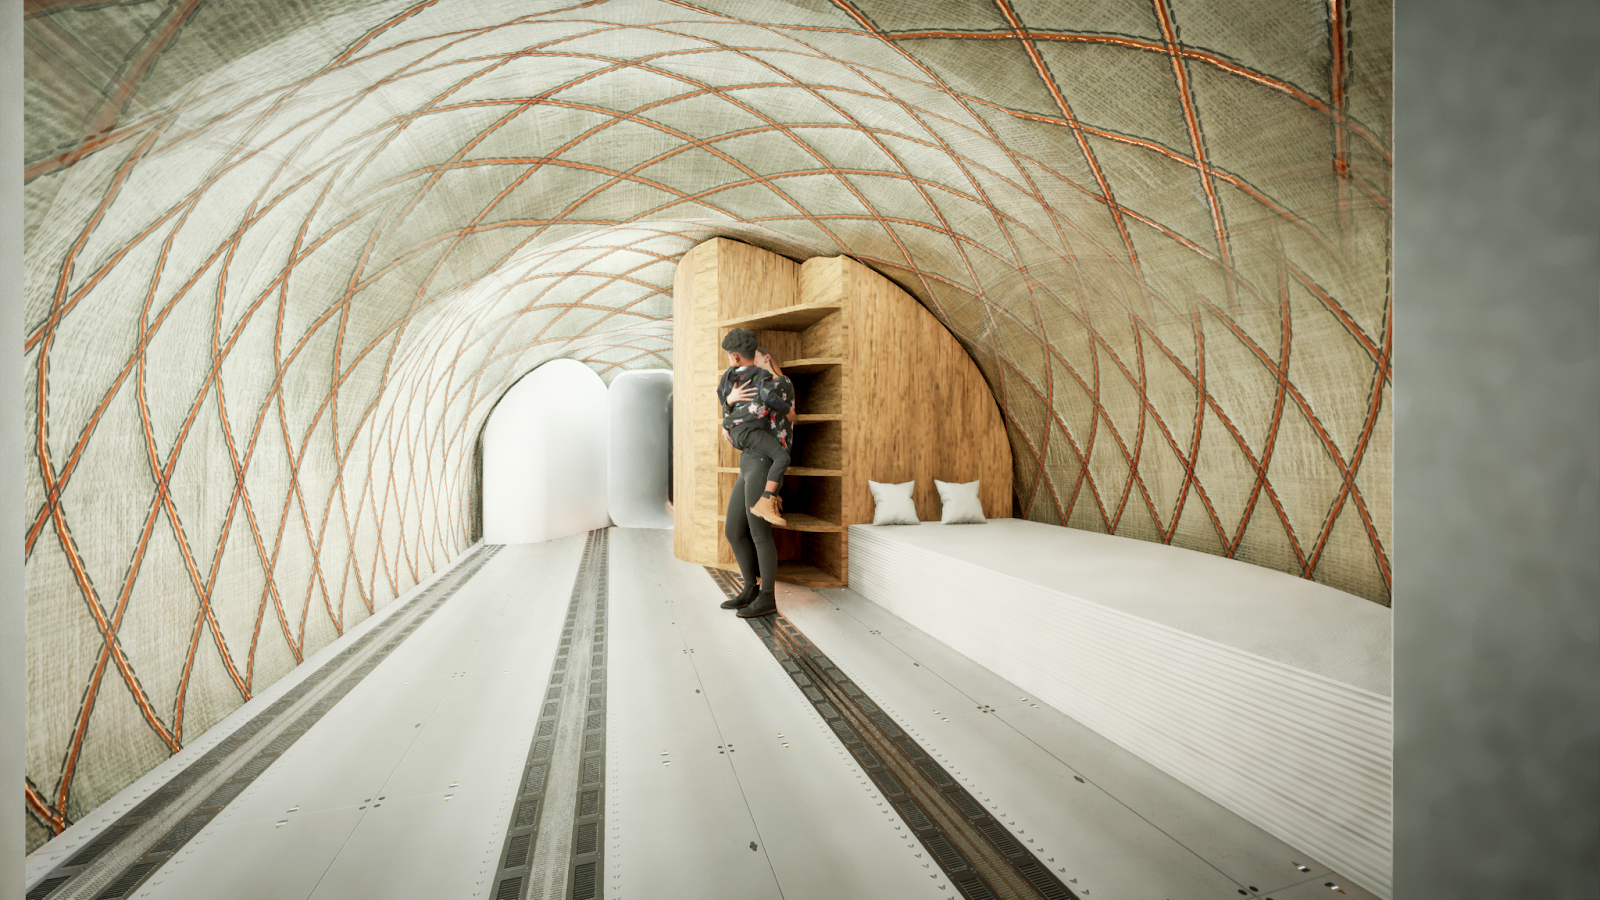
Then we started 3d modelling the blocks inside the units, such as beds, storage units, workbenches, bathroom and more., For the residential units for example we created blocks for beds, bathroom, storage compartments and a workbench.
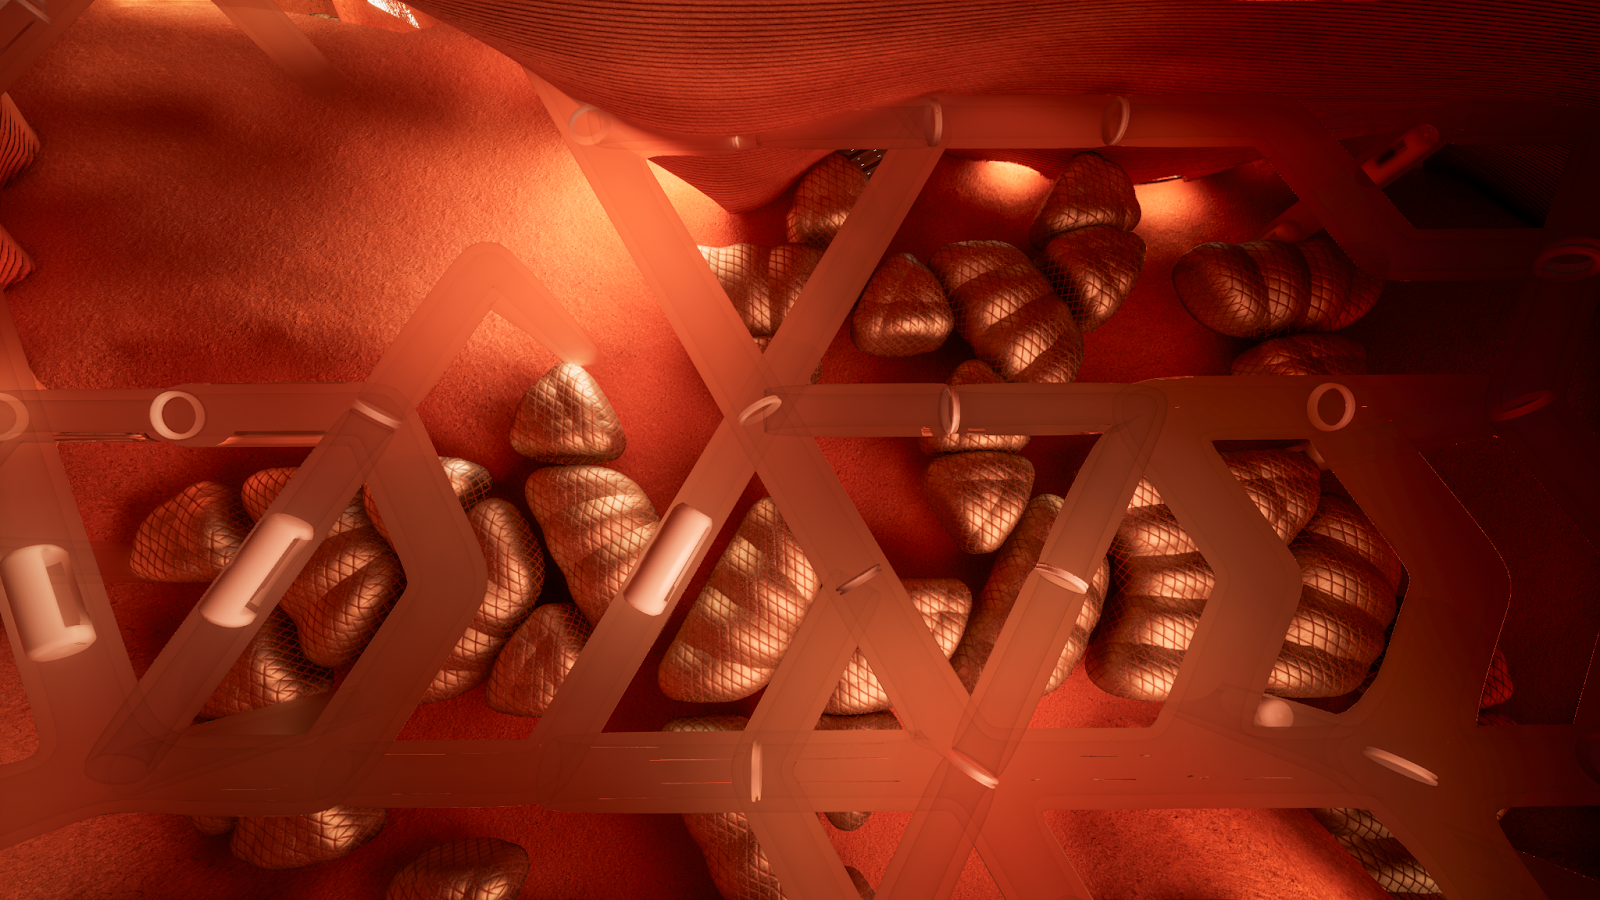
The ENVIRONMENTAL CONTROL AND LIFE SUPPORT SYSTEM (ECLSS) provides oxygen for breathing, removes carbon dioxide from the cabin air, recovers and recycles oxygen from carbon dioxide to resupply. Other than its basic functions, the Eclss capsules are basically filled with sorage compartments.
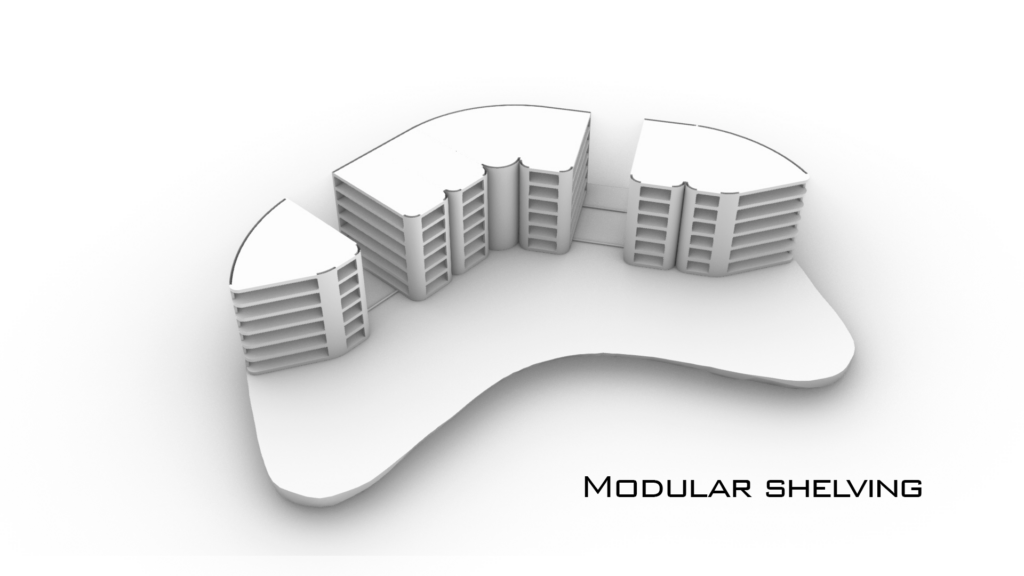
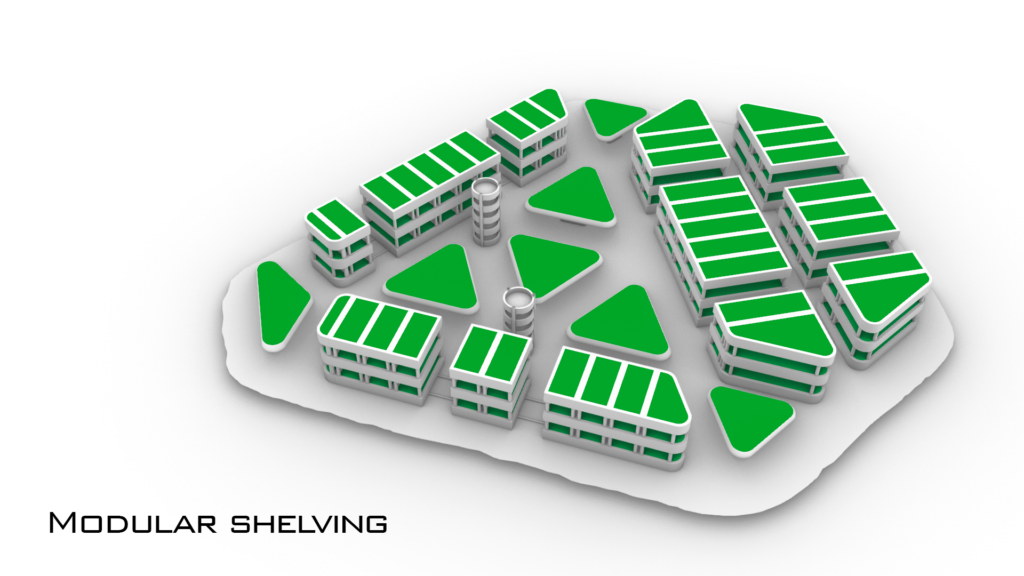
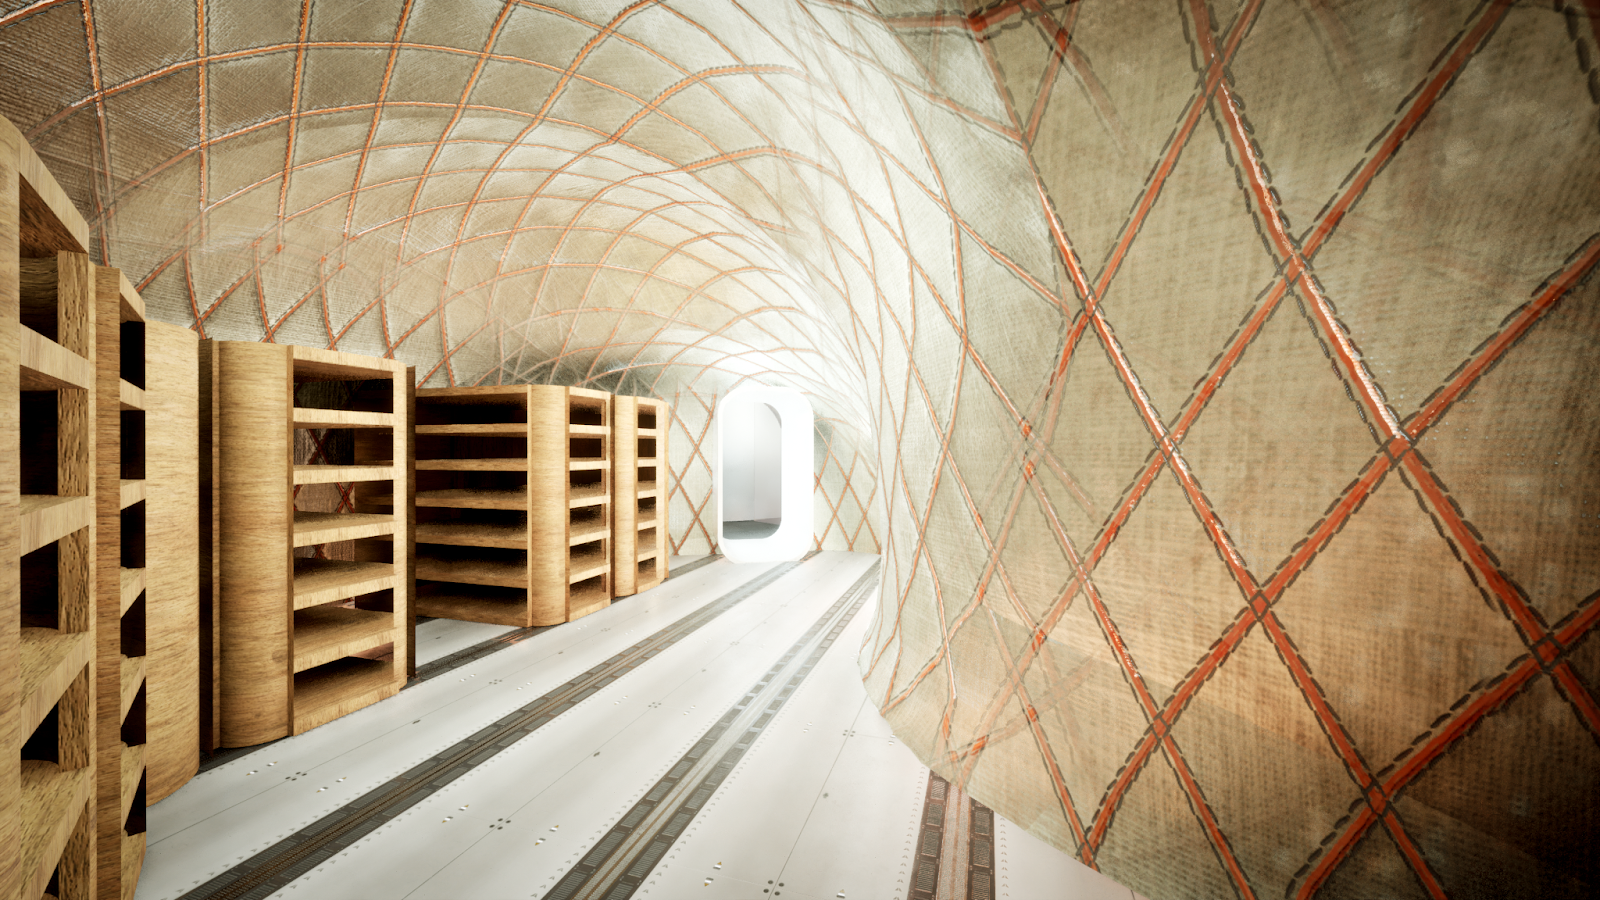
On the Community and Food Production units we adopted a modular shelving strategy, featured with ground rails which provides an optimal usage of the space.
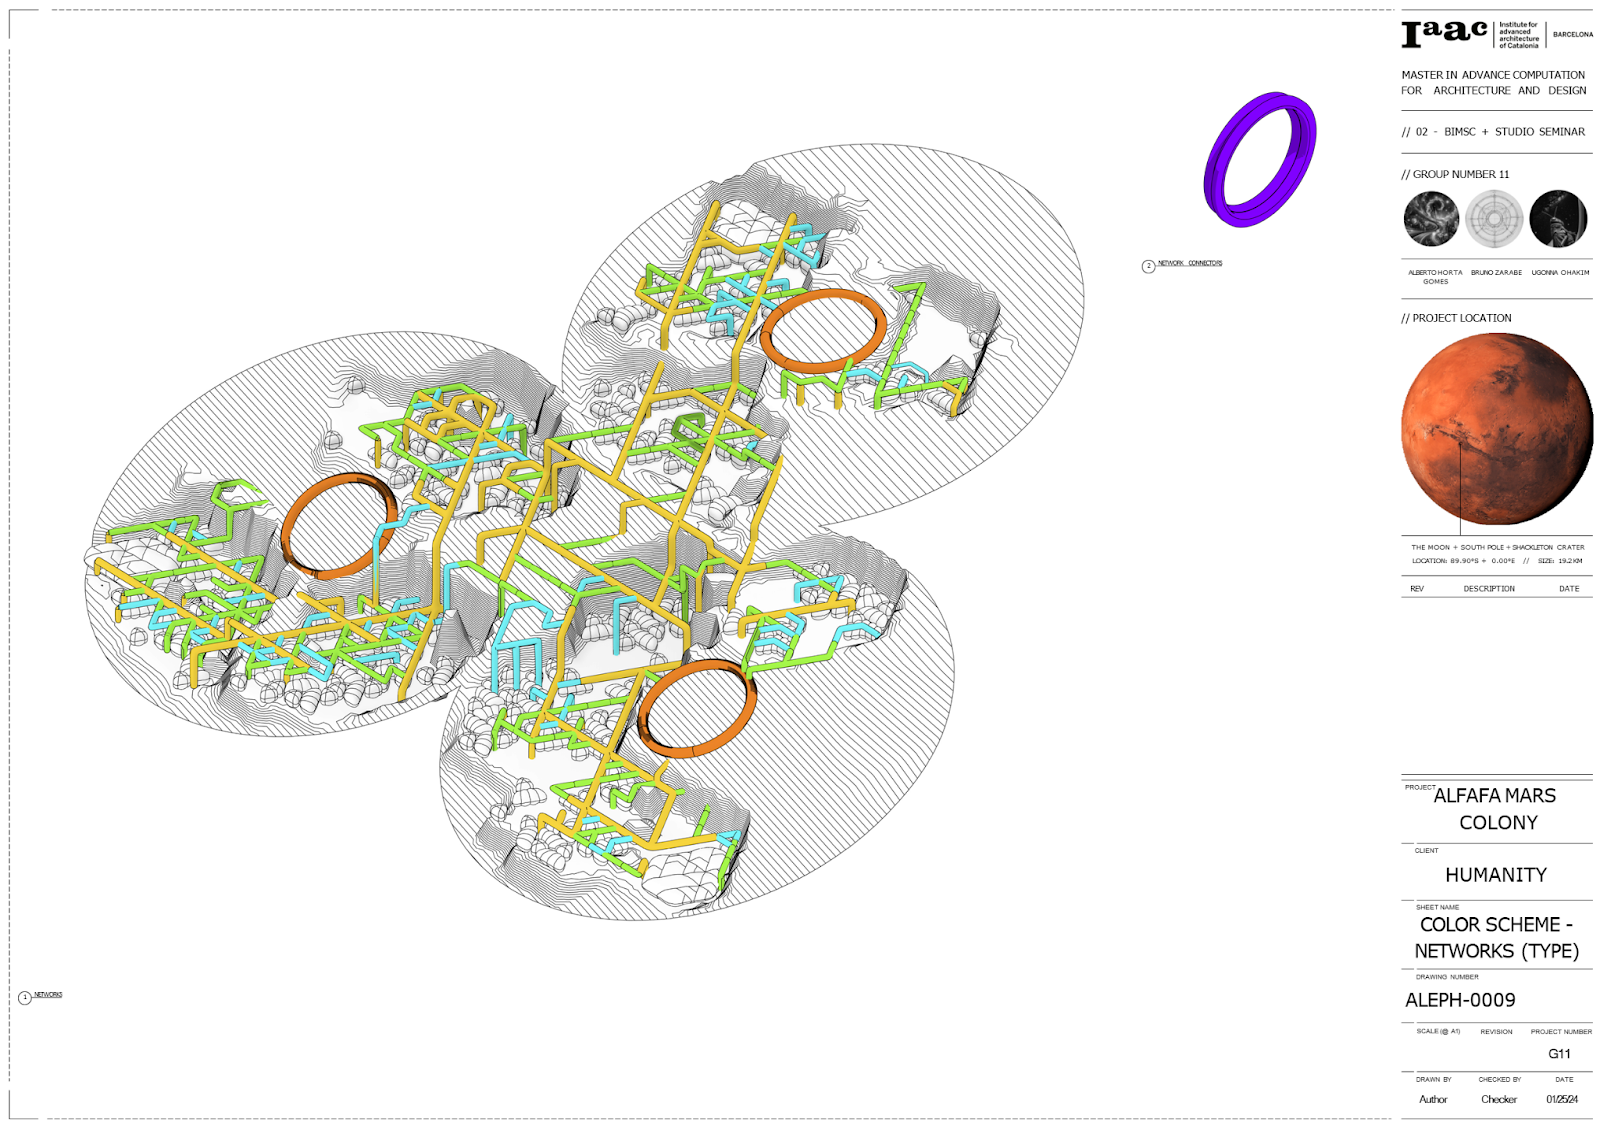
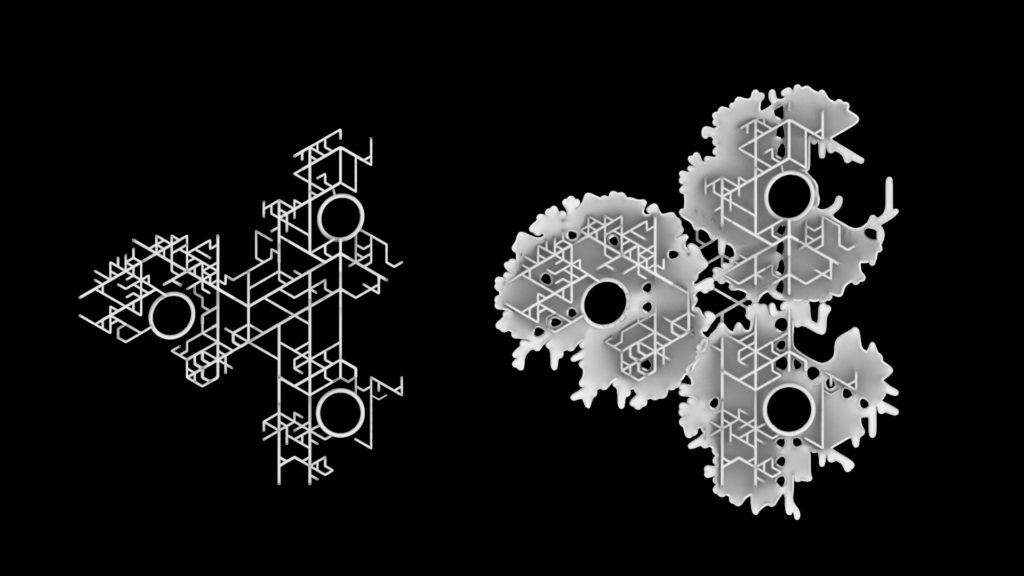
Network Form Finding

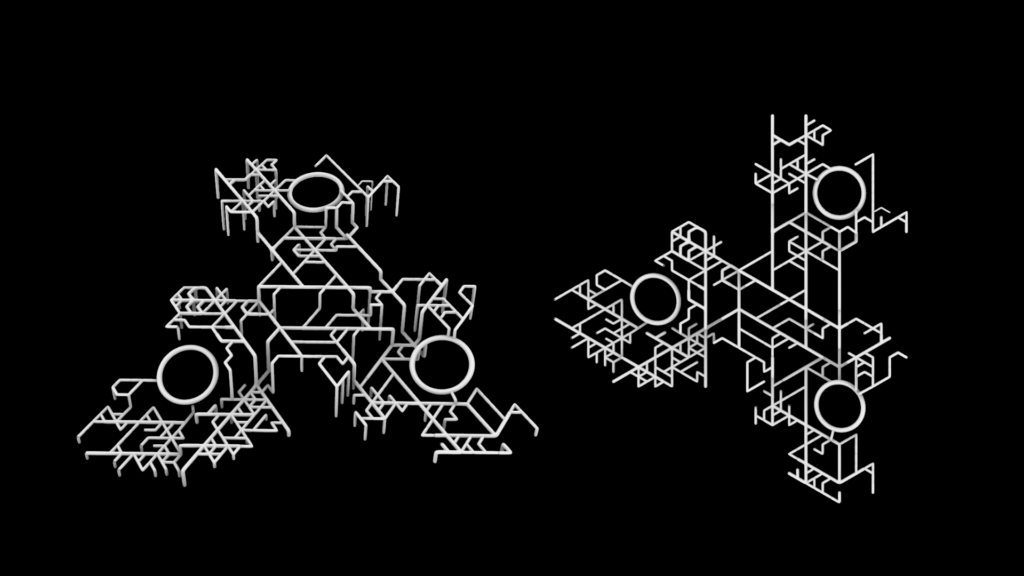
The expansion of the colony and therefore the connection networks follow the path traced by the l systems.
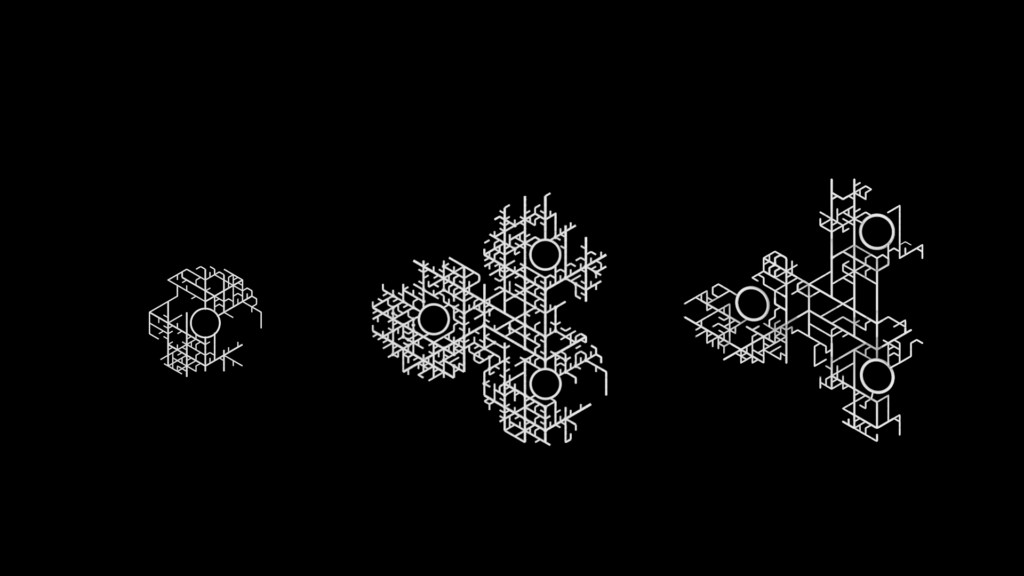
Here are some examples of how’s the system iterated in its development stages.
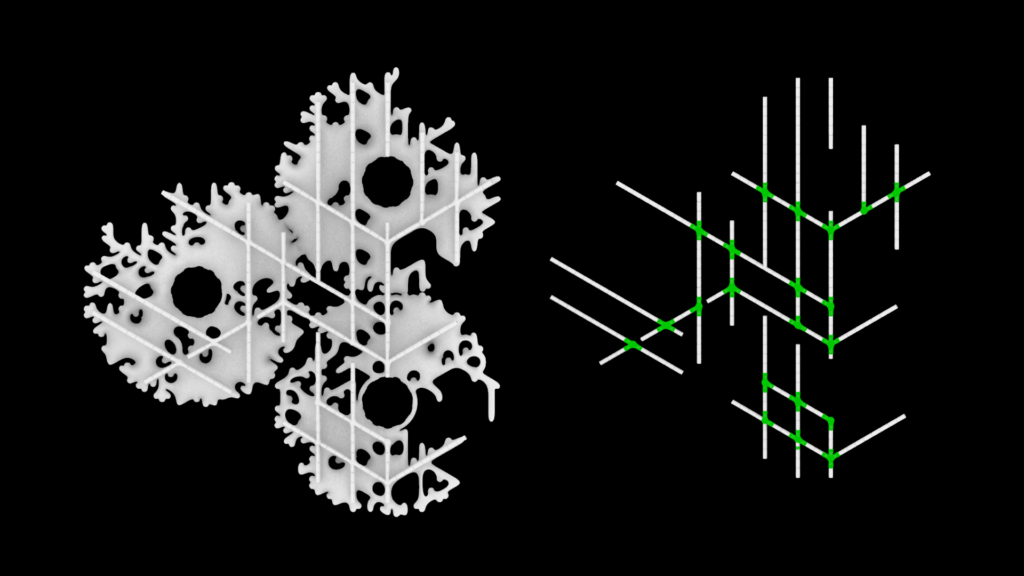
And that leads us to create an specific type of module for the multi direction connections in the interaction of different paths.
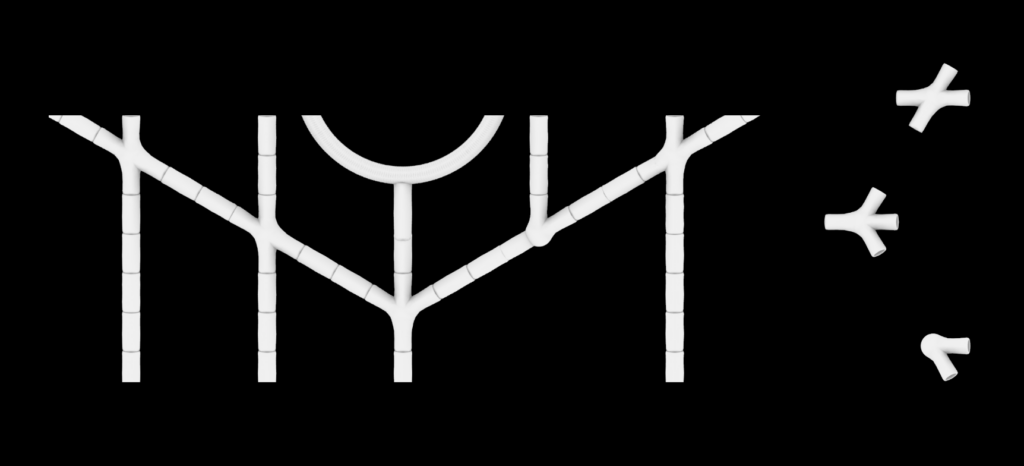
For the whole system we require 3 different type of multi direction connections.
Here we can see a completed network and its interaction with the shell.
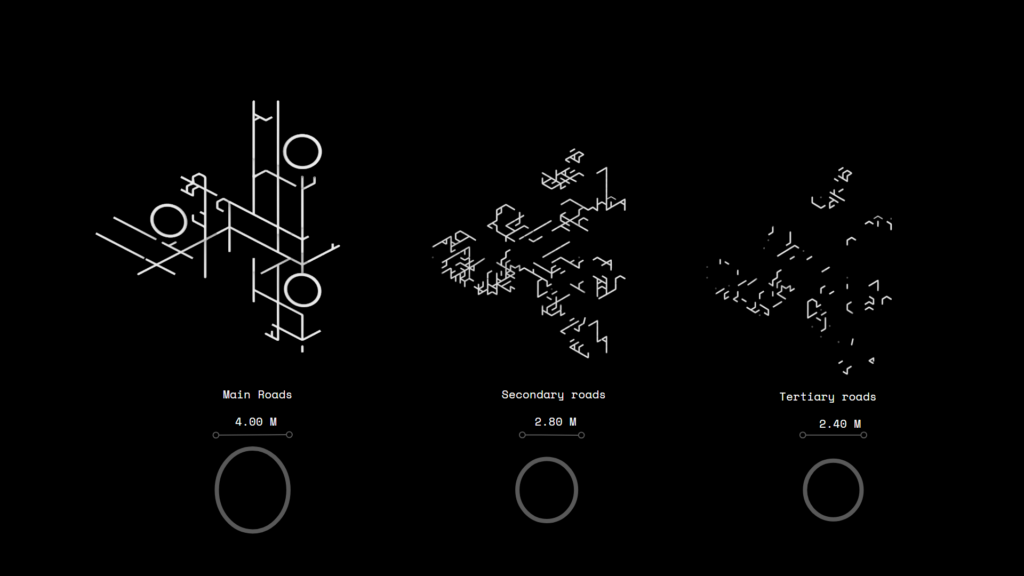
The networks paths are ordered according to establish hierarchy.
A main road, secondary and tertiary connections, each one with a different module diameter based on the kind of transit it will host.
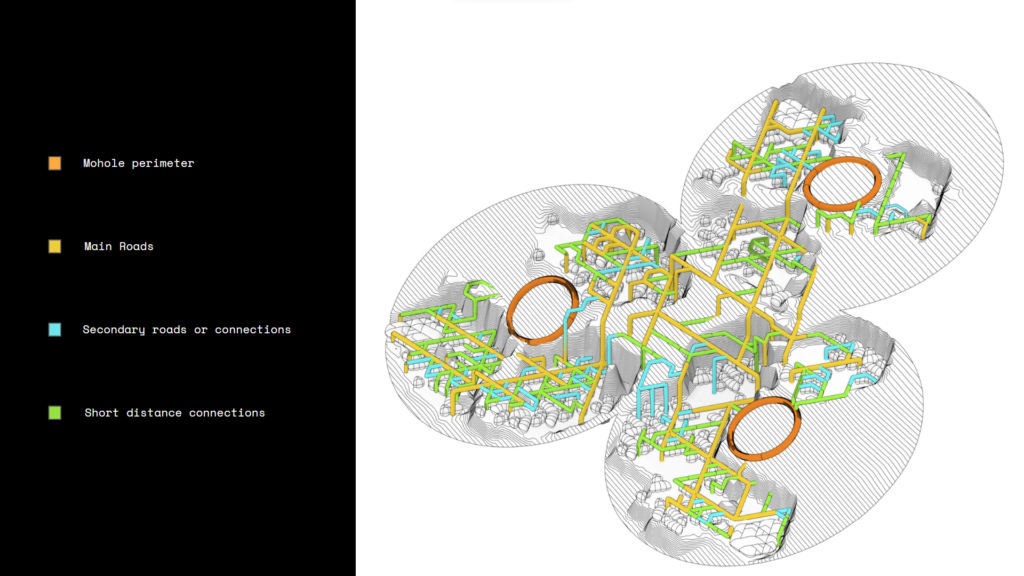
Here we can see the relation of the Main road, secondary roads and a short distance connections.
And here we can see the whole system deployed.
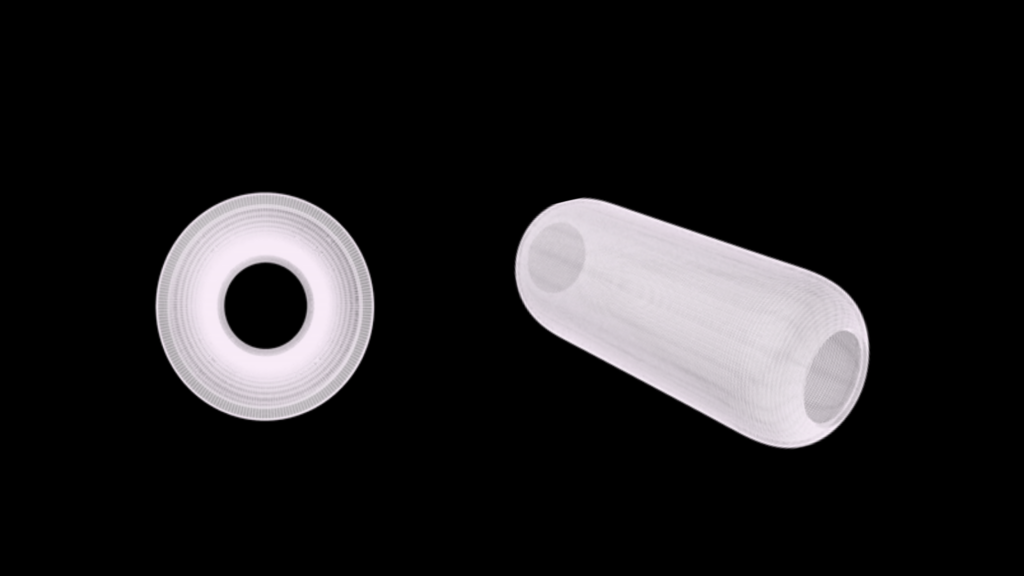
The modules that make the network system are based on inflatable tubes that host transit and connect one with each other.
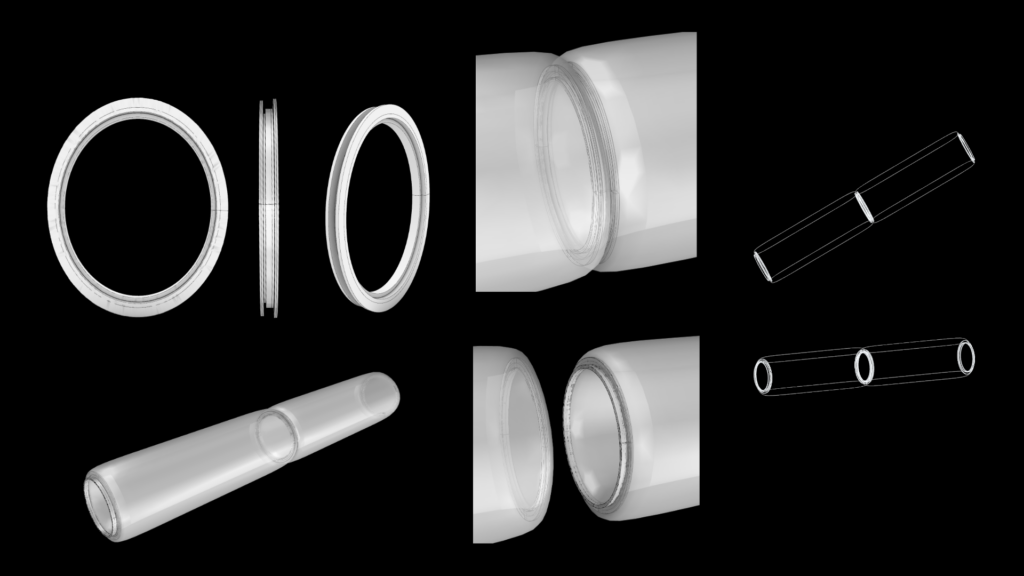
For this connection, we have designed a special type of connector system that ensambles with each other module.
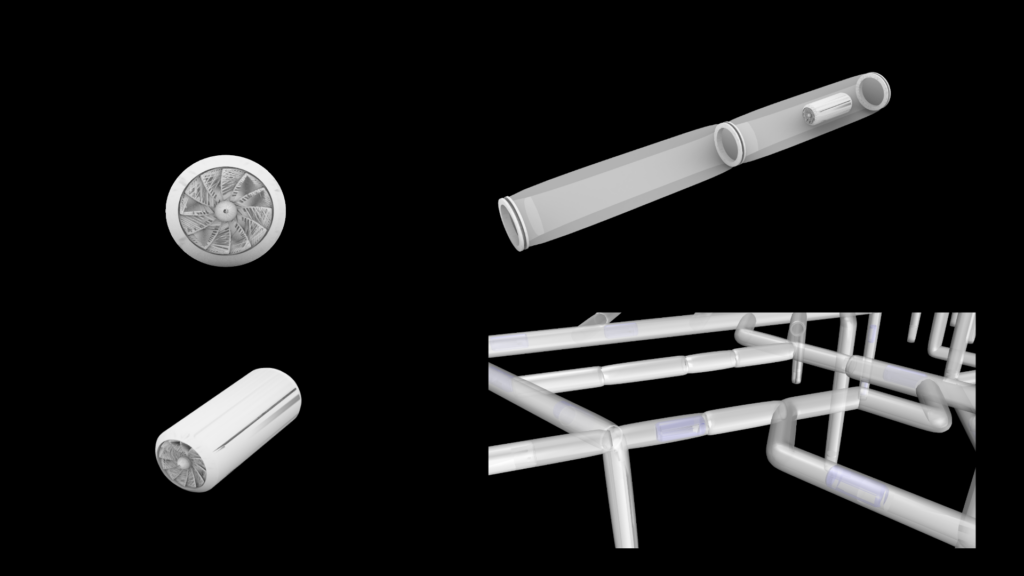
Aswell we envisioned a transportation system based on pods that could travel across the network connection different points in the colony.
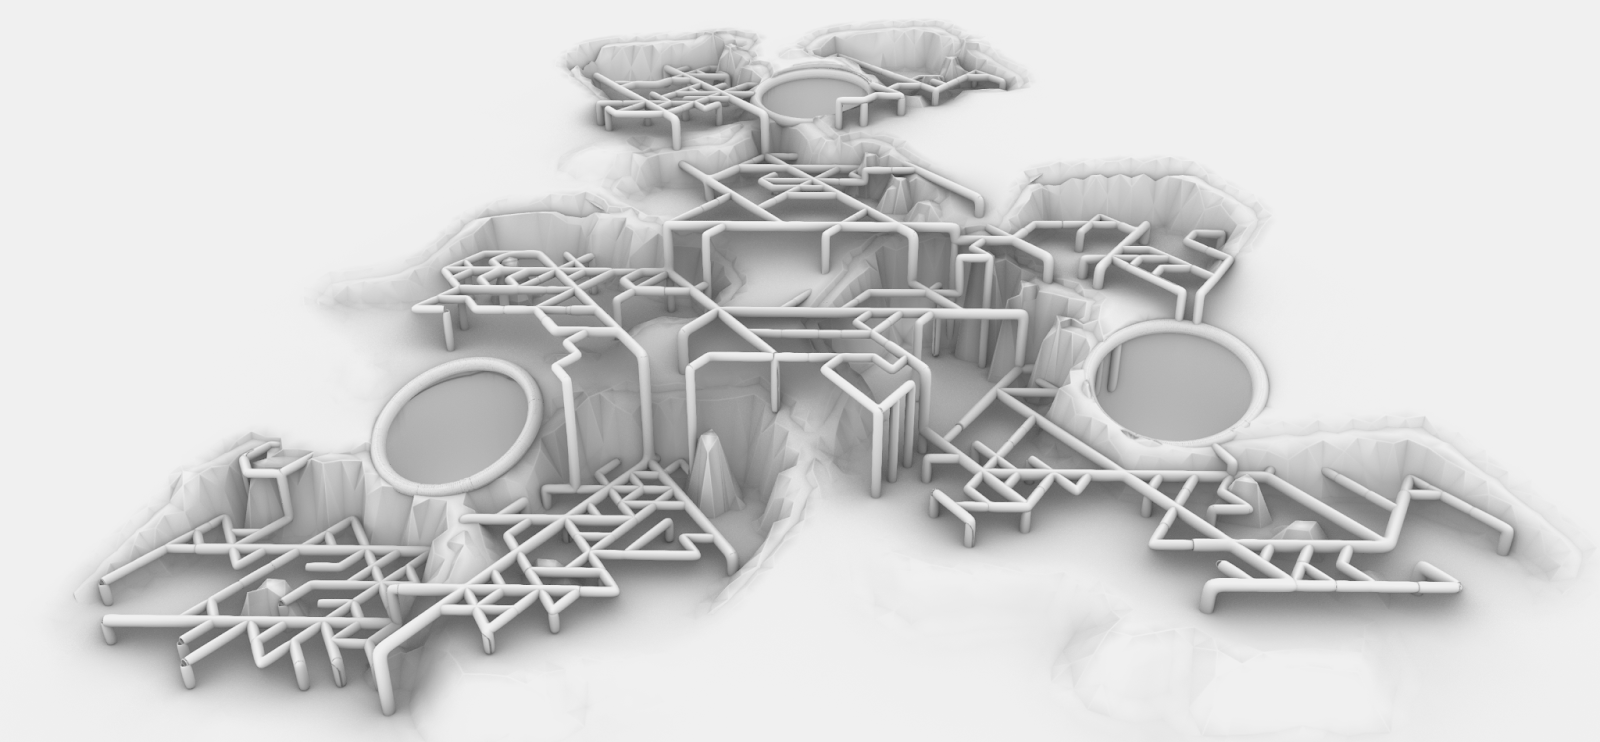
And here is an image of how the system interacts with the terrain
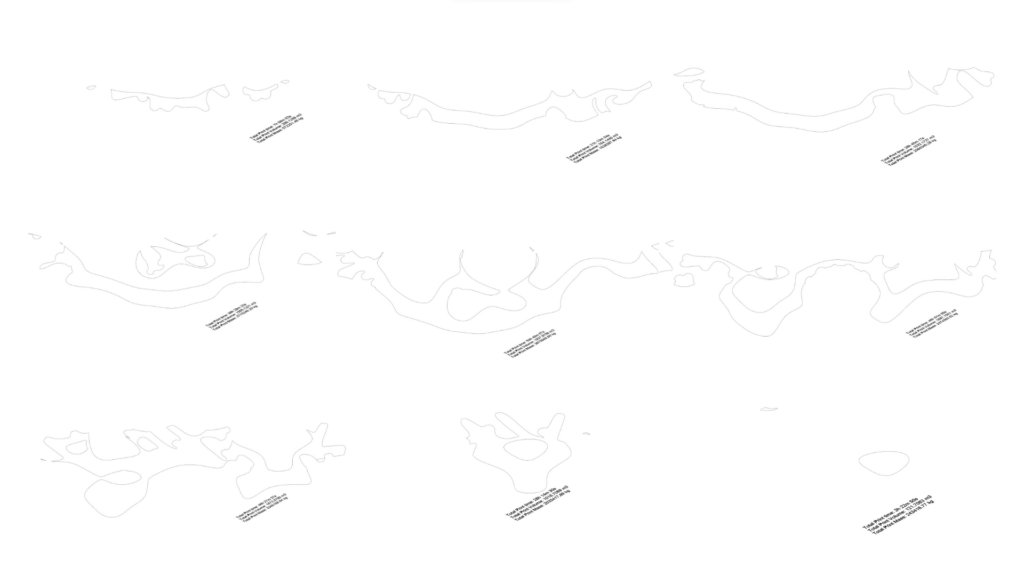
Canopy Form Finding

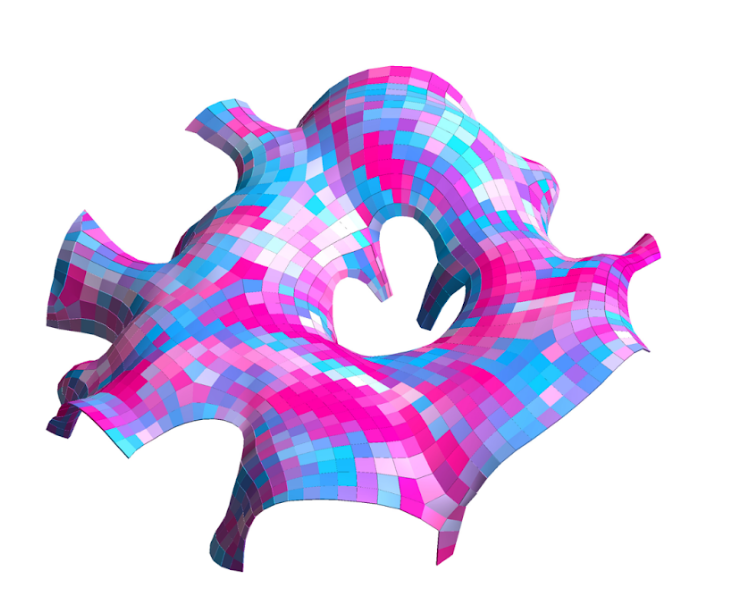
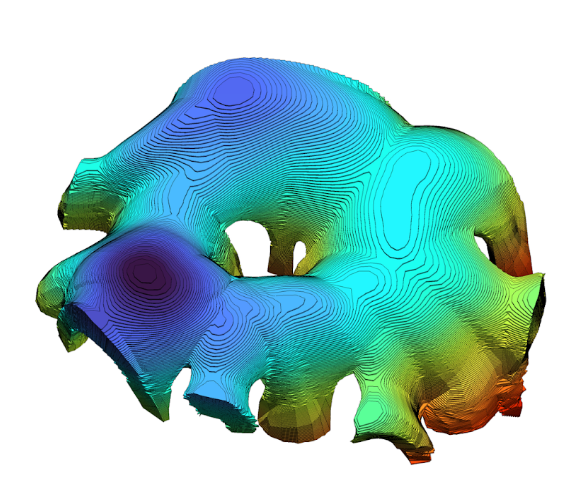
From the lines of the L-systems, we start to generate the canopy, first by thickening the lines, then extracting the moholes, and the zoned courtyard spaces for the openings, making that a mesh and subdividing into a finer mesh.

Which is then fed to kangaroo with several anchor points and parameters for inflation.

These were some of the iterations, going from the current on the left to the first test on the right.
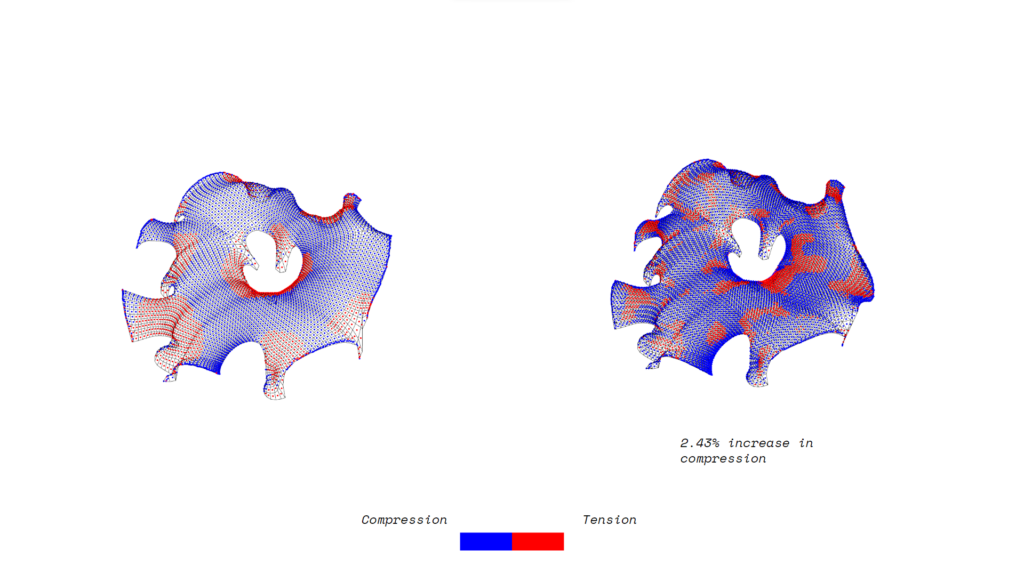
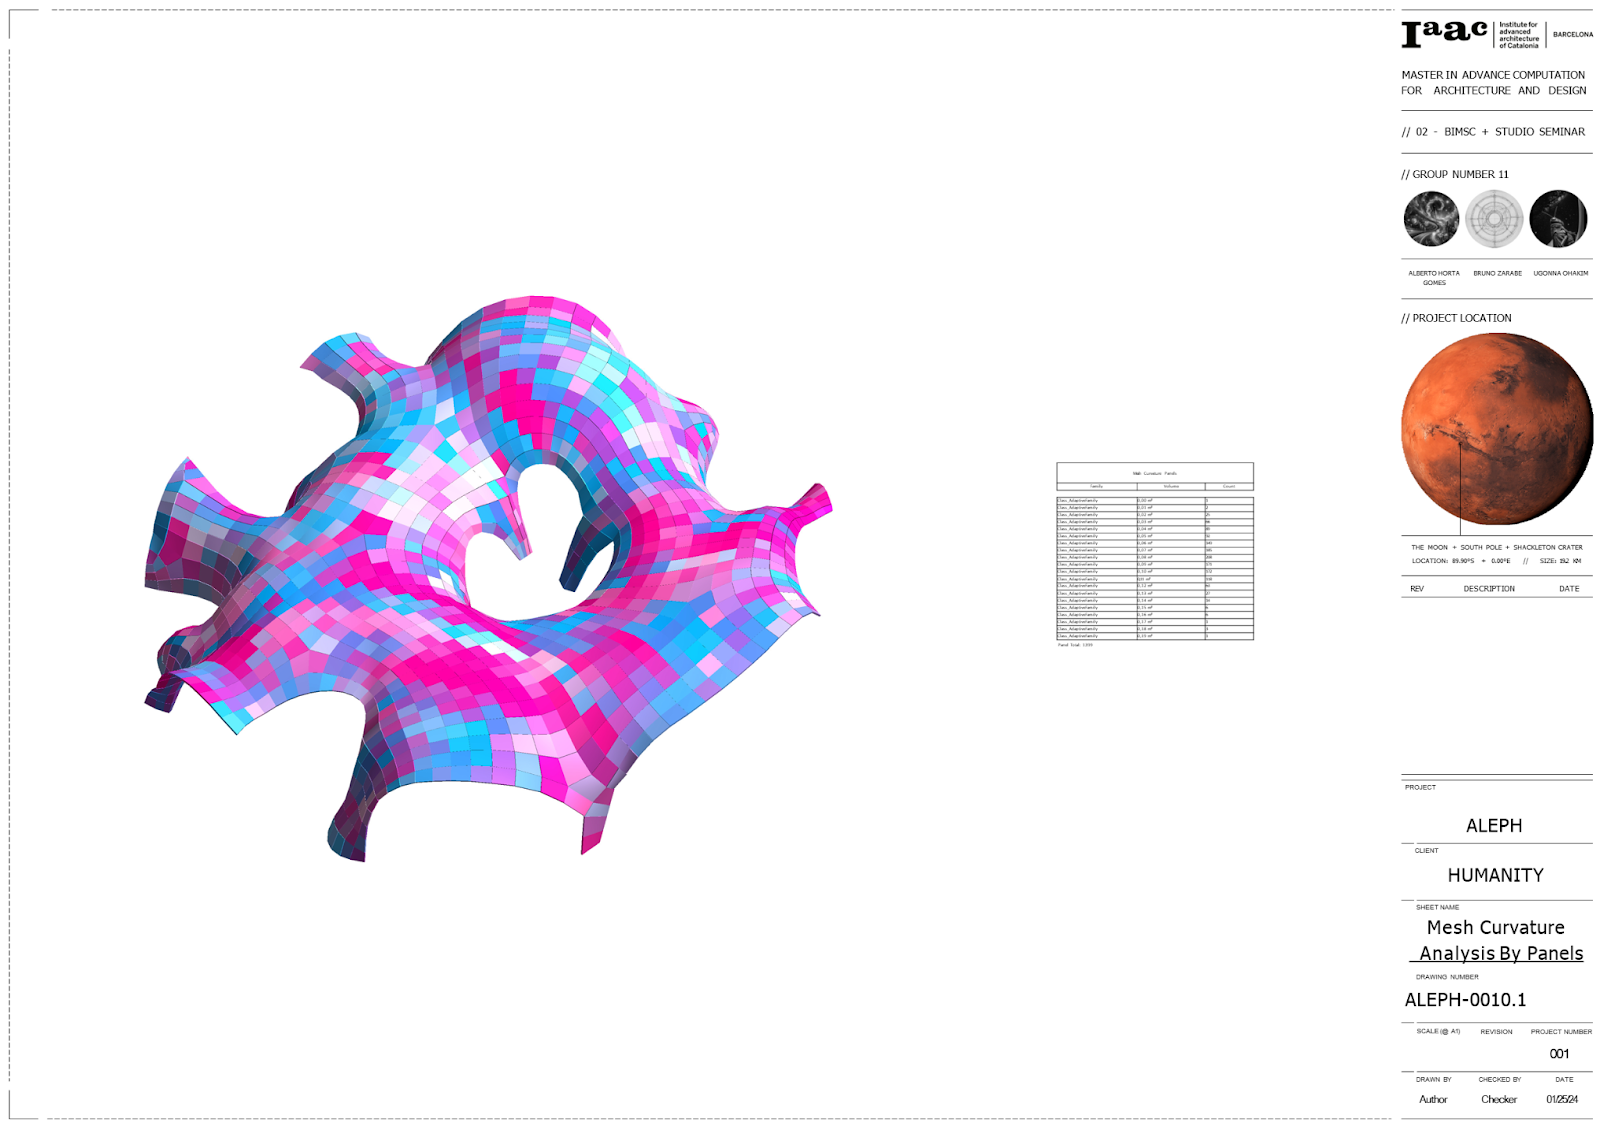
Due to the weakness of regolith in tension we did a study to maximise the compression using a deformation in kangaroo.
We explored a scenario where the shells were made up of discrete parts also made up of the regolith, you can start to see from the image the number of unique parts there are, and according to the schedule done in revit, there are 20.
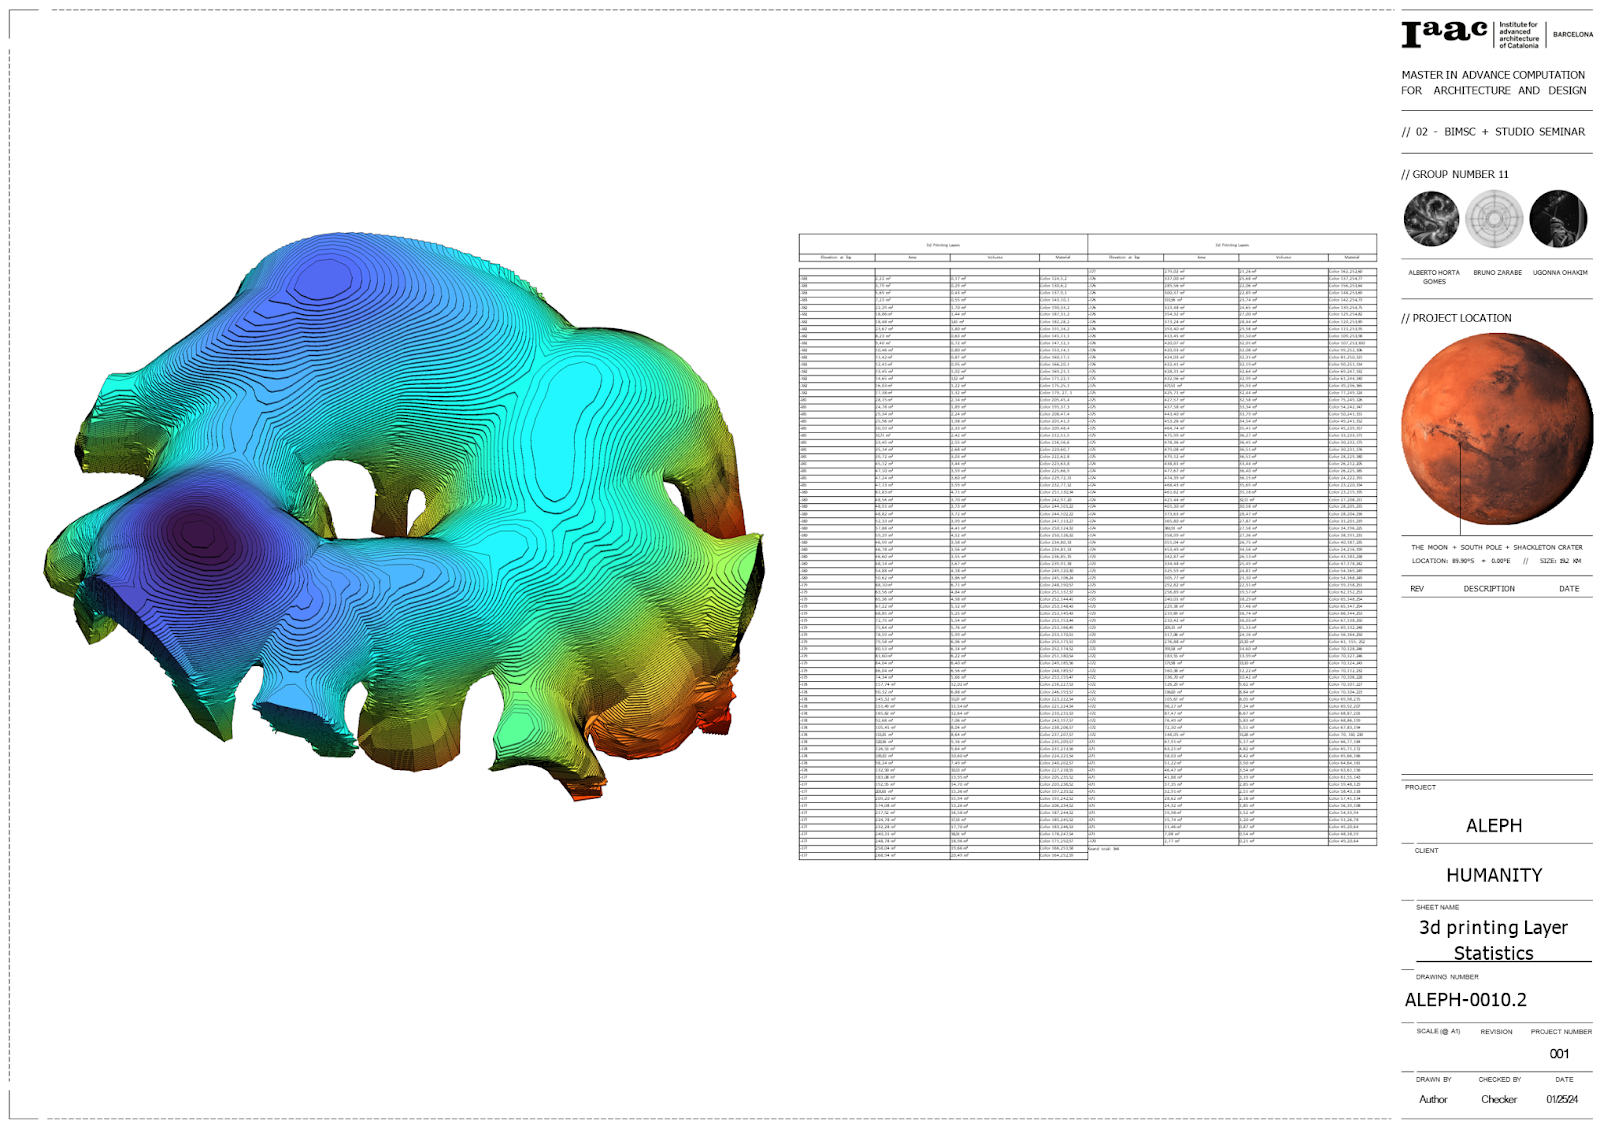
But we decided for a more monolithic 3d print with the regolith for greater environmental control of the space beneath and the utilization of the regolith material extracted. This was done in revit to see the volume and area of each 20mm print level to ascertain a time.
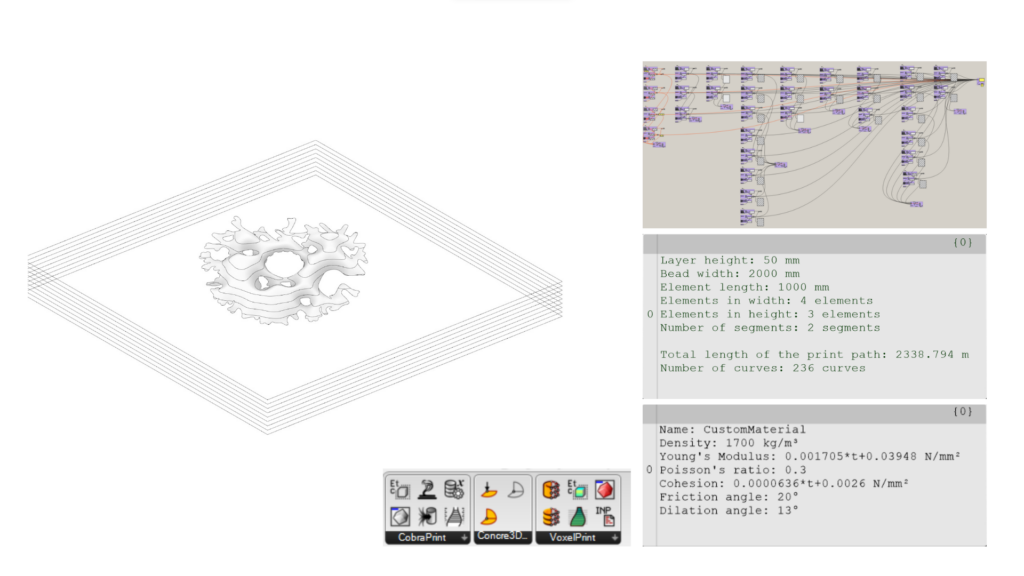
We also performed a 3d print test of one canopy using cobraprint from grasshopper.
That was divided in parts due to the limitation of the plugin.
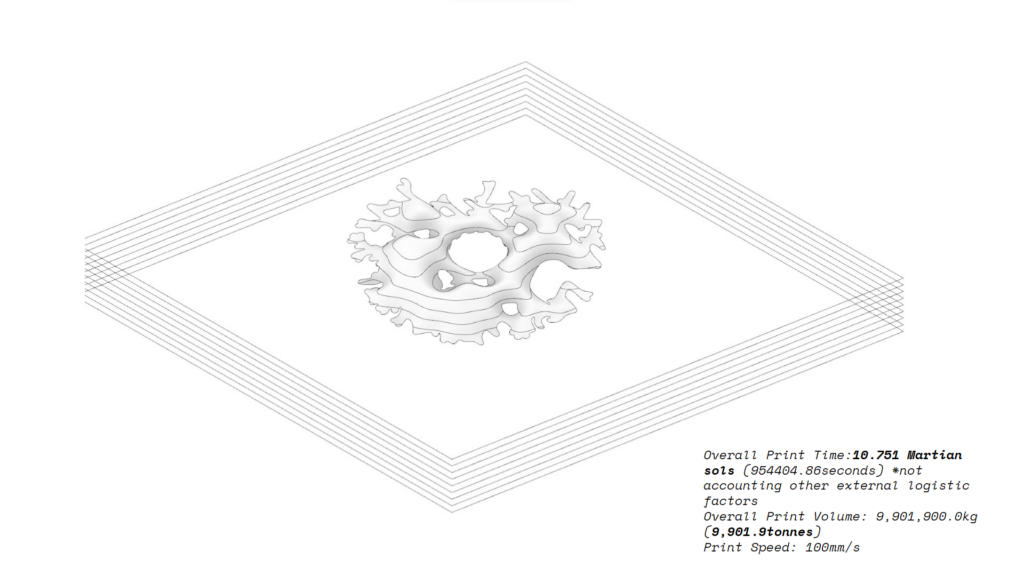
And the result was 10.751 Martian sols not accounting for any external logistic factors or printing limit per day.
3D Rendered Images

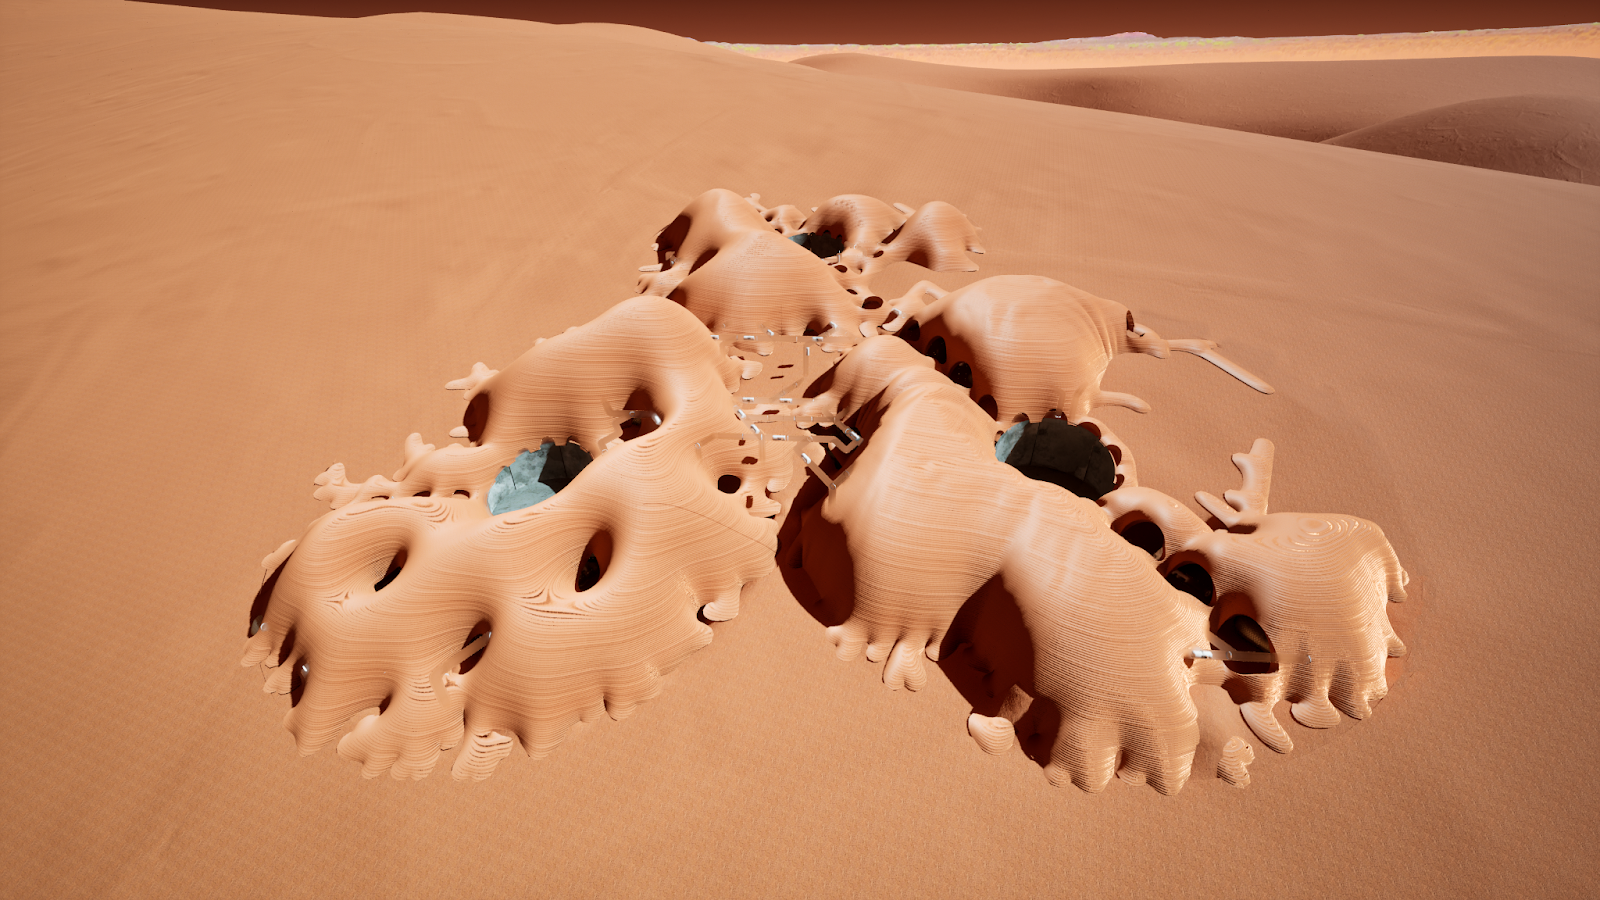
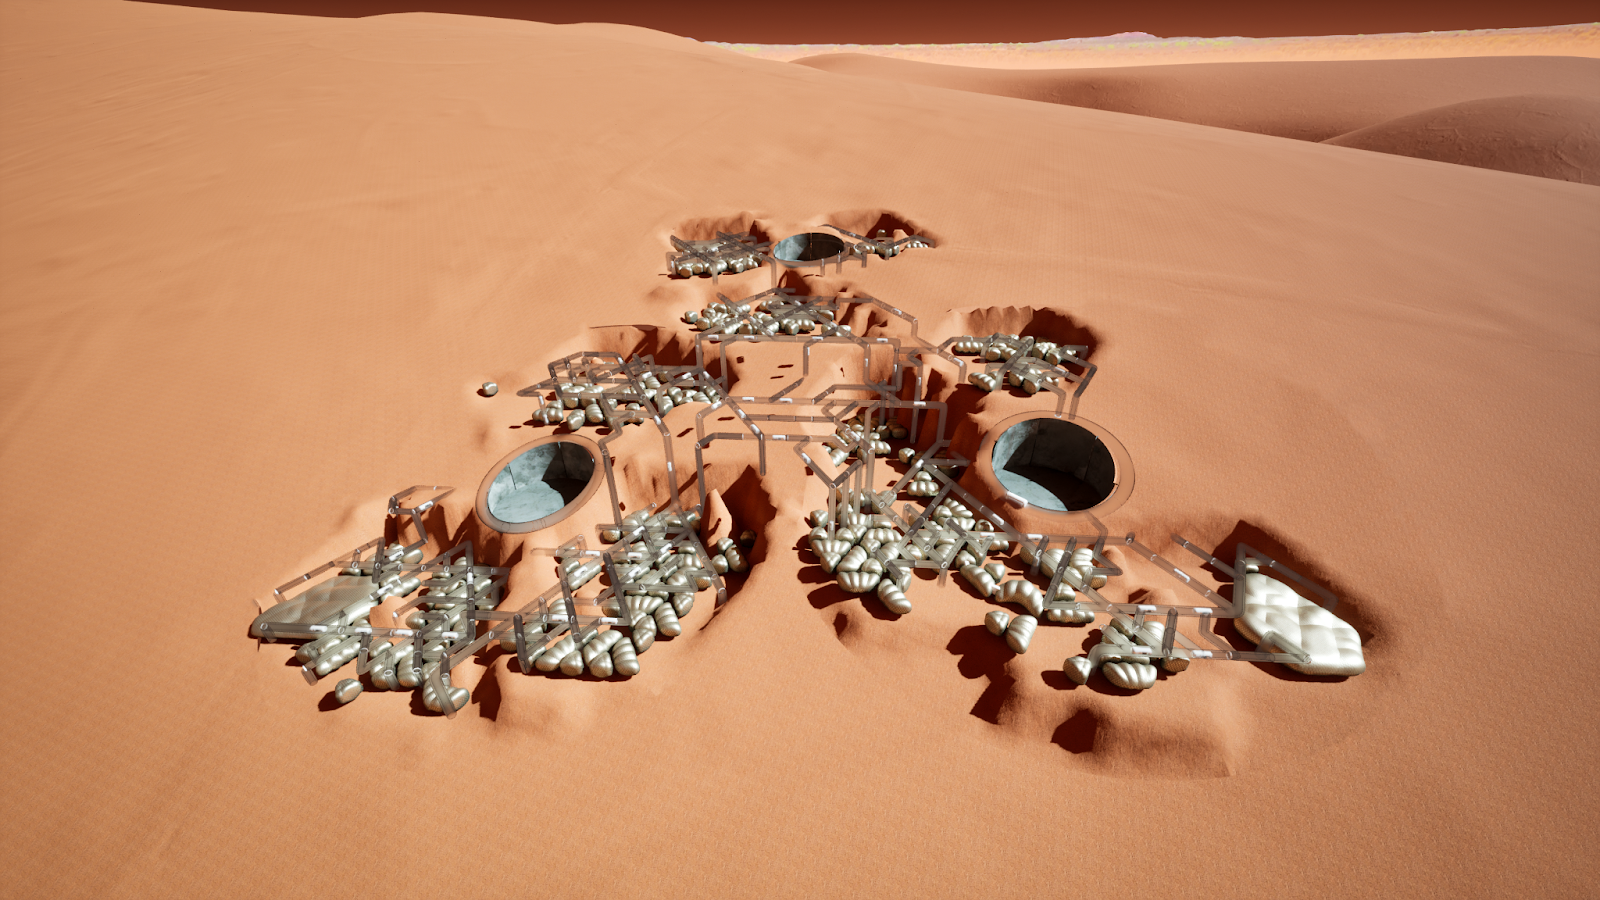
A gif showing the order of our construction process.
Collaboration
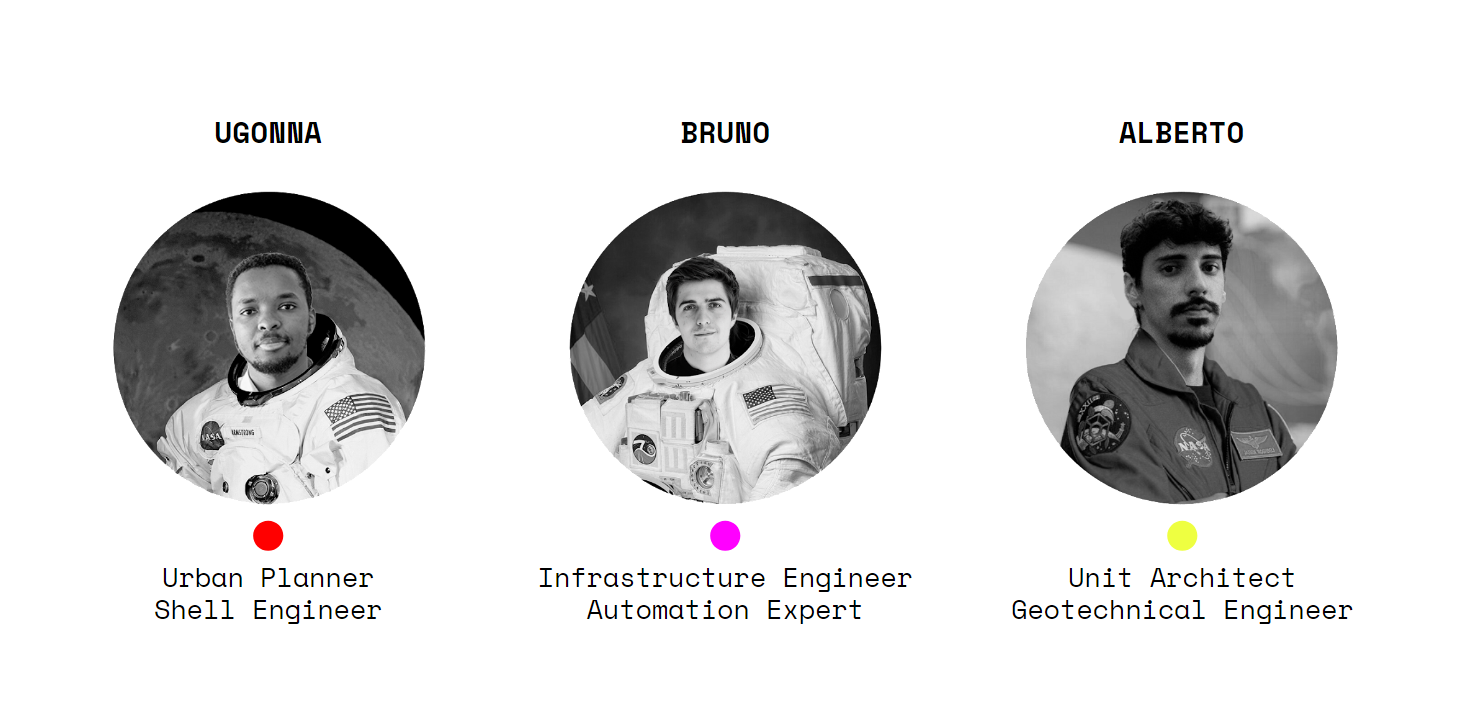
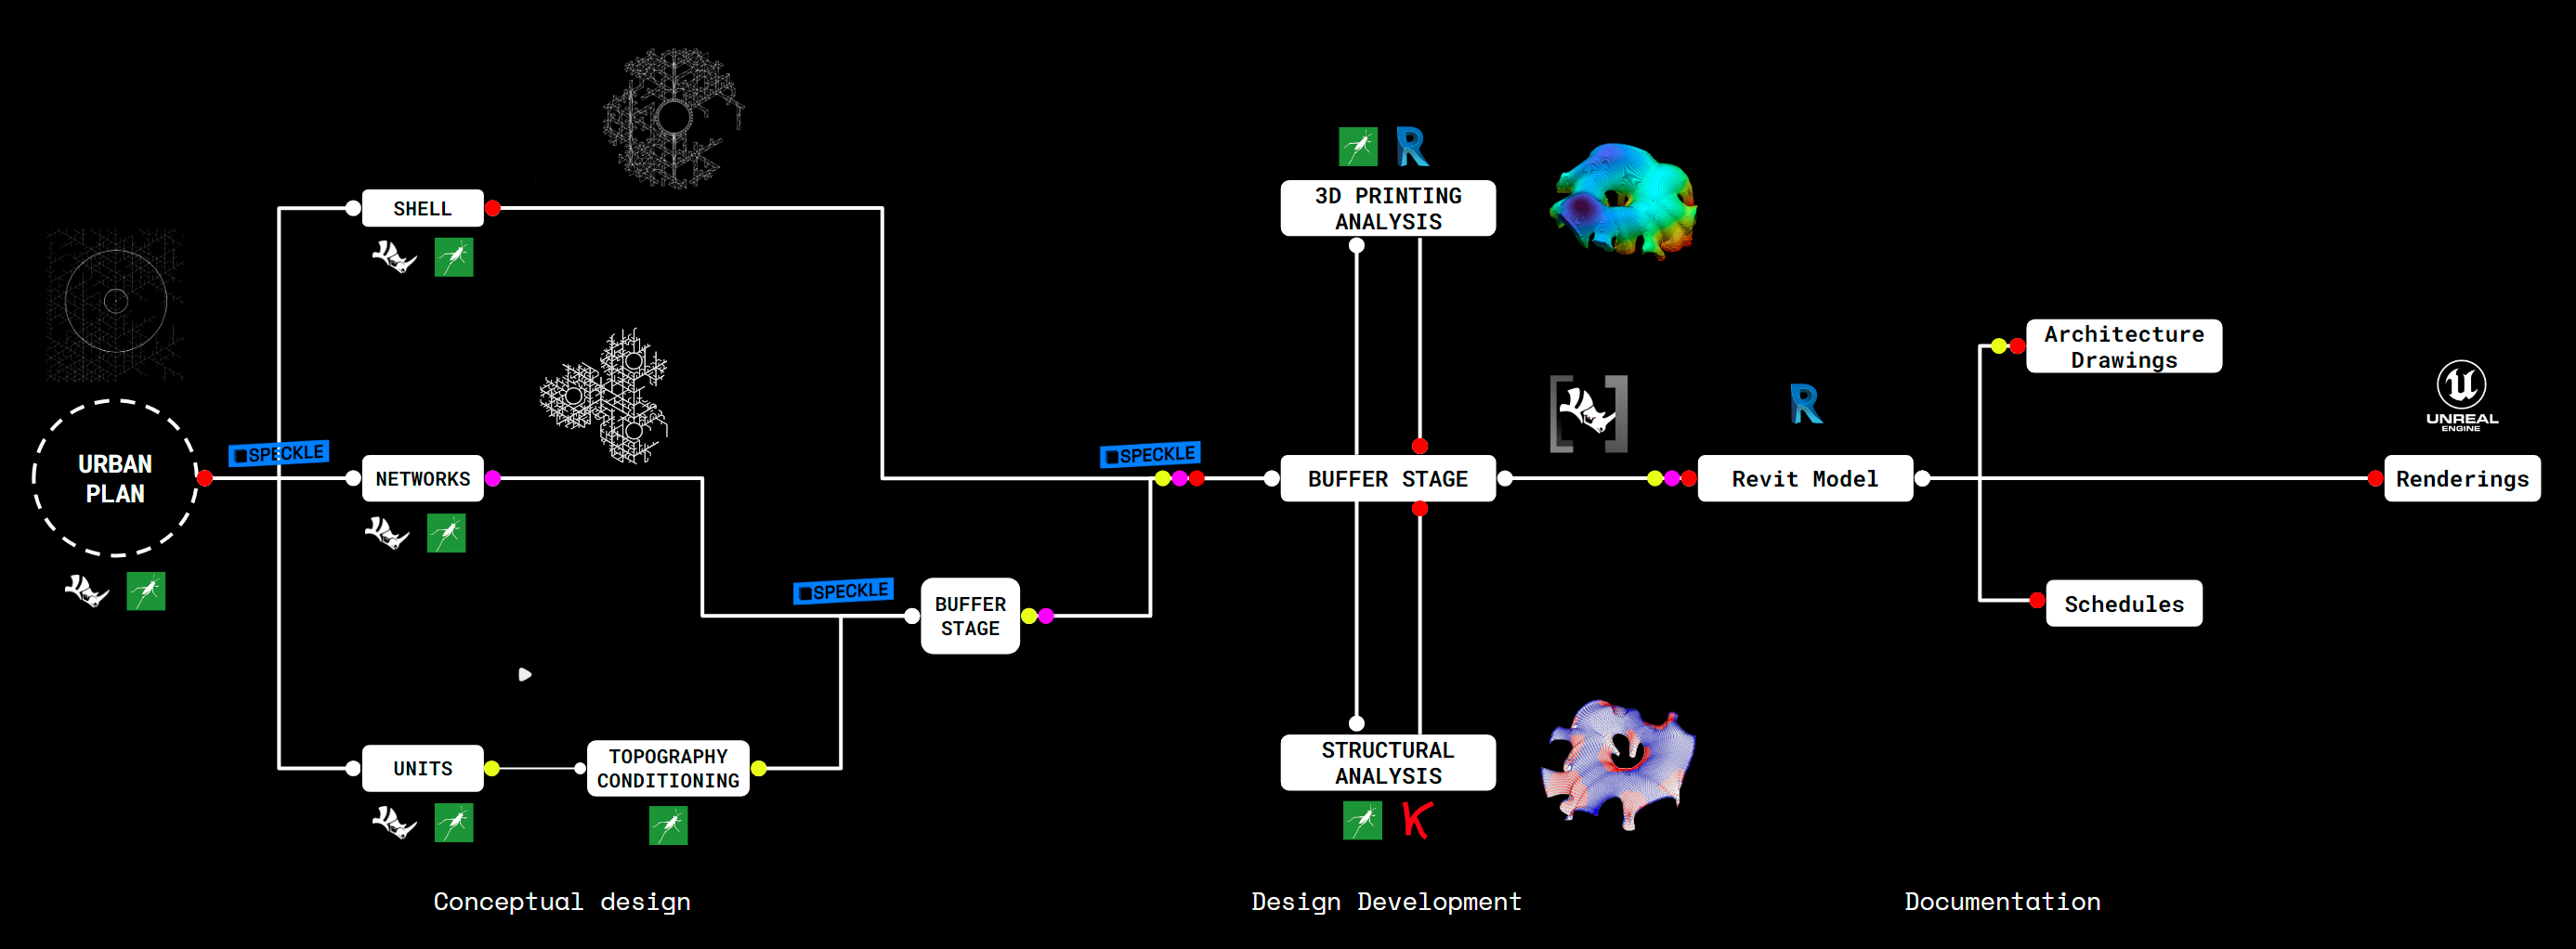
The workflow begins with an urban plan, divides into the shell, networks, and units, with a focus on unit-driven topography. We have several buffer stages for clash detection and then the developed model moves to revit using rhino inside, from this revit model we start the documentation of the project and schedules and proceed to the rendering stage.
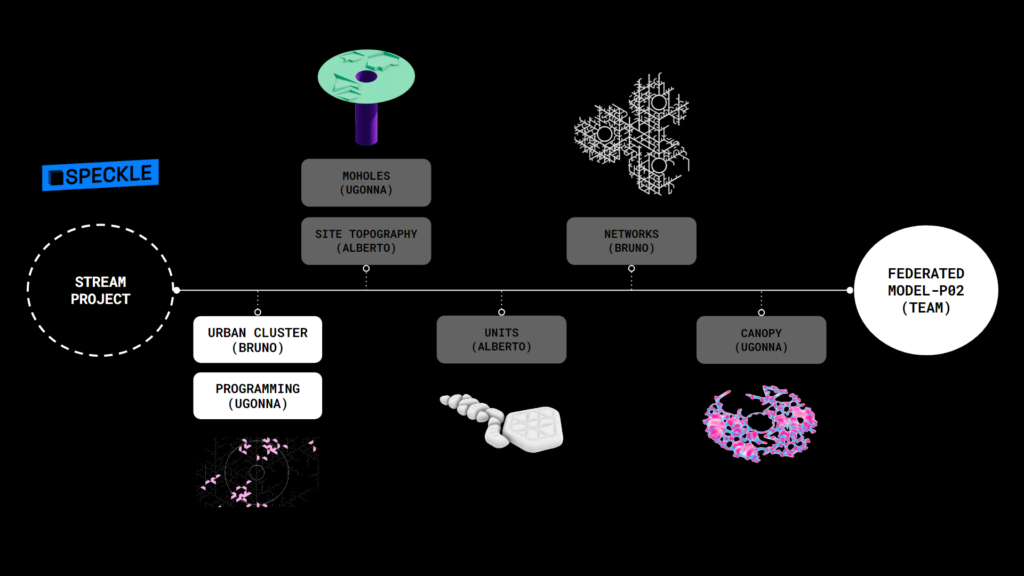
We collaborated using speckle, the stream was divided into 5 main branches, the urban cluster and program, the topograp0hy and moholes, the units, networks and canopy.
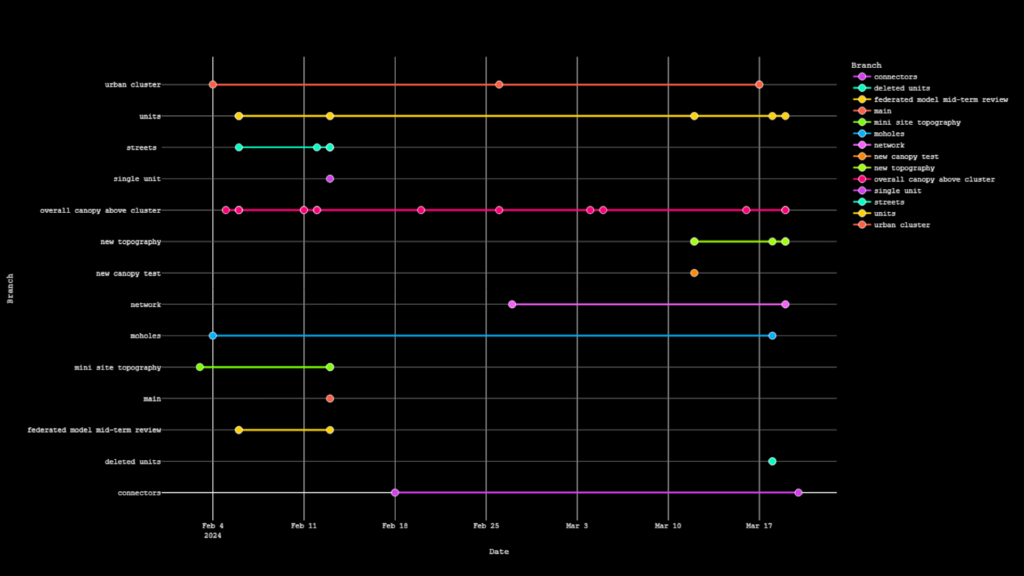
This graph starts to show the commits, and commit times to speckle and the main branches used during the semester.
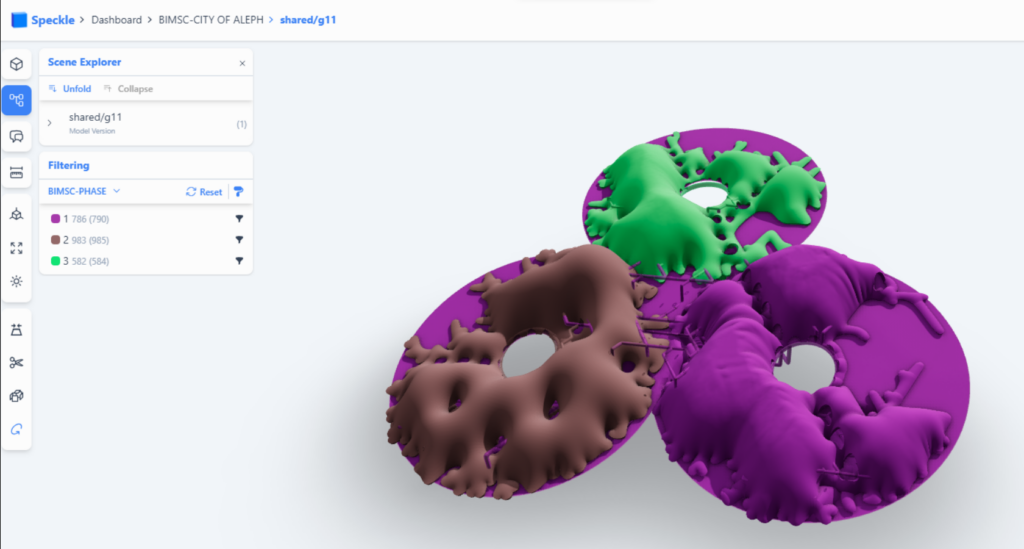
Here we can see our speckle stream dividing the colony in phases according to its construction.
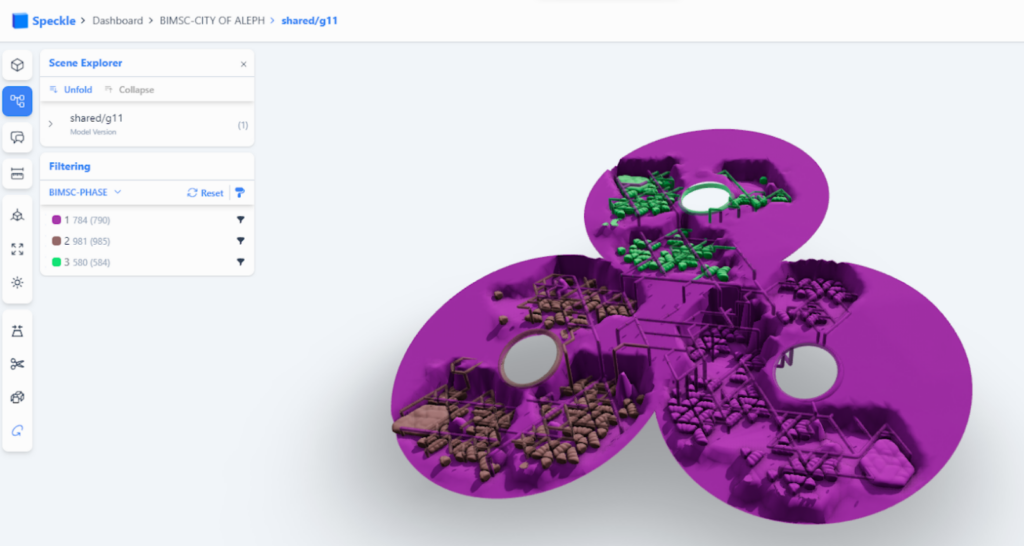
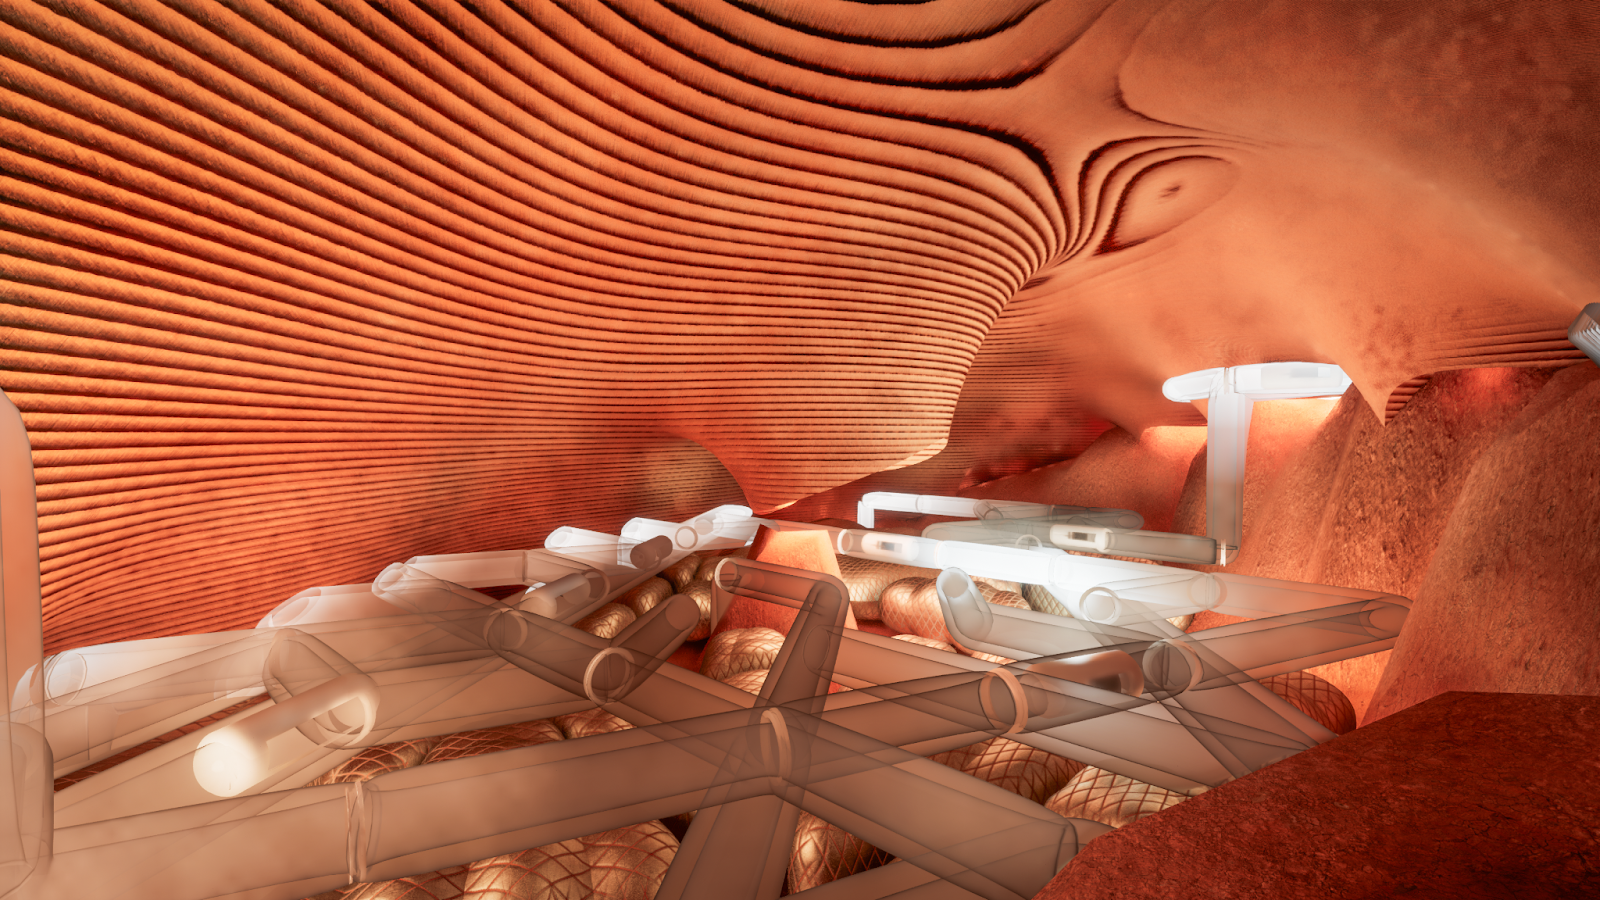
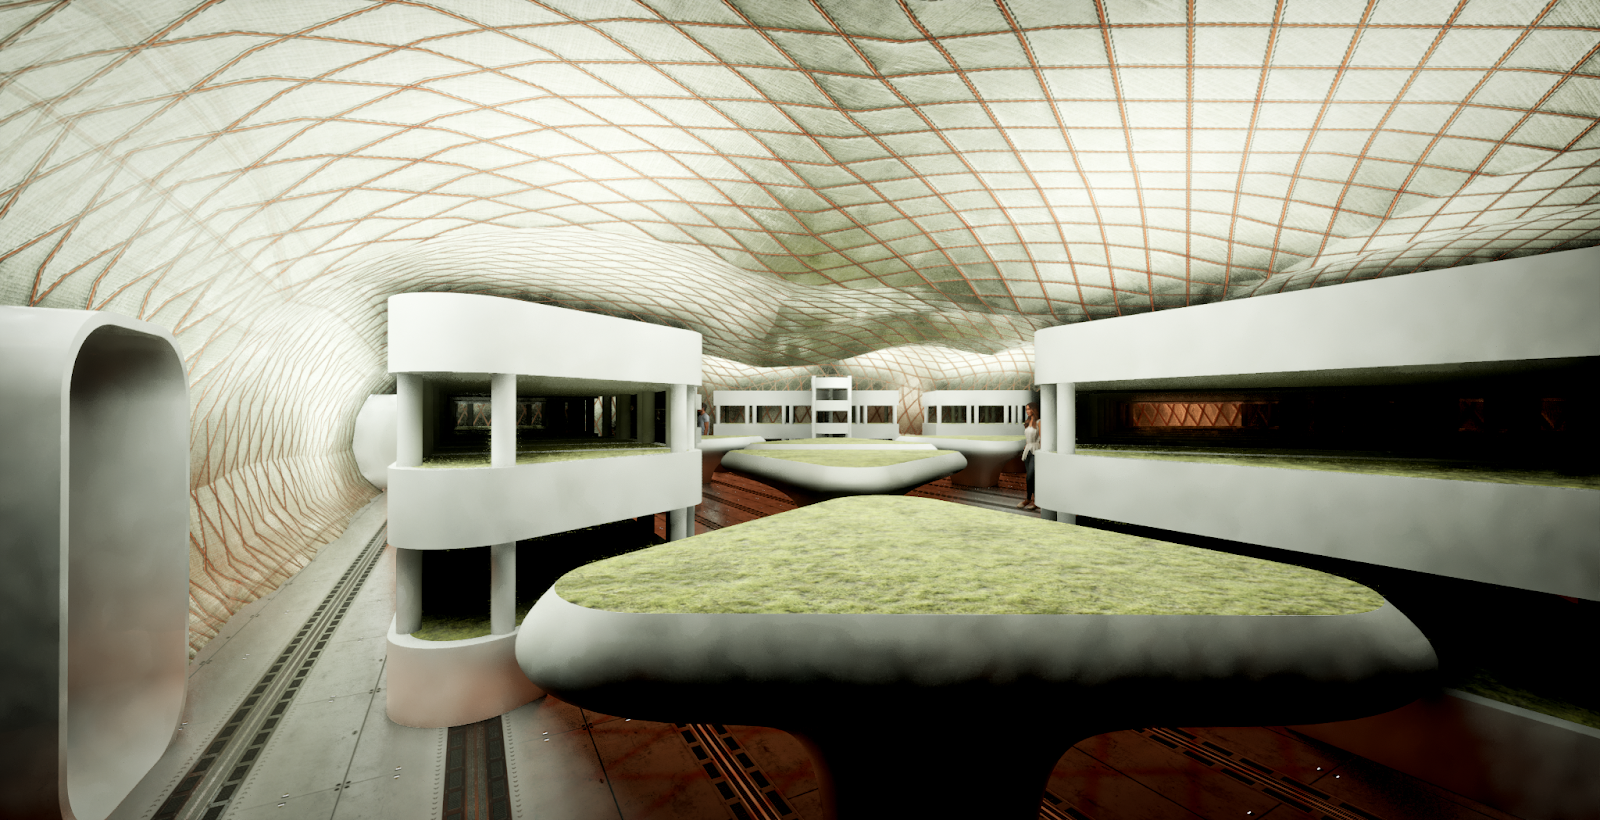
An interior image of the colony in its different phases.
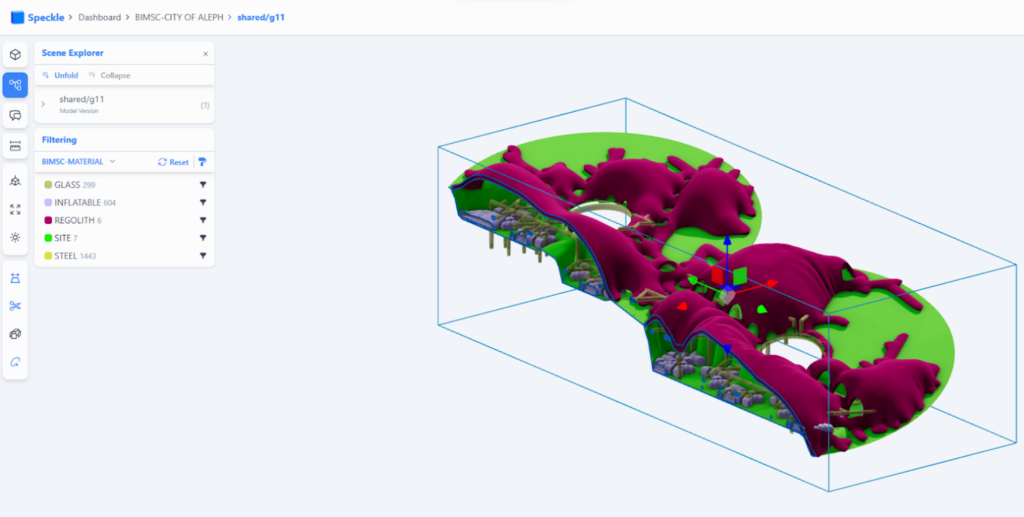
And an interior section that shows the different materials in the project.
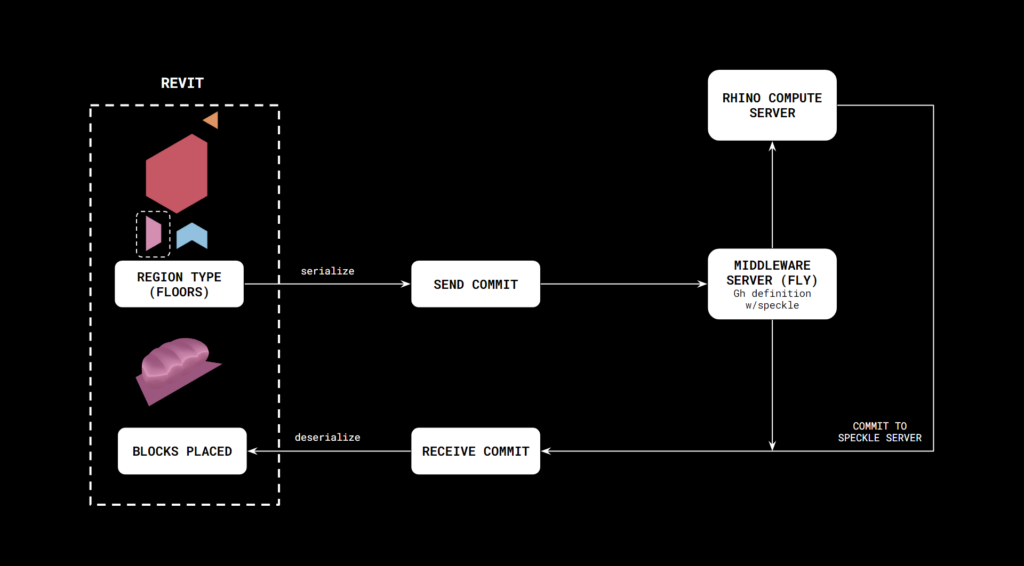
The development of a speckle bot which takes a Revit, Serialize it and committed to a fly server that hosts a rhino compute connection that Enables a grasshopper definition that allows us to place a complete unit model, based on the original Revit geometry, automating the population of the colony.
BIM Documentation
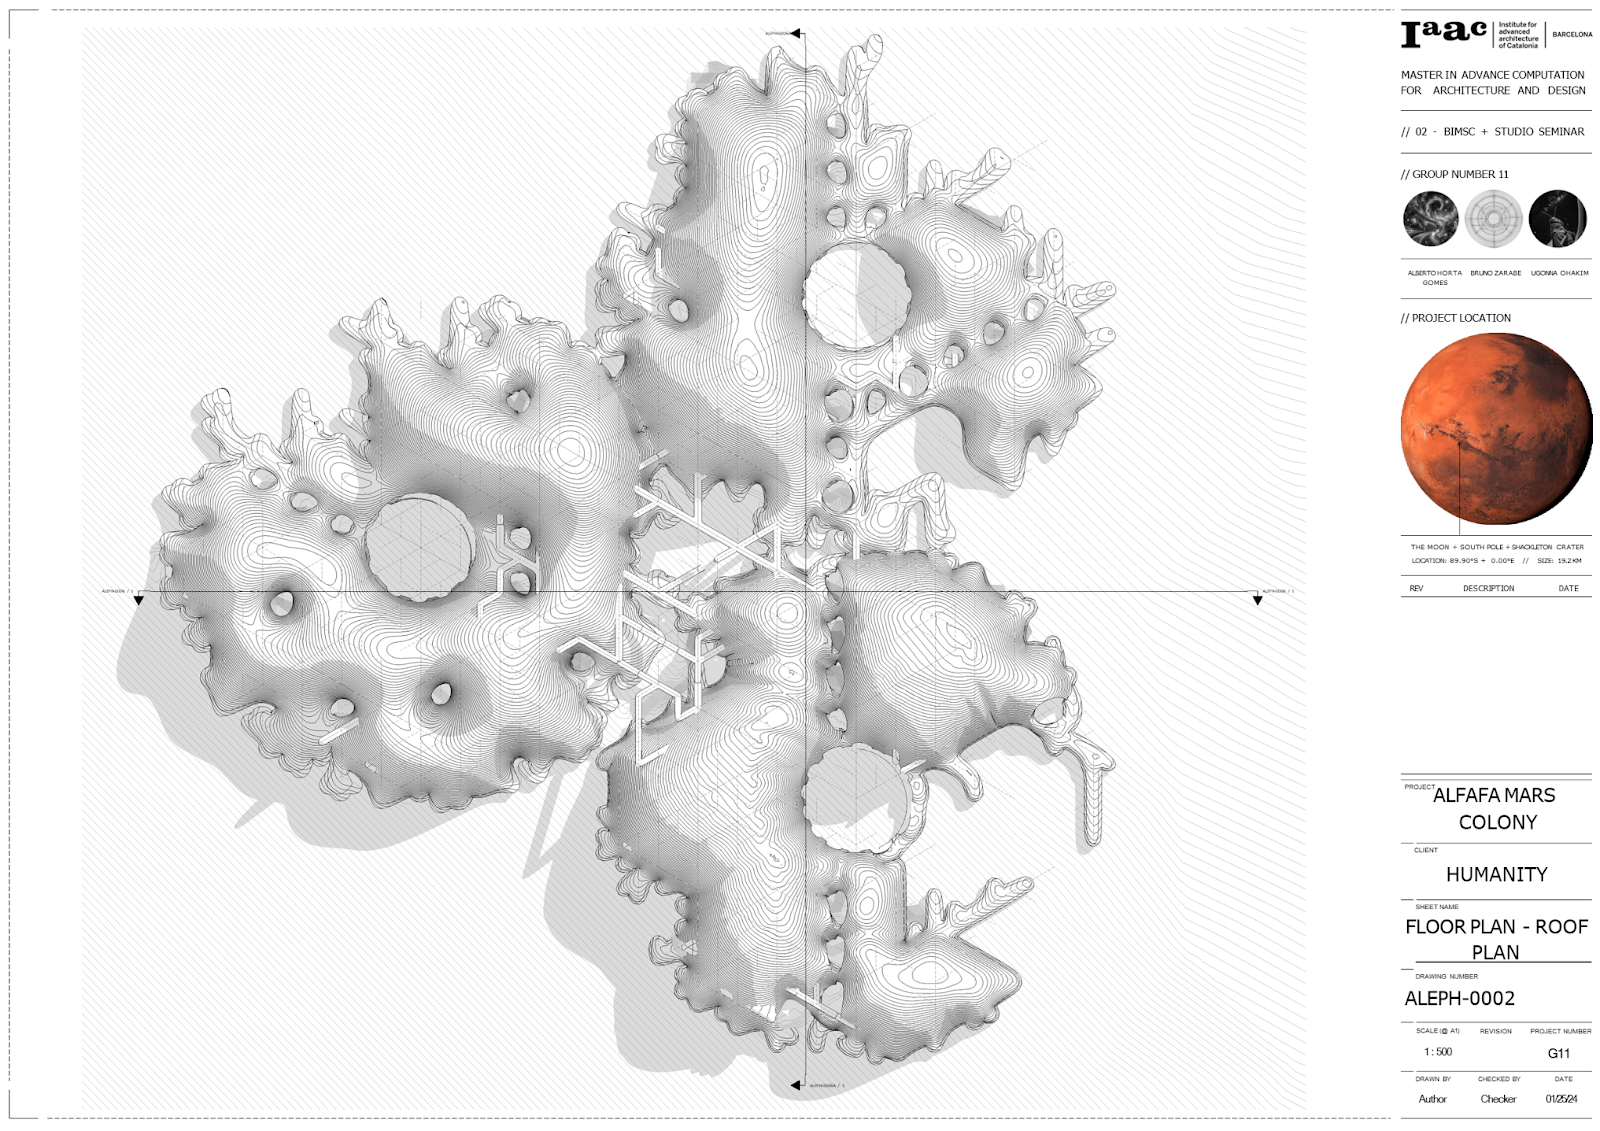
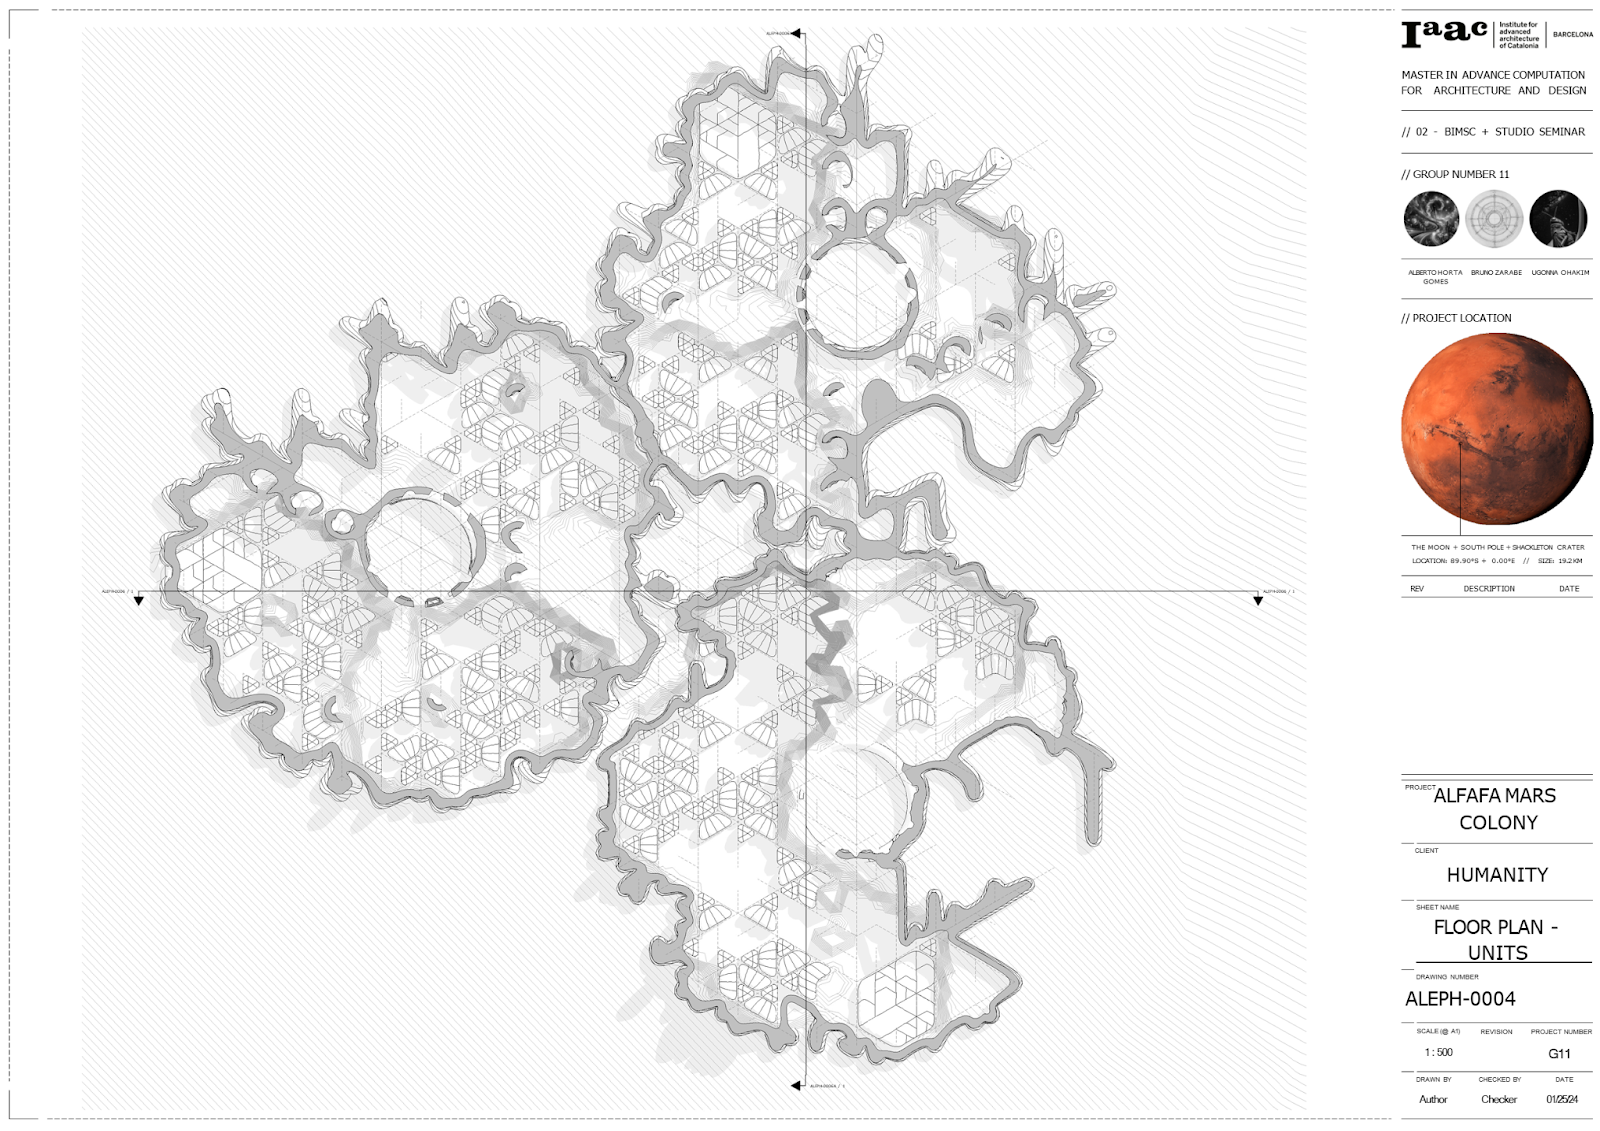
Here is our documentation from revit, the roof plan.
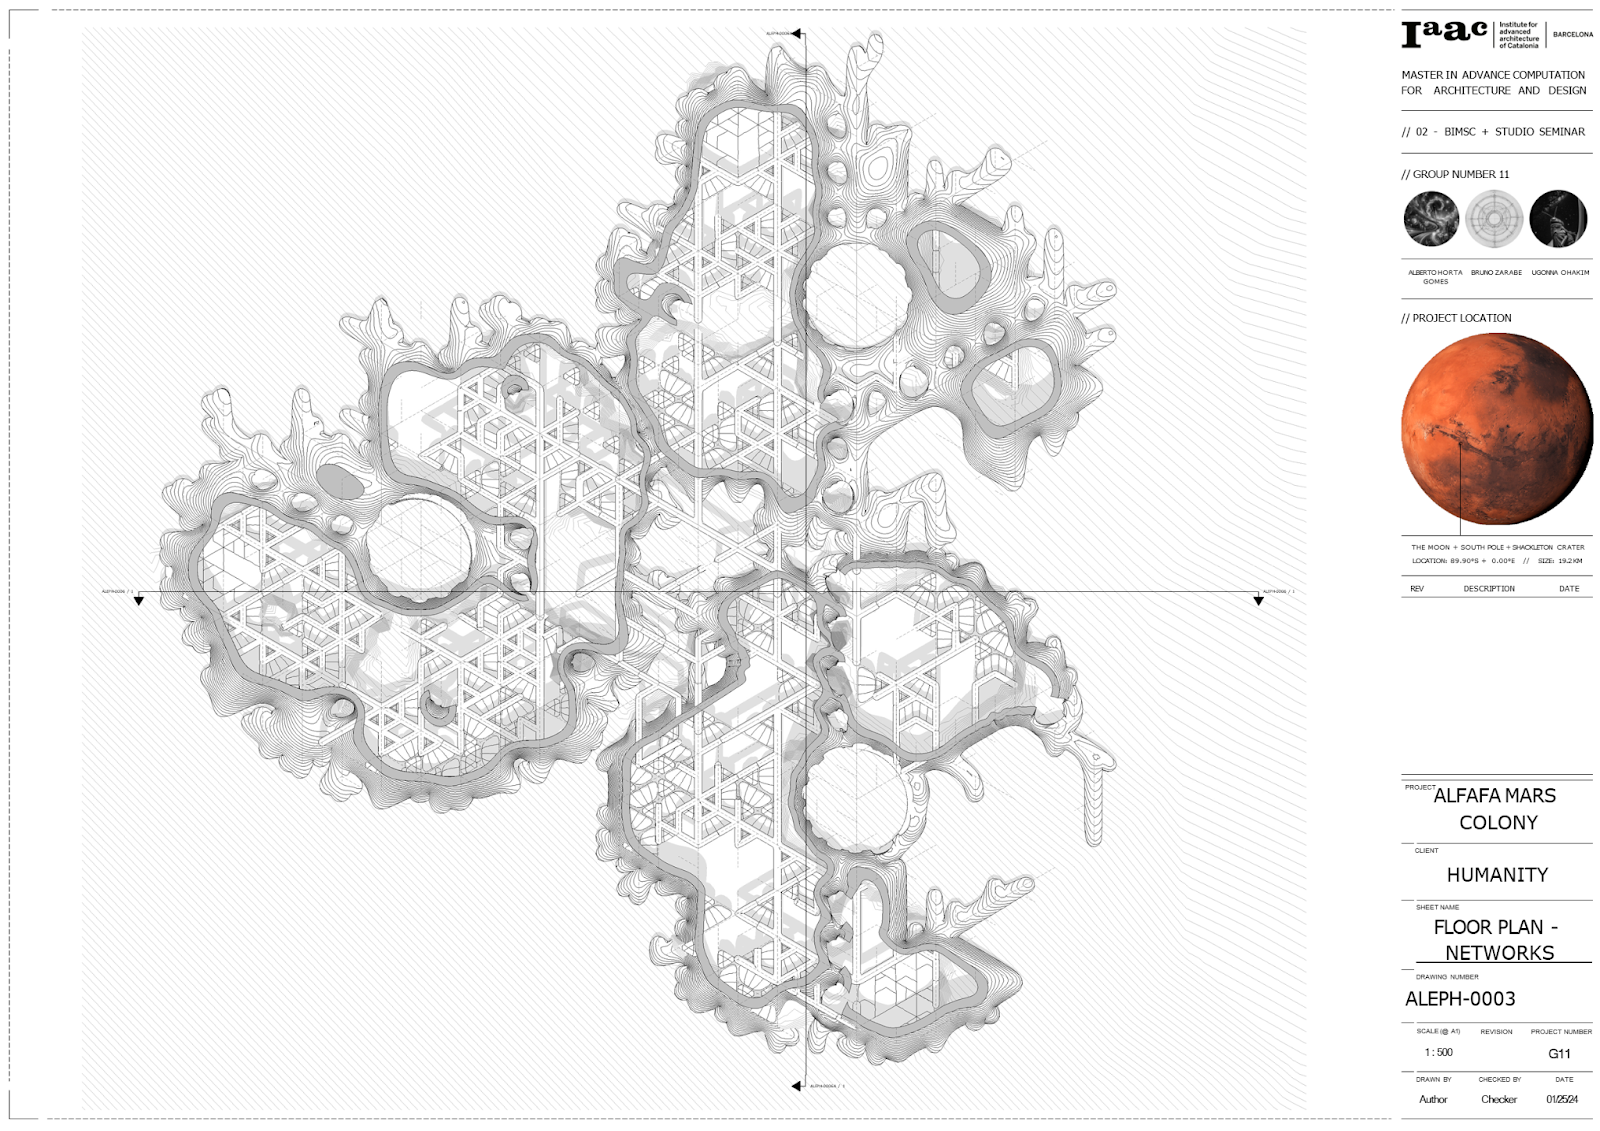
A plan showing the interior of the canopy with the networks and the units.
Another plan showing the units beneath the network
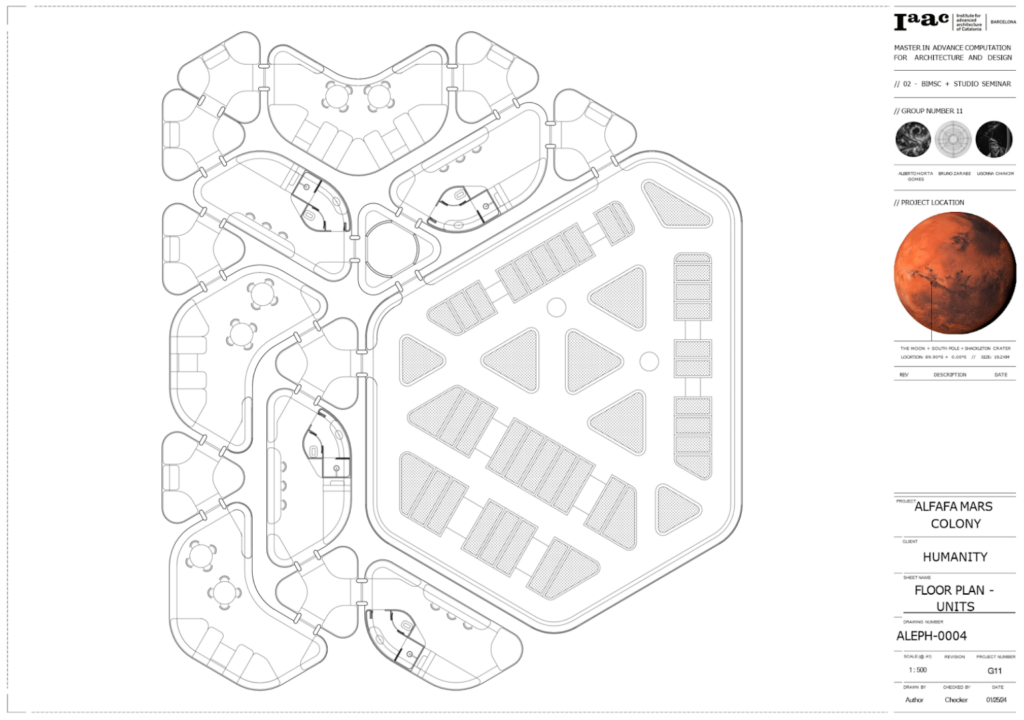
And a more detailed plan, with the interior layout.
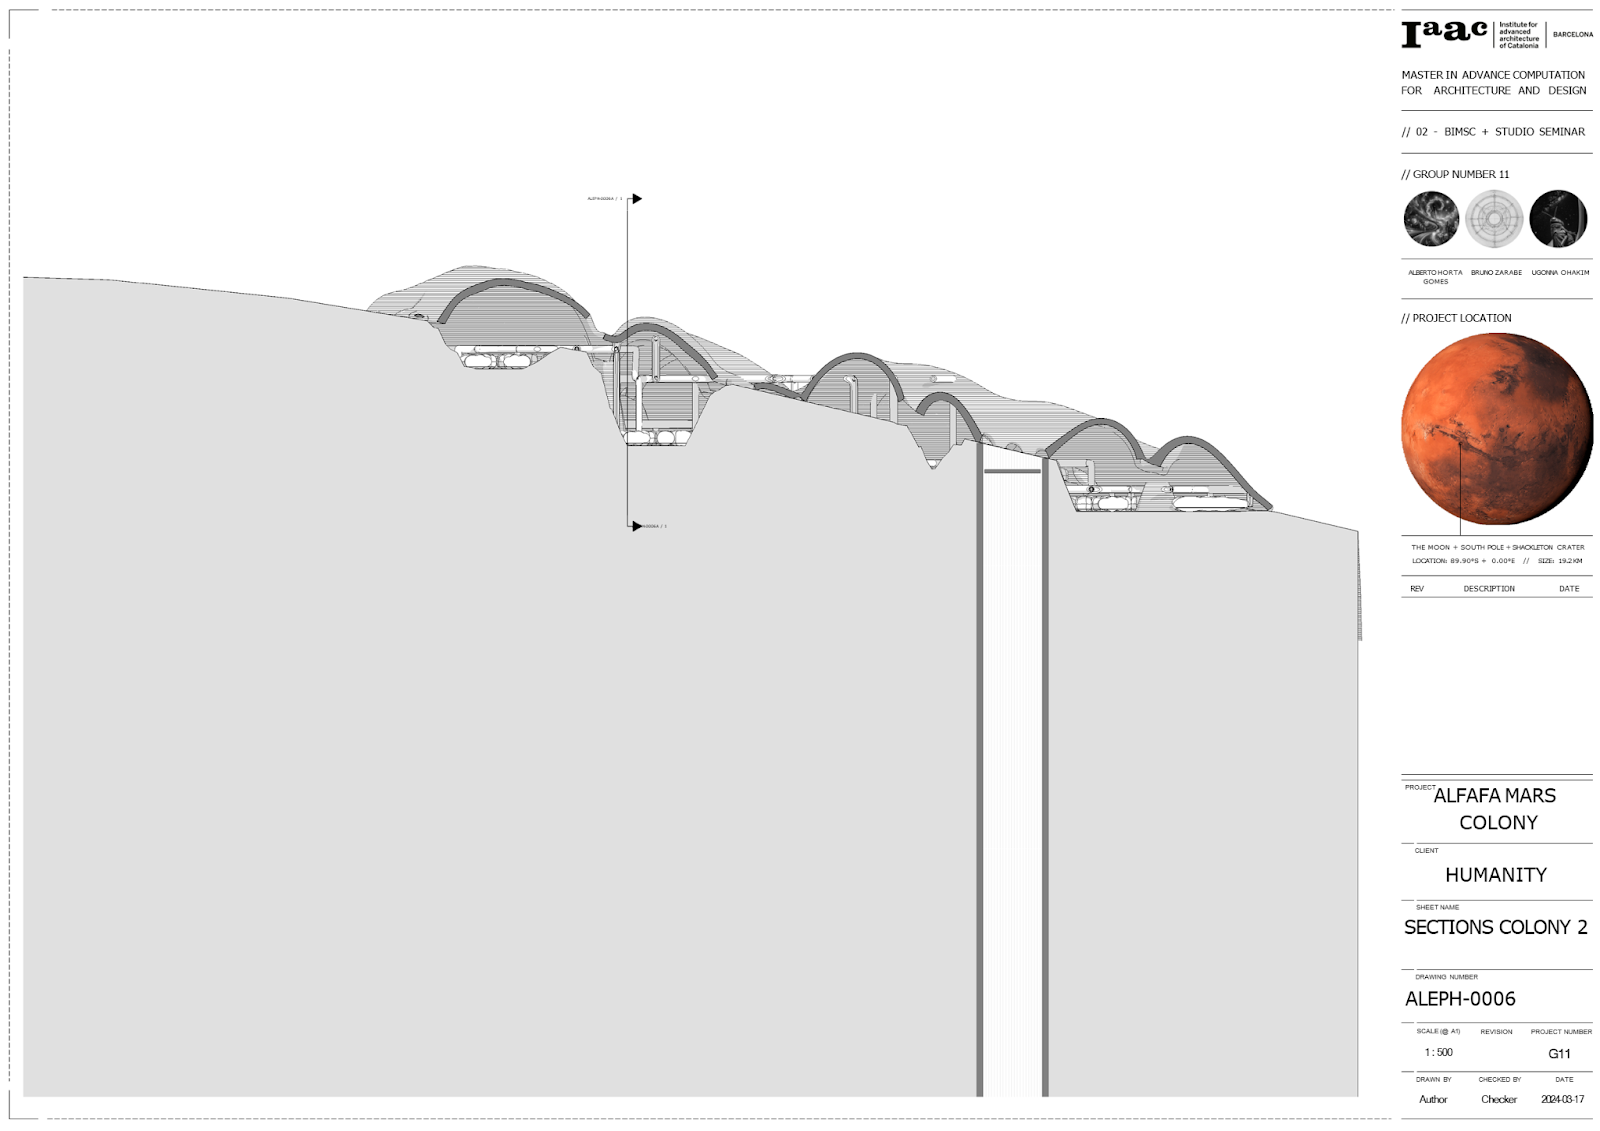
The section showing colony 2
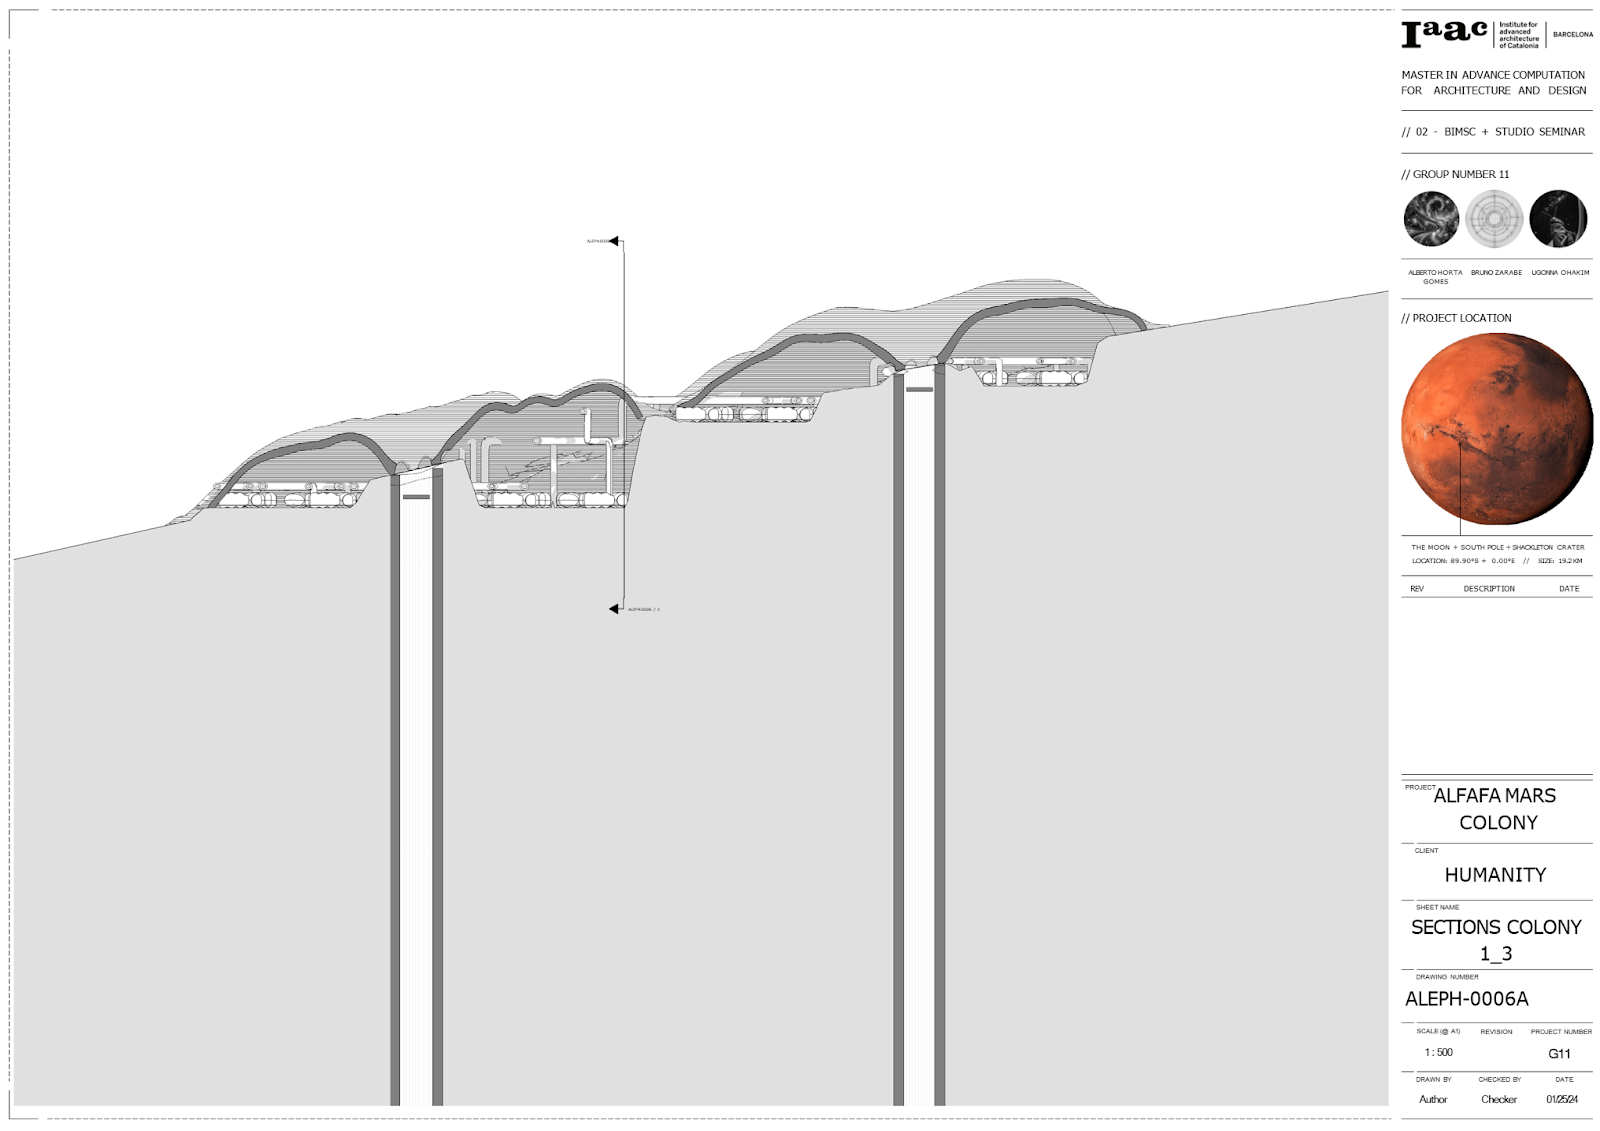
The section showing colony 1 and 3
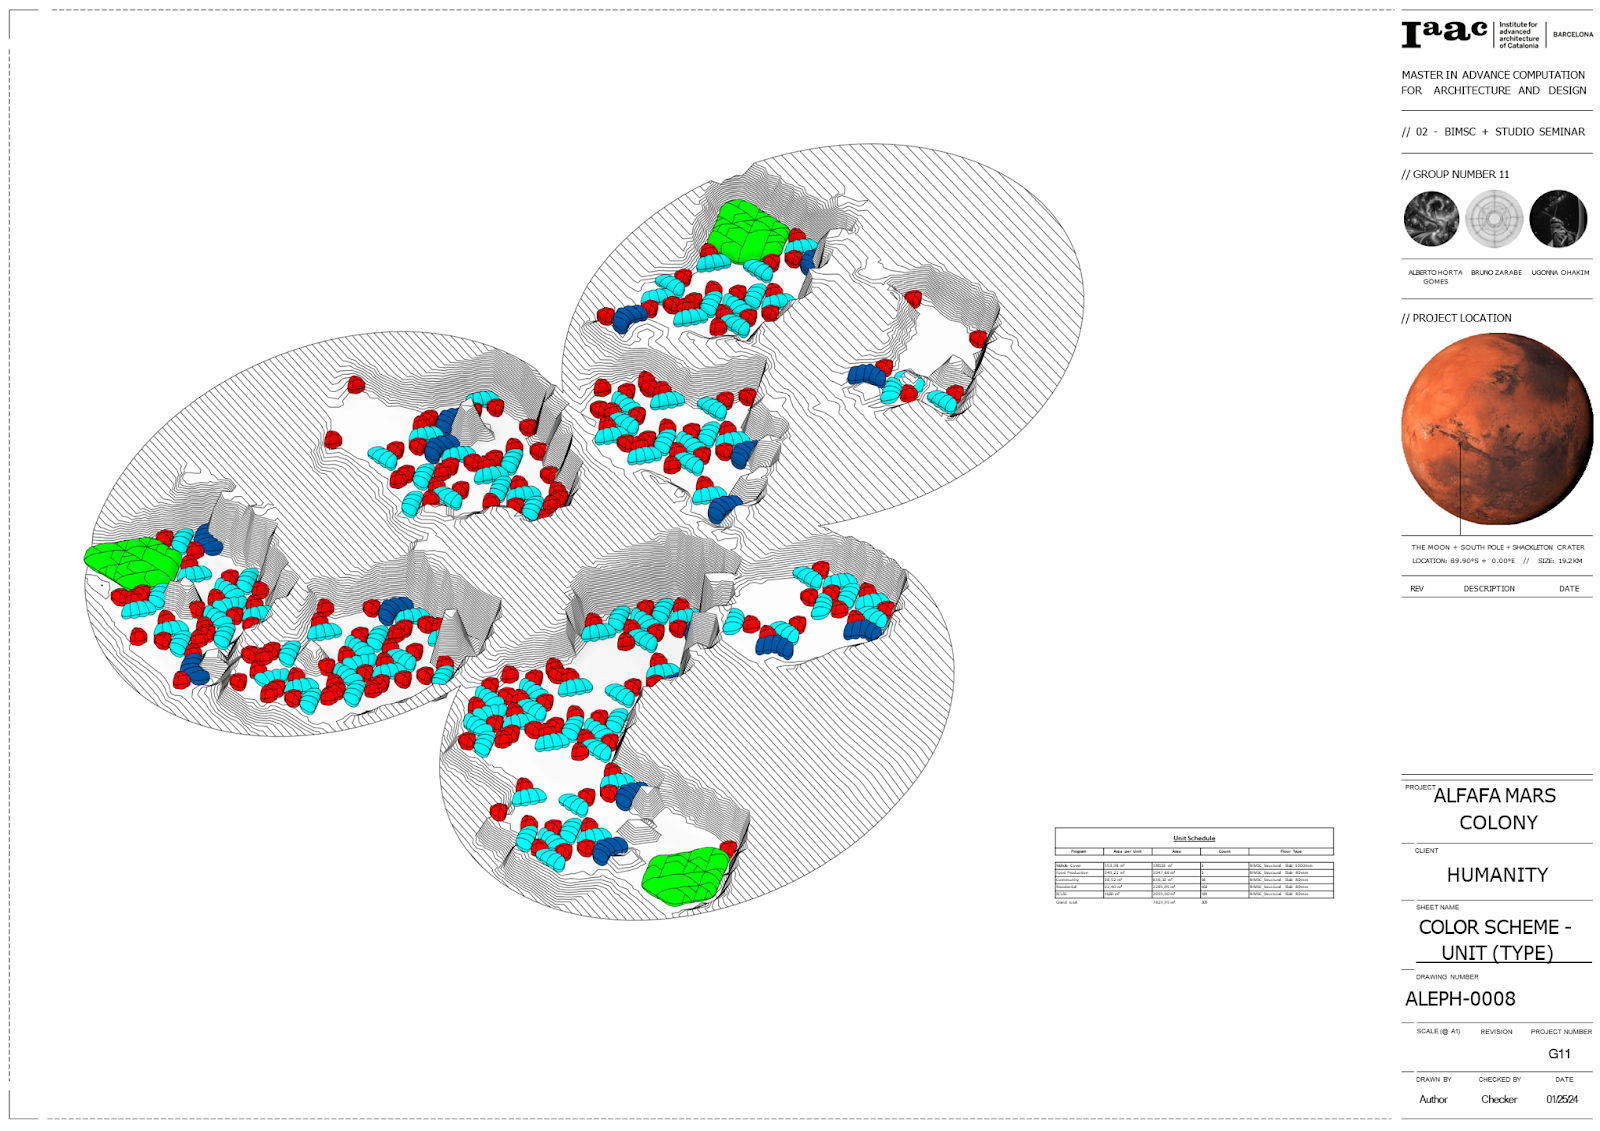
here‘s a color coded diagram showing the density for each type of unit.