Deforestation
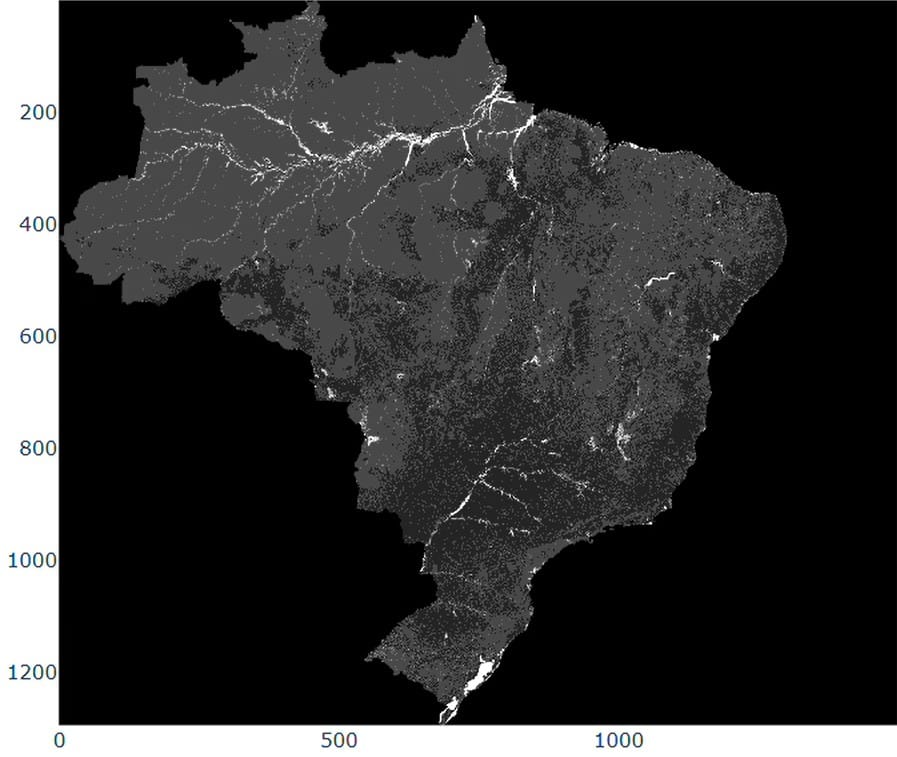
Raster Map – 2024
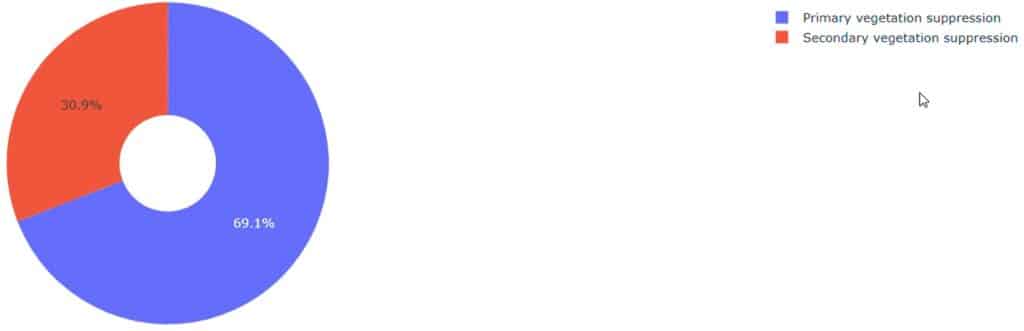
The visualization depicts accumulated and annual deforestation patterns in Brazil from 1985 to 2024. The accumulated dataset shows a continuous rise in total deforested areas, reaching over 140 milllion hectares. Annual trends reveal strong fluctuations, with peaks in the late 1980’s and mid-2000’s, followed by decreases and renewed variability in recent years. In 2024, primary vegetation supression accounts for 69.1% of total deforestation, while secondary vegetation represents 30.9%. These patterns highlight long-term pressures on natural ecosystems, demonstrating how persistent land conversion shapes landscapes and emphasizing the urgency of conservation and sustainable land-use policies.
Deforestation Time Series – 1985 till 2025
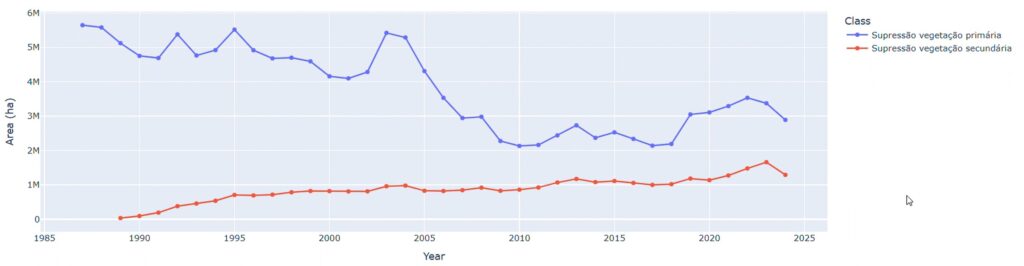
Deforestation in 2025 by Class
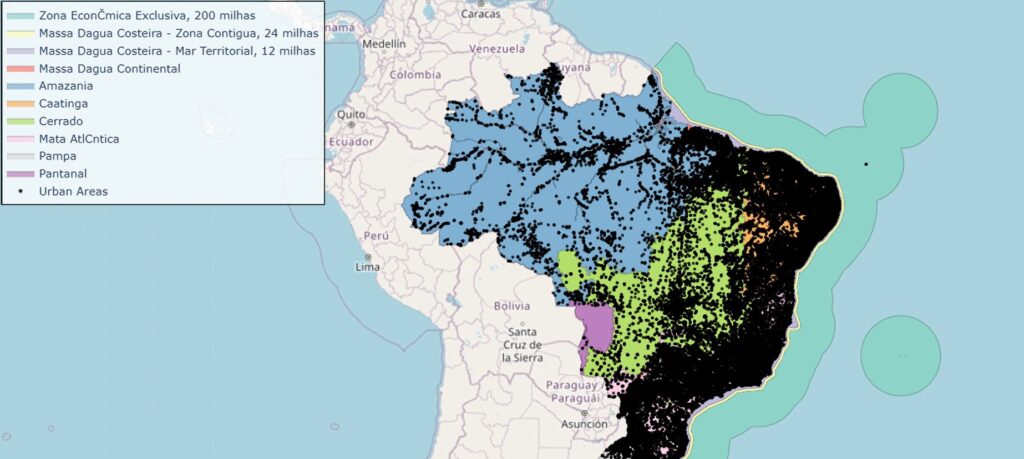
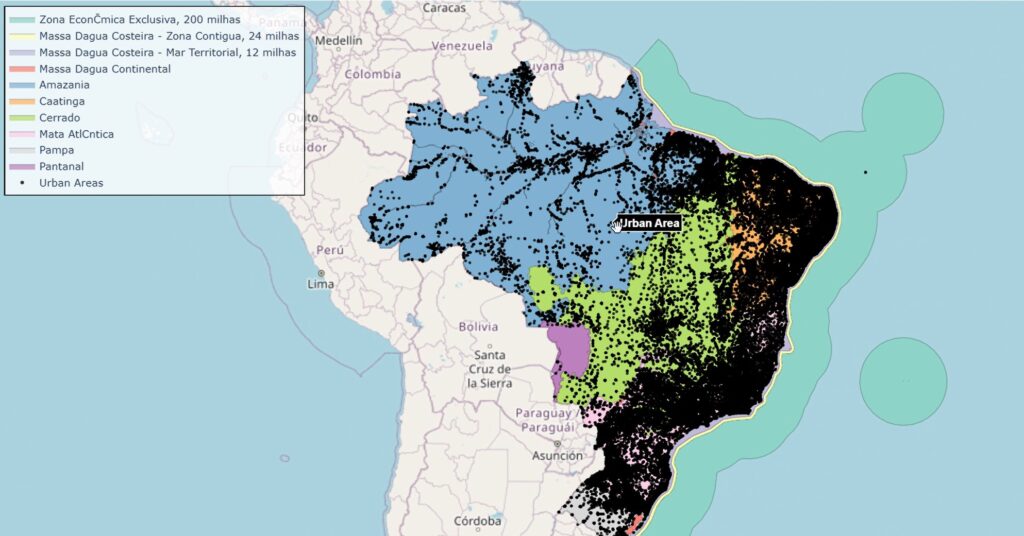
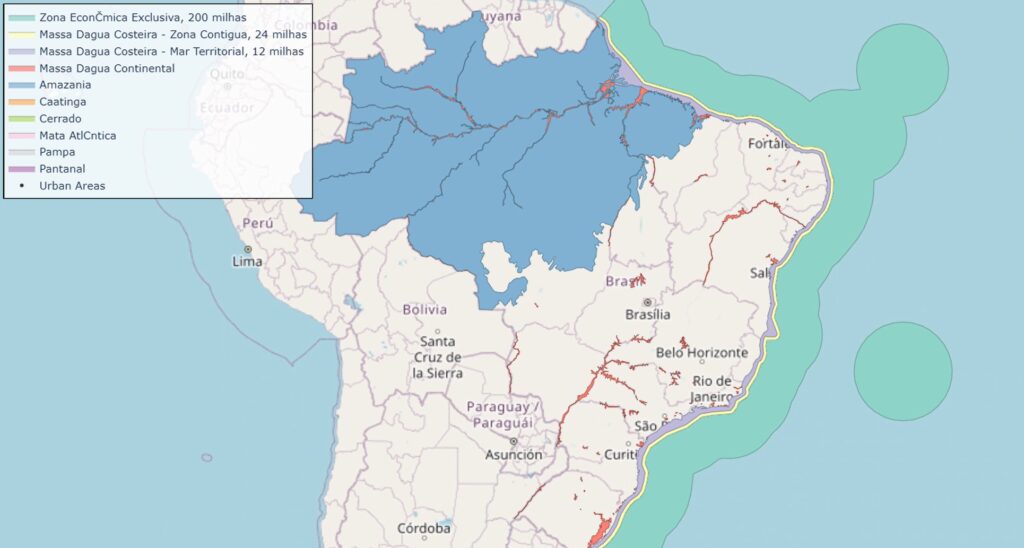
Biomes and Urban Areas – Interactive Map
Hover over each biome to see its name and highlight it. Each color represents a different biome. Urban areas are shown as black dots. You can zoom, pan, and click on legend items to show/hide biomes.
Land Cover
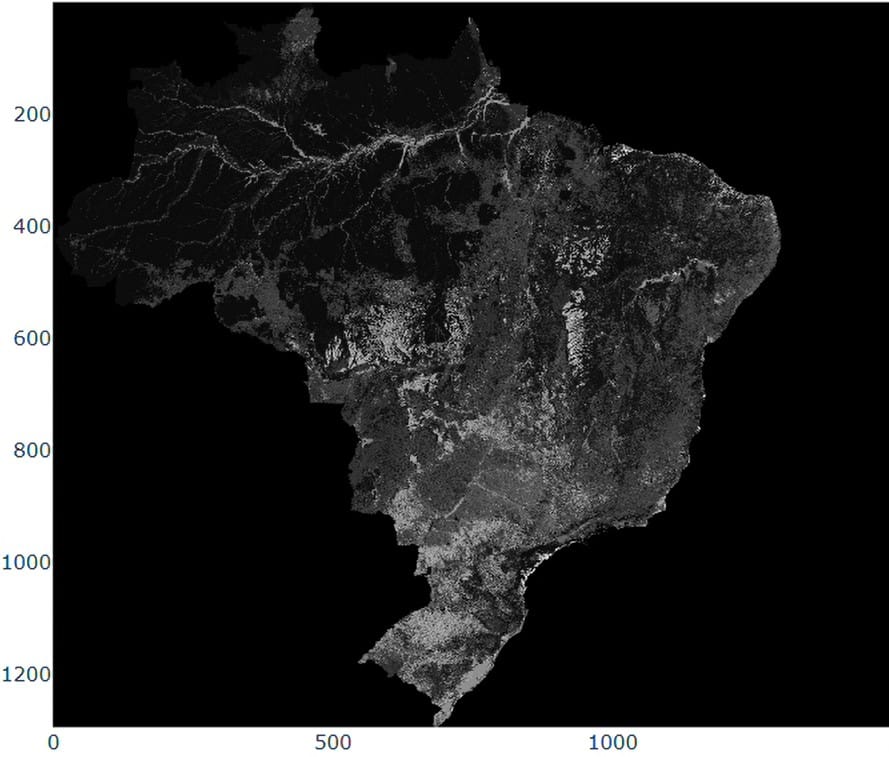
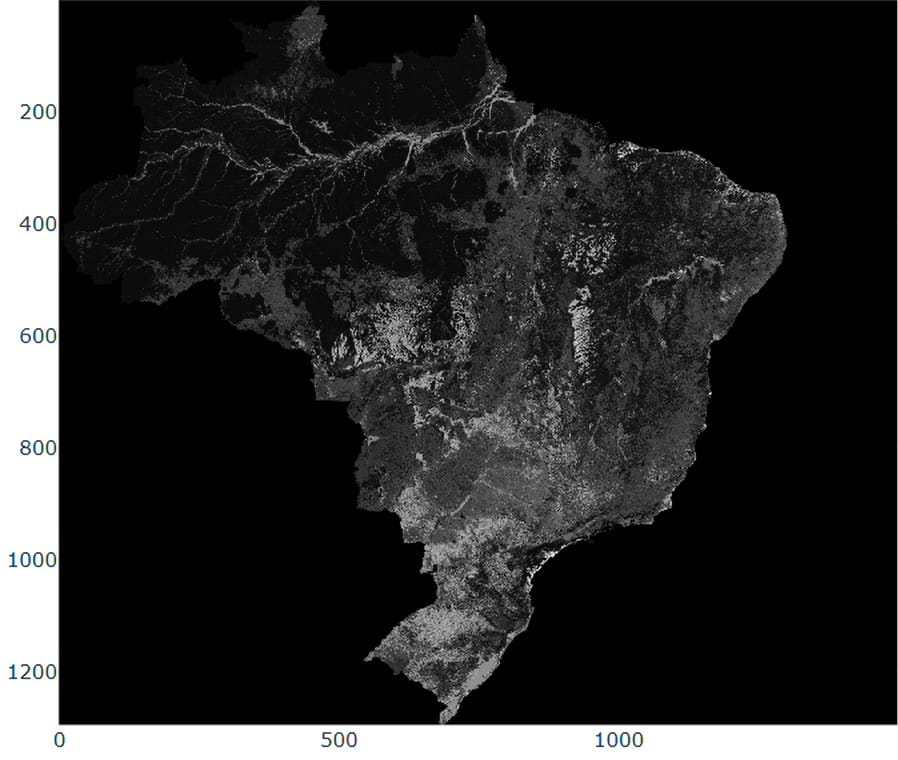
Raster Map 2024
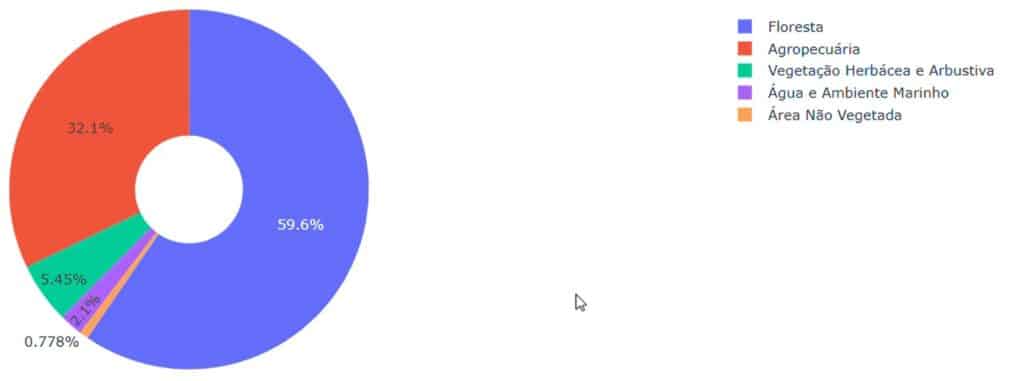
The visualization presents Brazil’s land cover in 2024, showing the dominance of forest formations, which occupy about 59.6% of the territory. The 1985-2024 time series reveals a gradual reduction in forest cover and steady agricultural expansion. These patterns reflect the diversity of Brazilian biomes, each contributing distinct landscapes.
Together, the charts illustrate structural changes in land use, showing human pressures and emphasizing the importance of remaining natural ecosystems.
Land Cover Time Series by Class – 1985 till 2024
Select the land cover class
Land Cover of the Territory in 2024
Biomes and Urban Areas – Interactive Map
Hover over each biome to see its name and highlight it. Each color represents a different biome. Urban areas are shown as black dots. You can zoom, pan, and click on legend items to show/hide biomes.
Urbanization
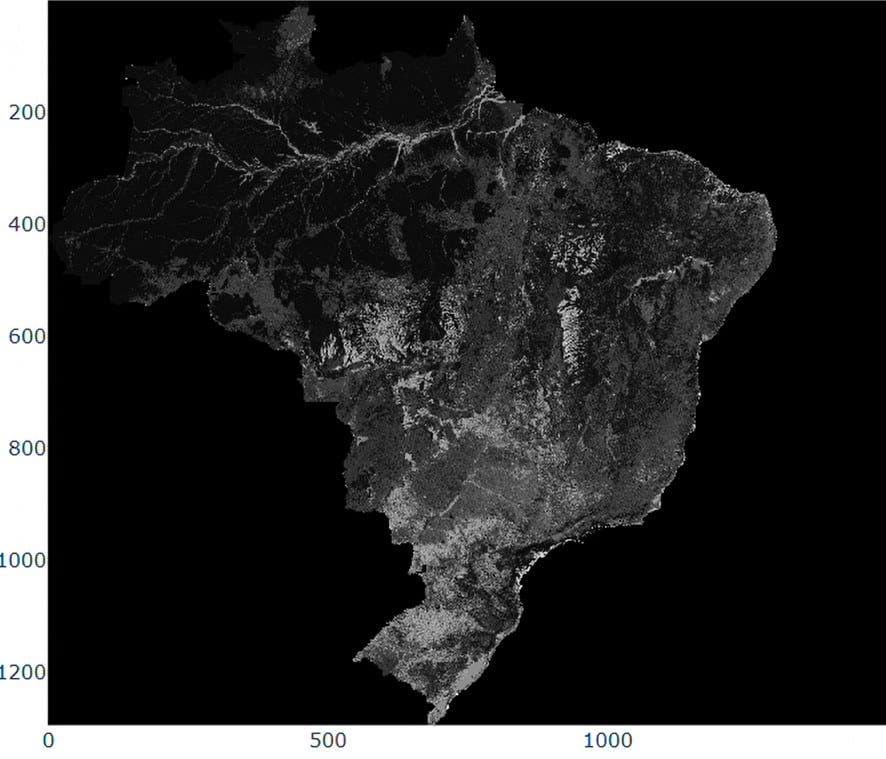
Raster Map 2024
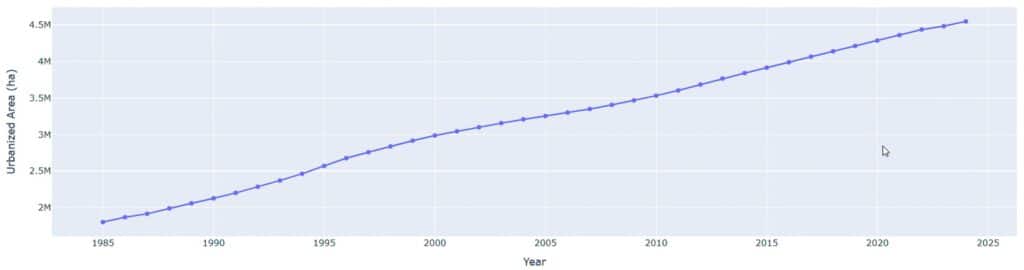
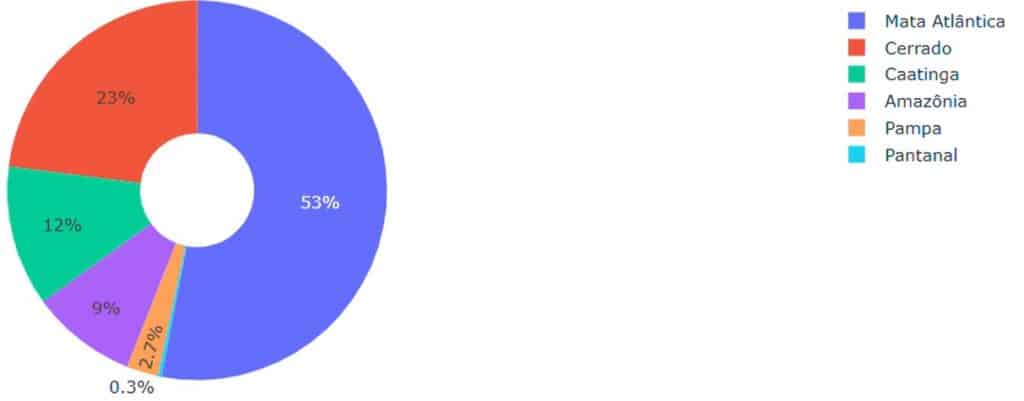
The visualization shows the expansion of urbanized areas in Brazil in 2024, highlighting where new urban growth has occurred. The time series from 4985 to 2024 reveals a steady and continuous increase in urban extent, rising from under 2 million hectares to more than 4 million hectares. The ranking of biomes indicates that the Atlantic Forest leads urban expansion with over 2.3 million hectares, followed by the Cerrado and Caatinga. These patterns reflect long-term demographic and infrastructural trends, illustrating how urbanization reshapes landscapes and emphasizing the need for planning strategies that balance development and
environmental sustainability.
Land Cover Time Series by Class – 1985 till 2024
Select the land cover class:
Land Cover of the Territory in 2024
Biomes and Urban Areas – Interactive Map
Hover over each biome to see its name and highlight it. Each color represents a different biome. Urban areas are shown as black dots. You can zoom, pan, and click on legend items to show/hide biomes.