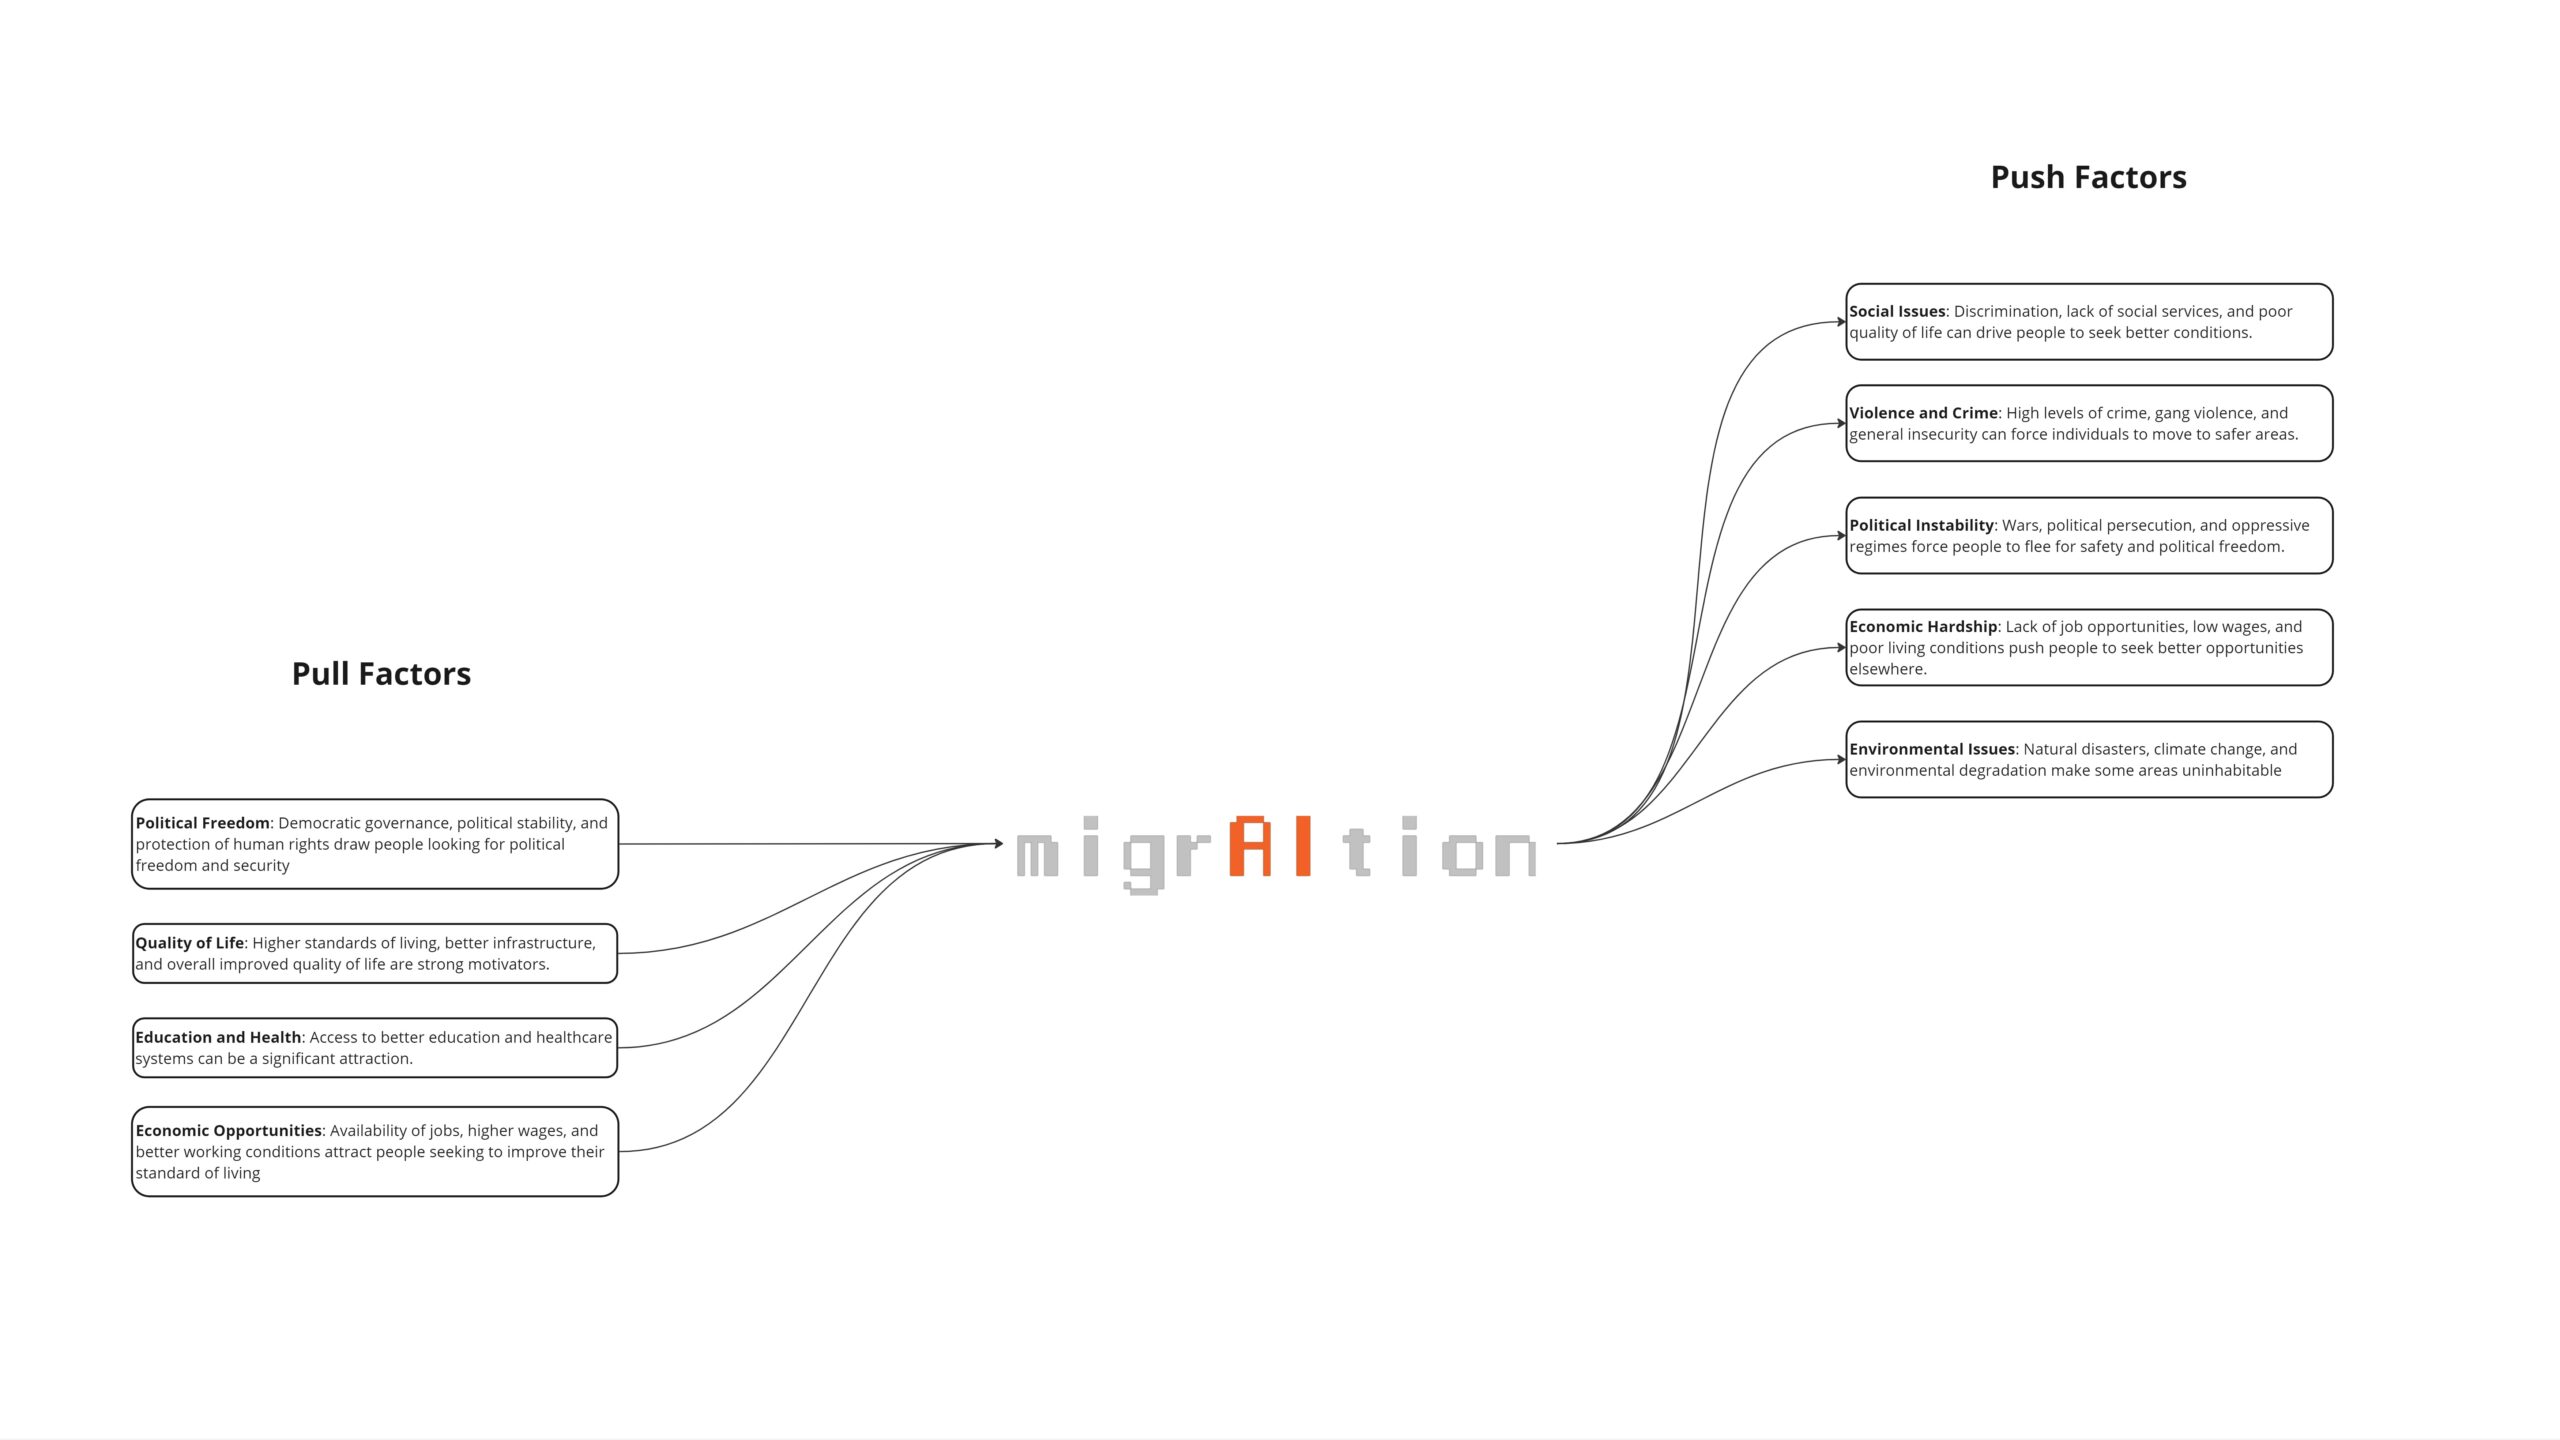
Studying migration is crucial for urban planners and architects to anticipate and accommodate the influx of people into cities, ensuring the development of robust infrastructure that can support this growth. As migration patterns shape demographic changes, understanding these trends allows cities to plan for adequate housing, transportation, healthcare, and educational facilities. This foresight is essential for managing urban growth sustainably and avoiding the pitfalls of overcrowding, resource depletion, and infrastructural strain. By integrating migration studies into urban planning, architects and policymakers can design cities that are resilient, inclusive, and capable of adapting to the dynamic nature of population movements, thereby fostering thriving urban environments.
To identify the most popular cities for migration, a custom dataset was created to test the correlation between net migration and specific city KPIs. Feature selection was based on the availability of data for each city.
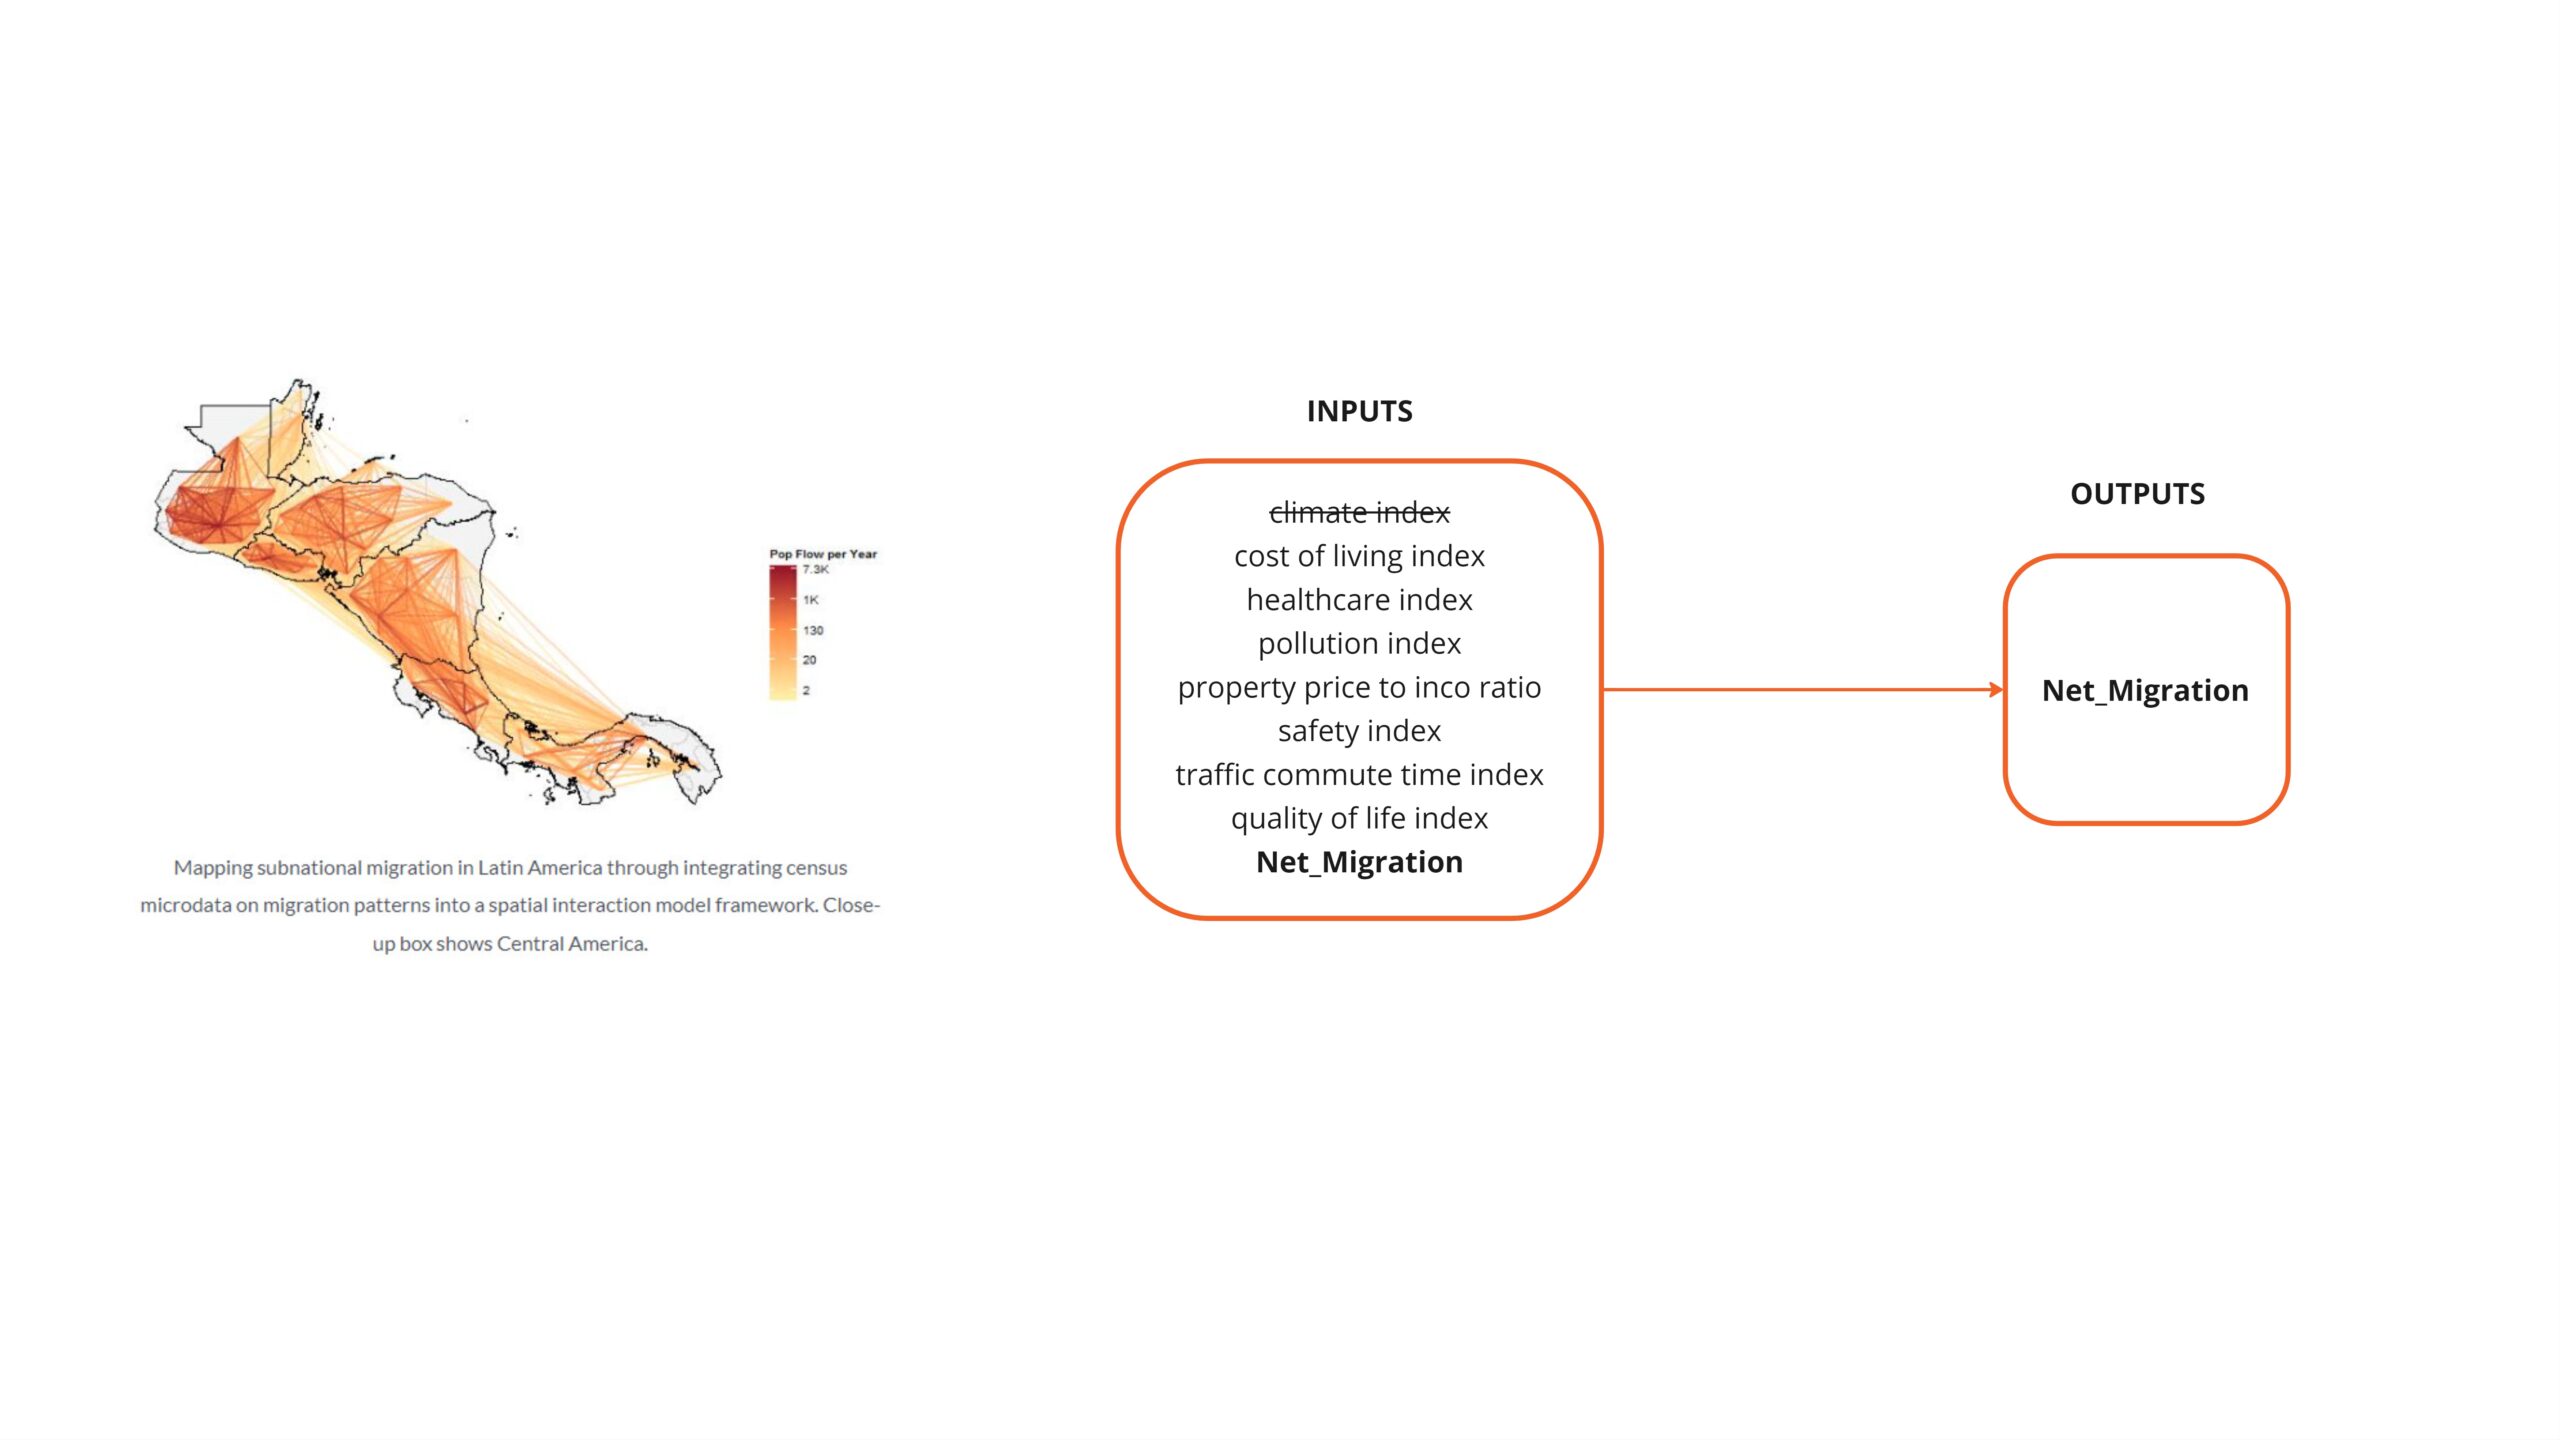
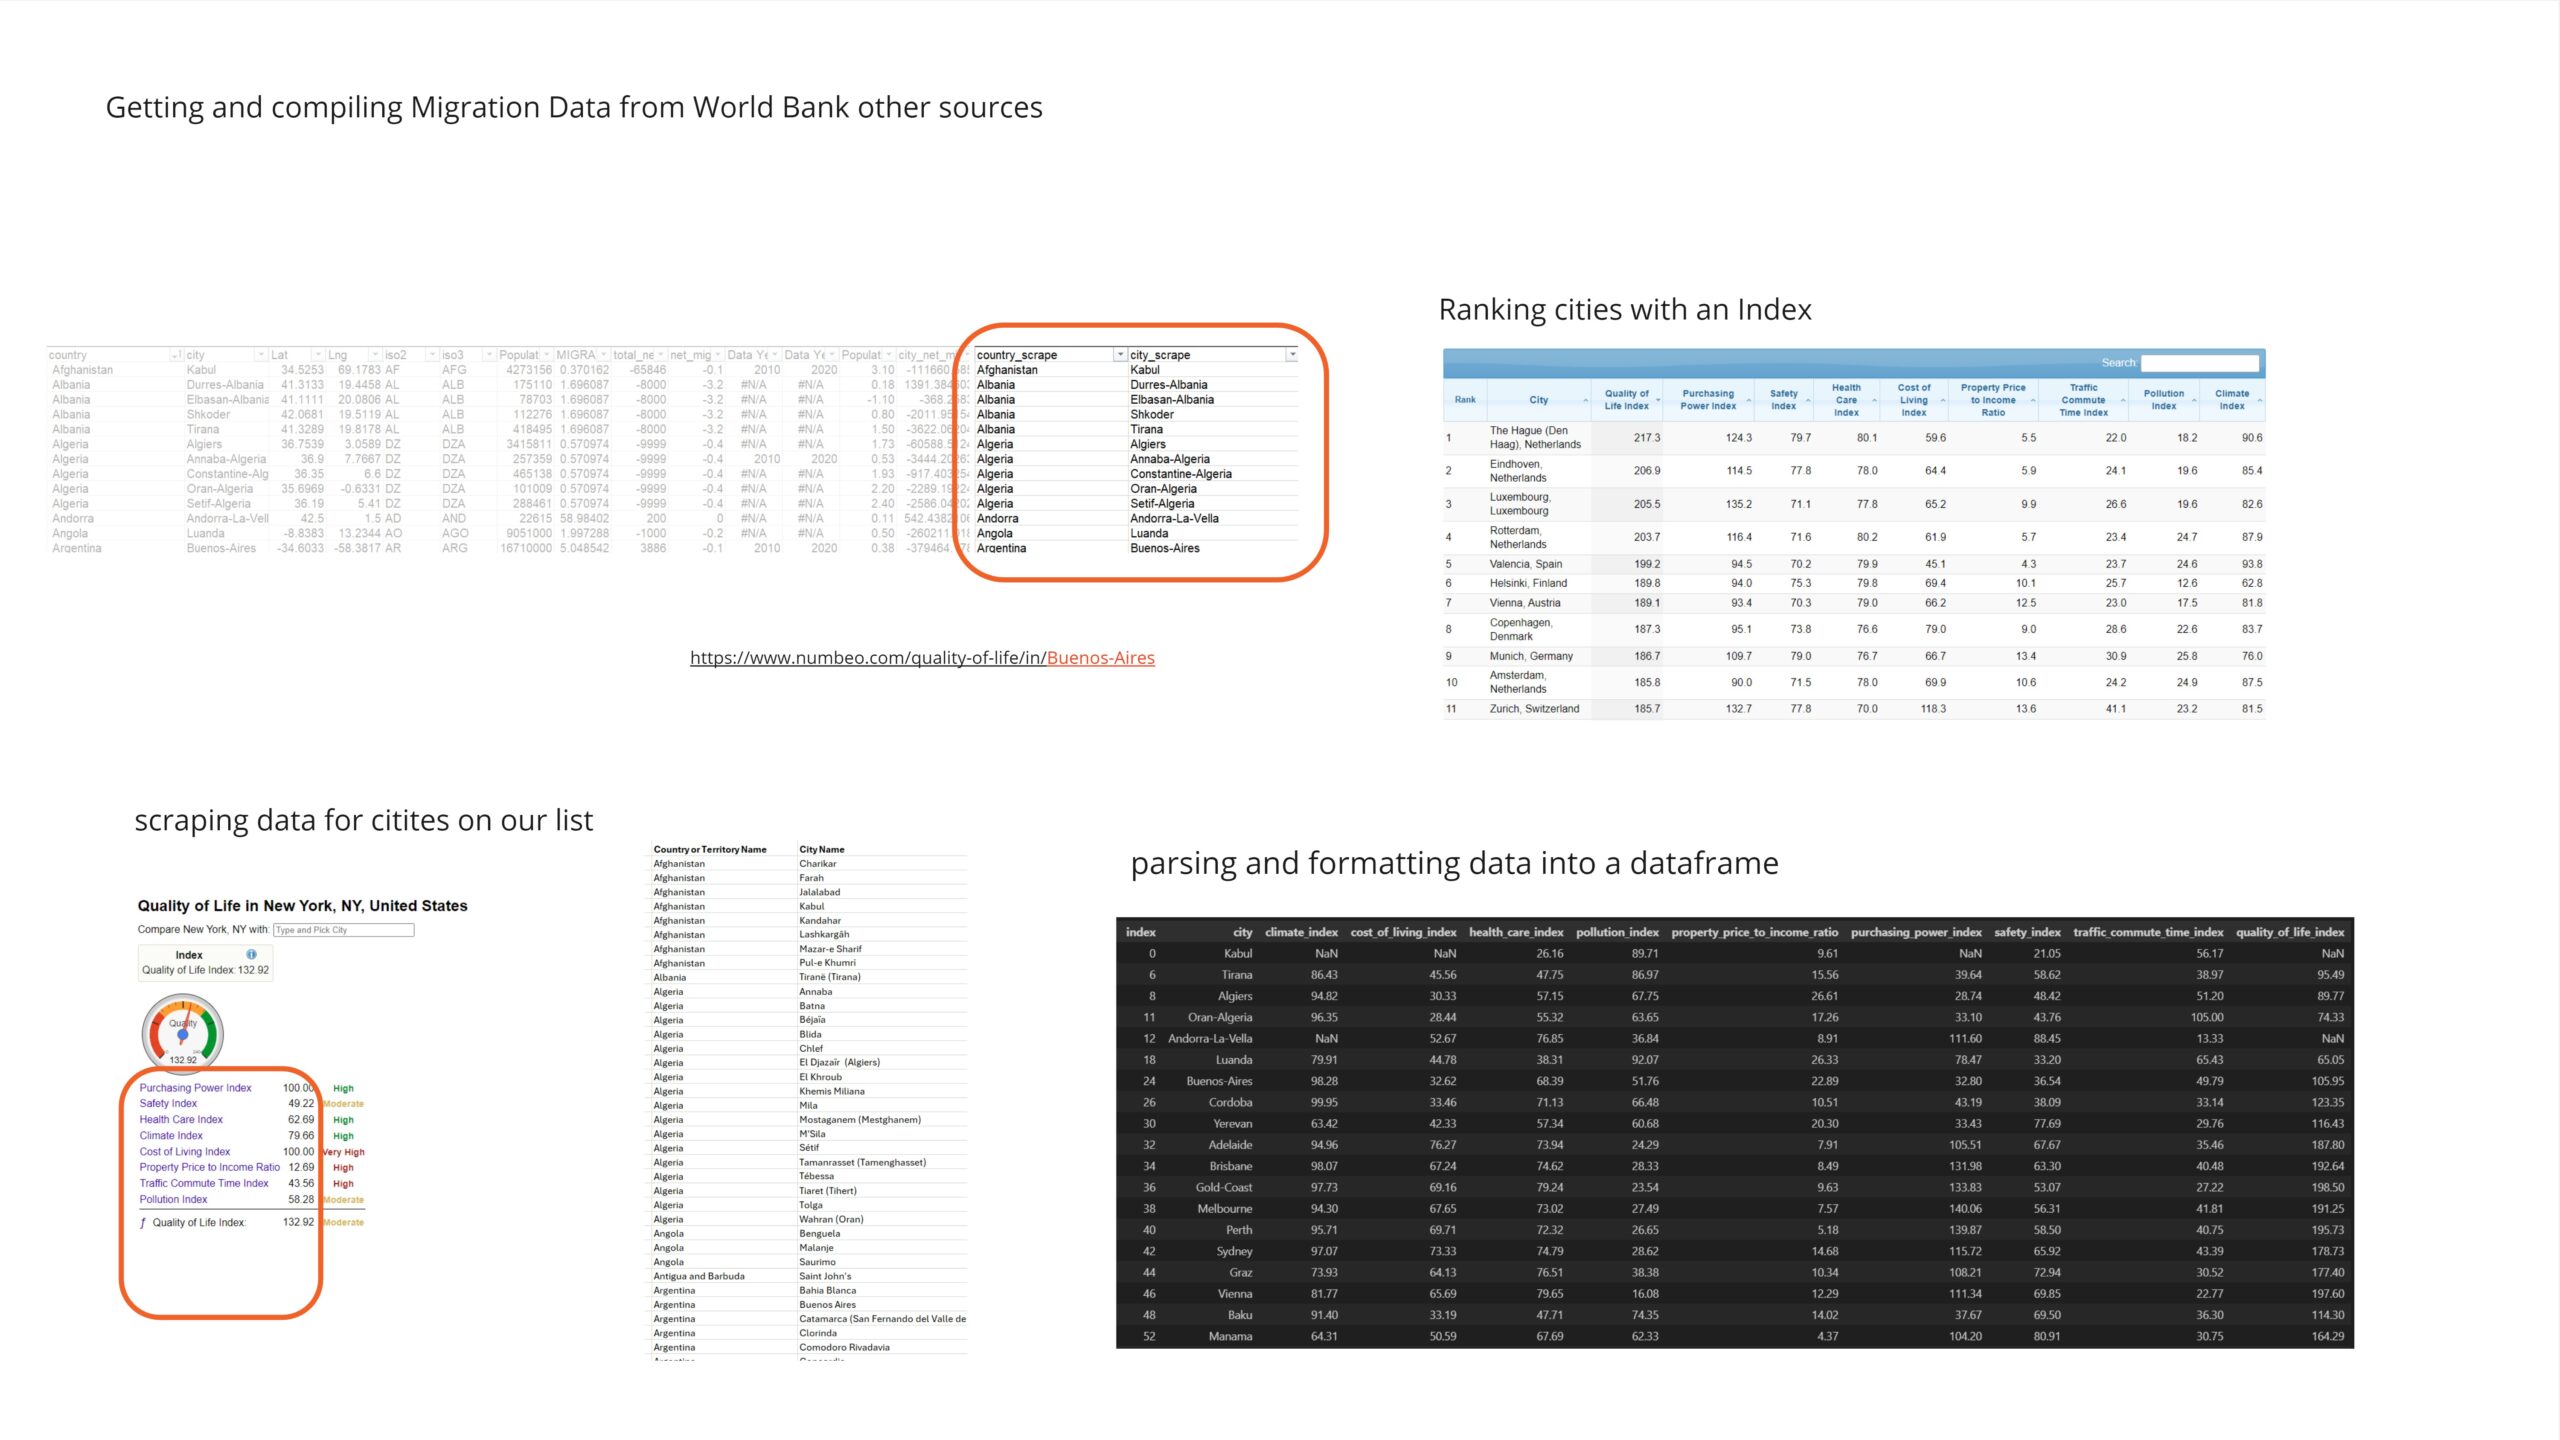
To structure the dataset, migration data from various sources, including the World Bank and other international databases, was gathered and compiled. KPI data was acquired through web scraping, which involved accessing each city on the list and collecting available quality of living indicators. The gathered data was parsed and converted into a usable format, then merged with the net migration and demographics dataset.
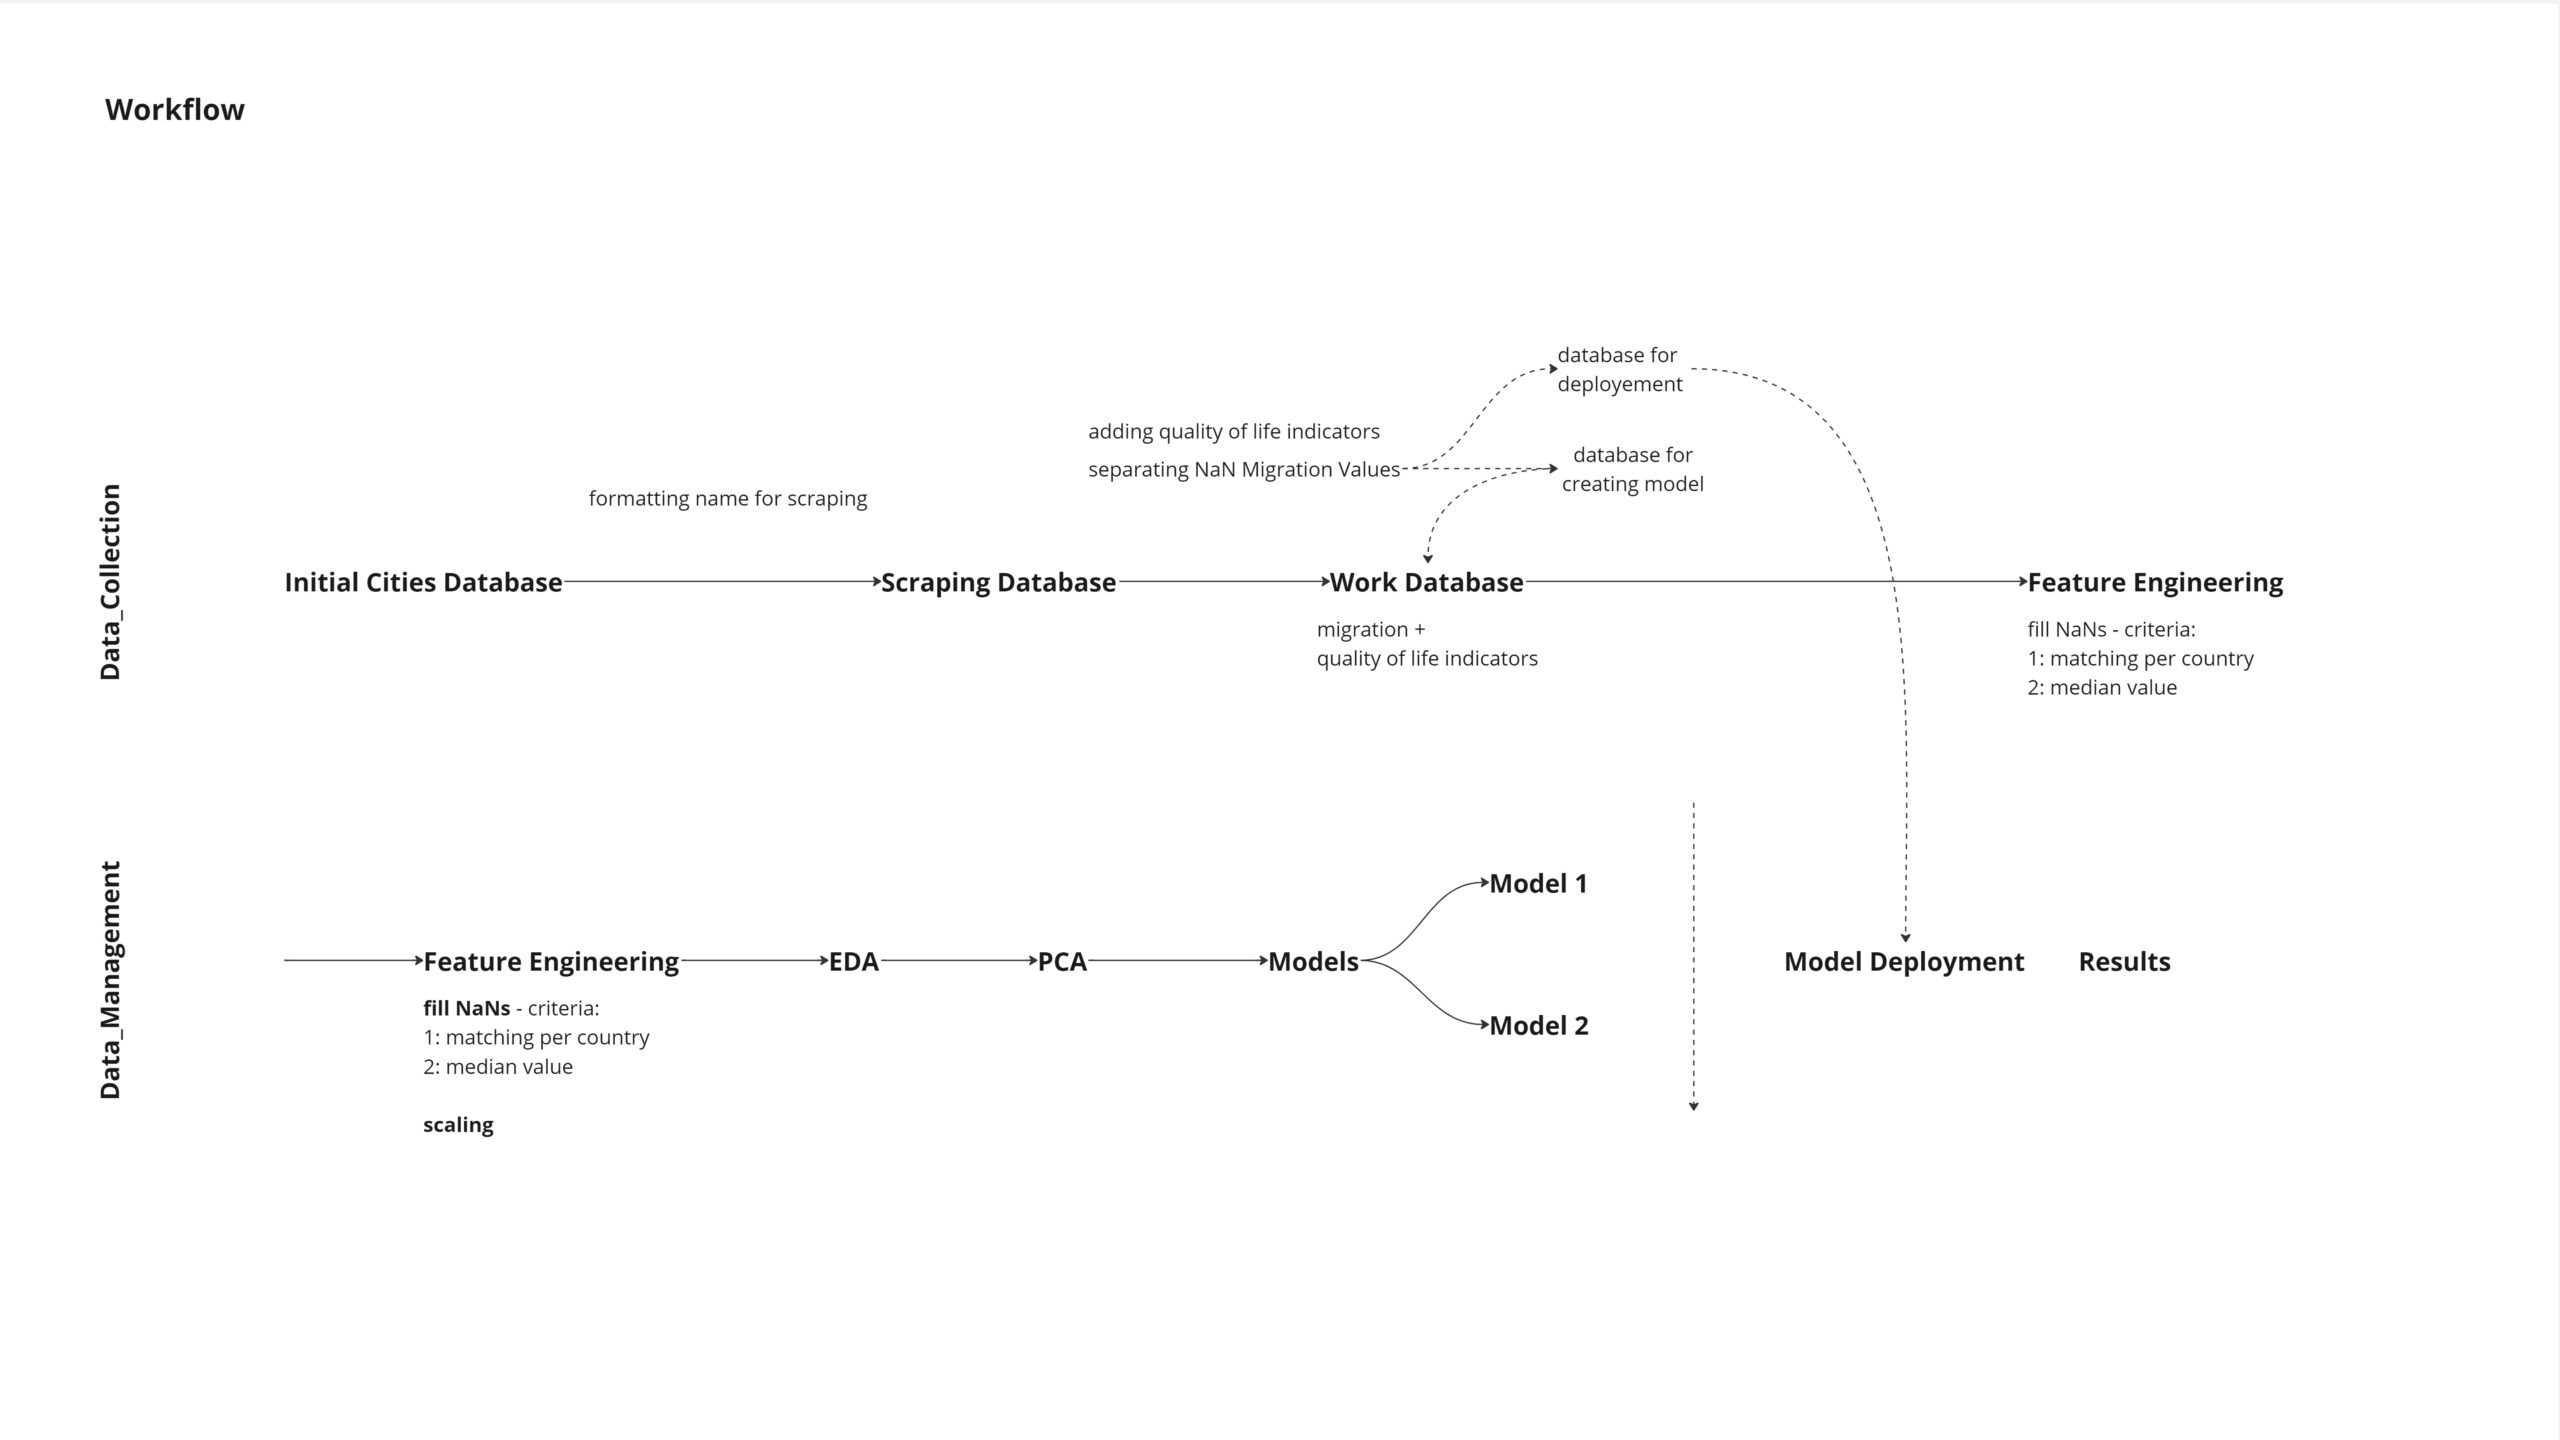
Workflow
Exploratory Data Analysis
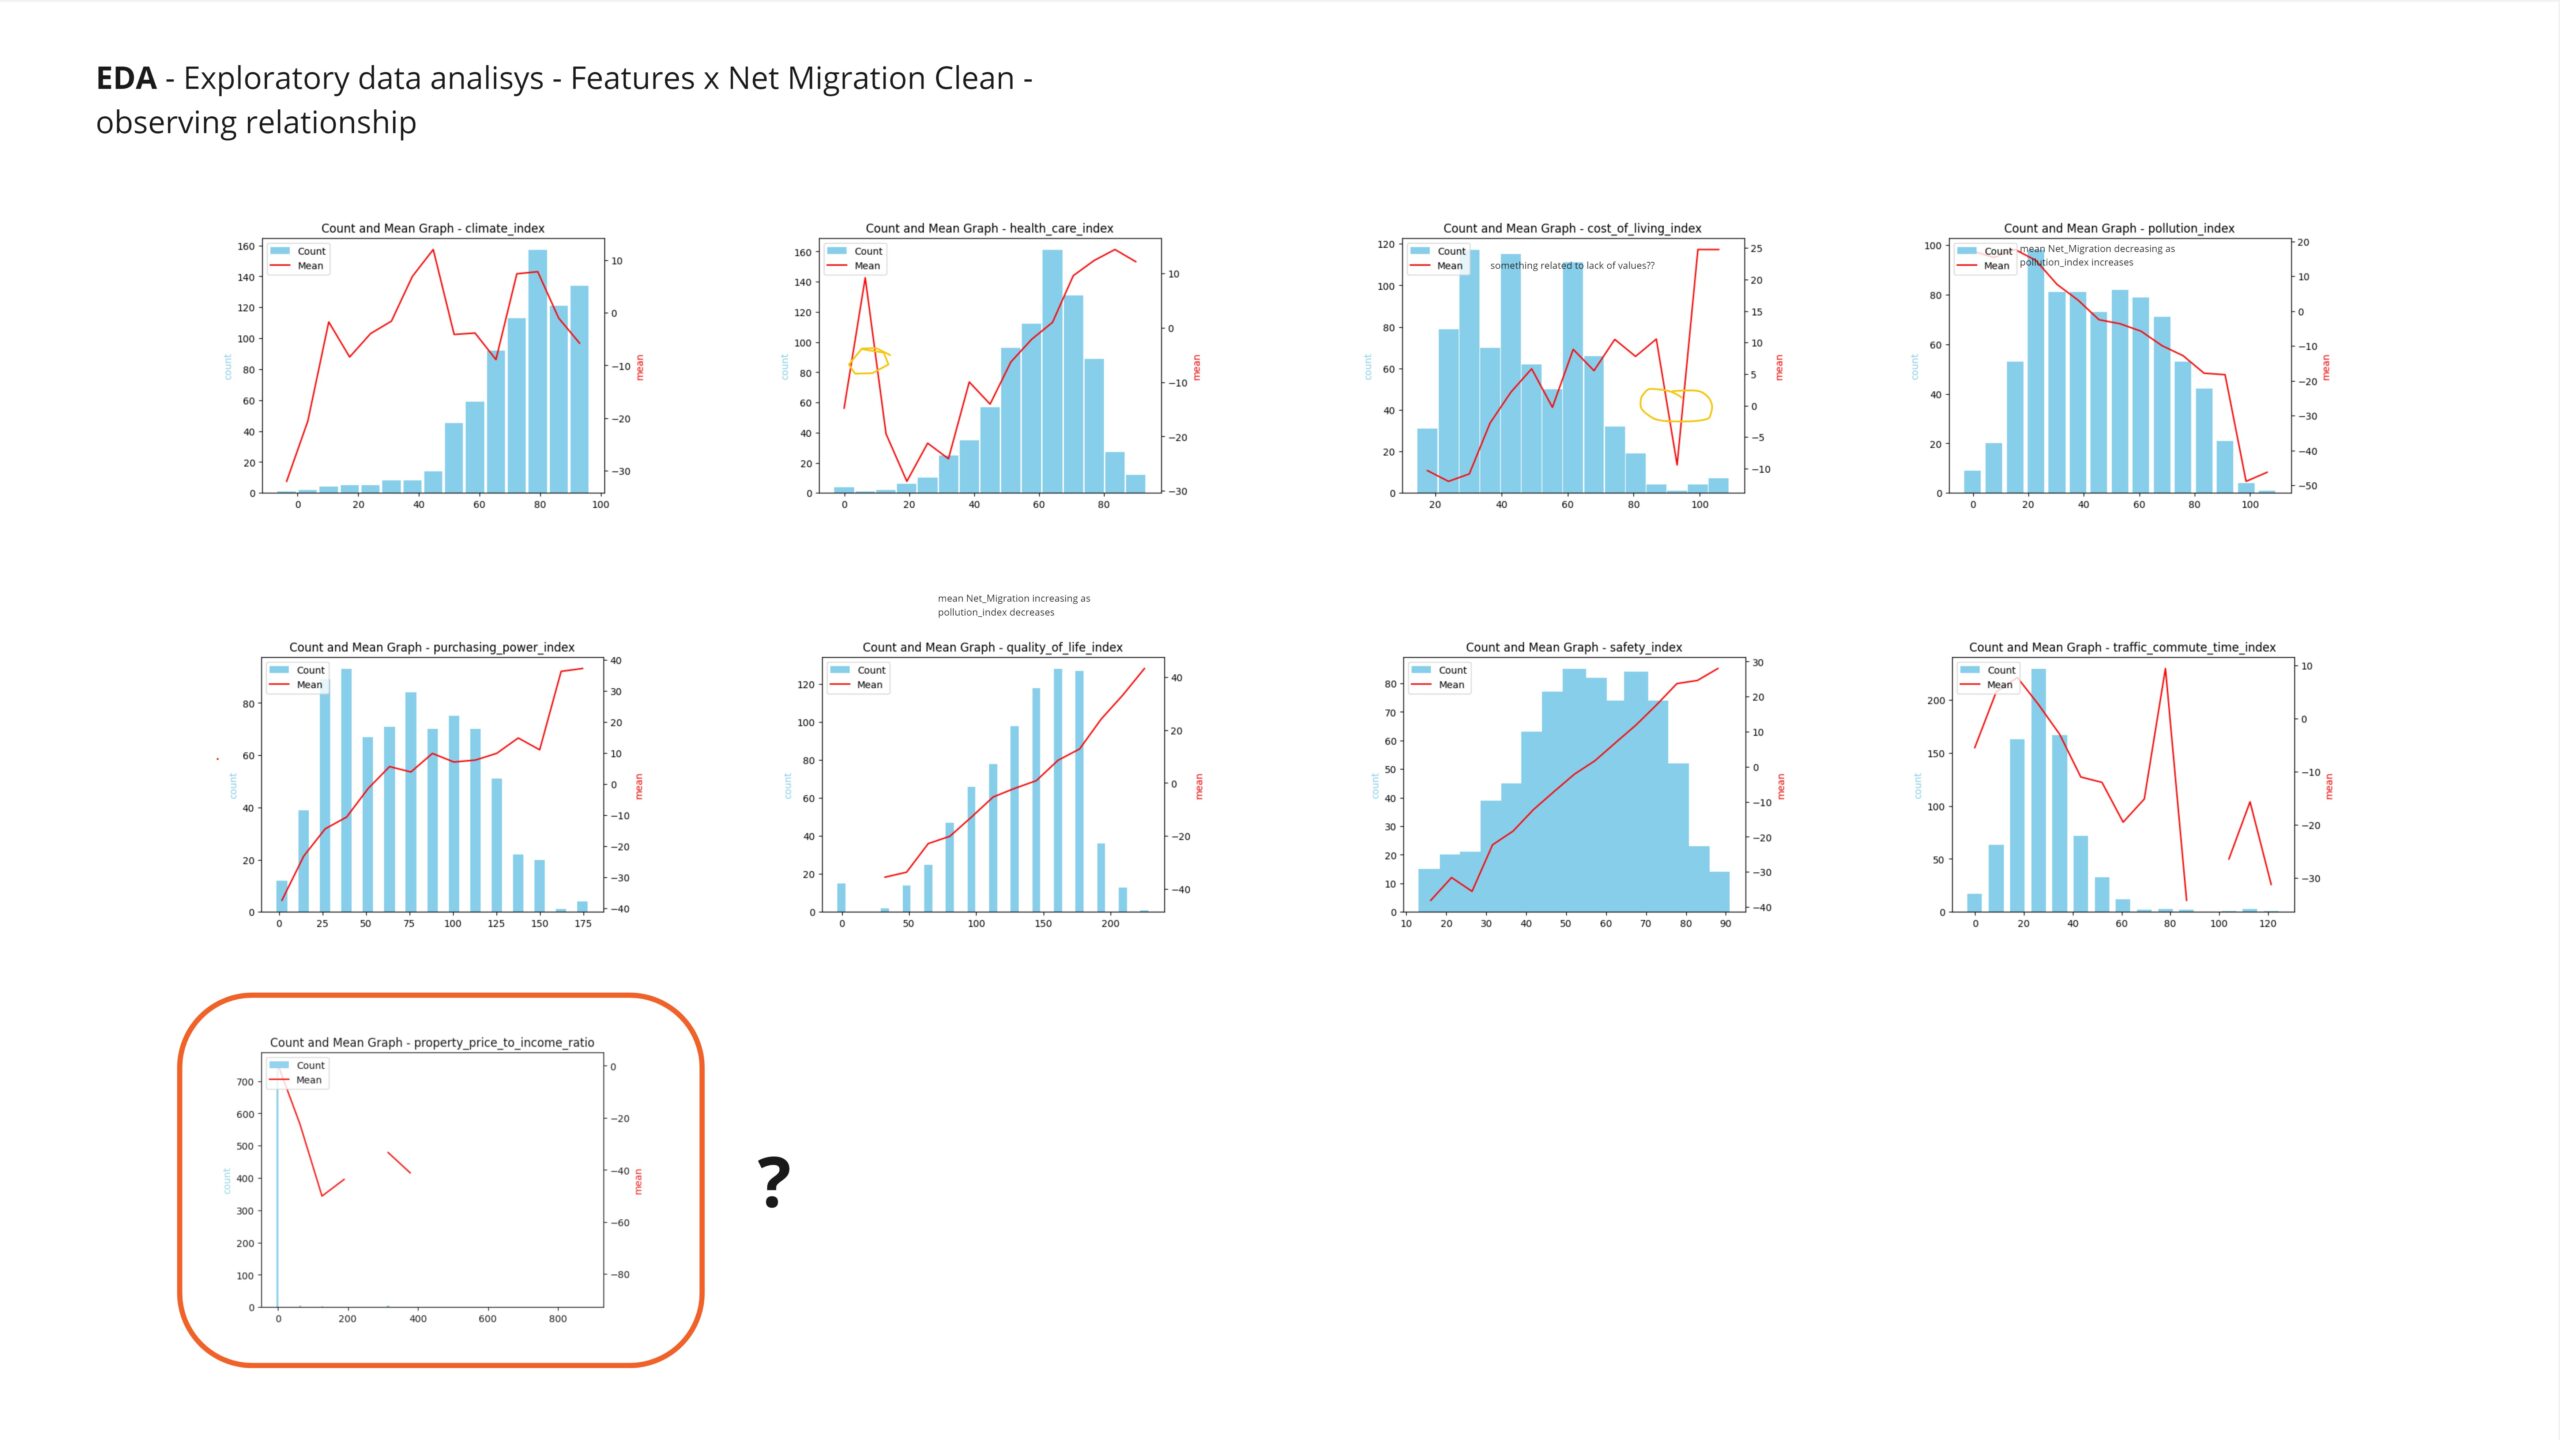
As a first approach to understanding the general distribution of the data, histograms of all numerical features were plotted. From these plots, the relationships between the features and the main variable were examined. Further investigation will be conducted on features that exhibit unusual patterns or outliers.
The property-to-income ratio variable displays a distribution with a significant number of very high values, while the majority of values are concentrated at lower levels. To enhance clarity in the analysis, these extreme values have been removed
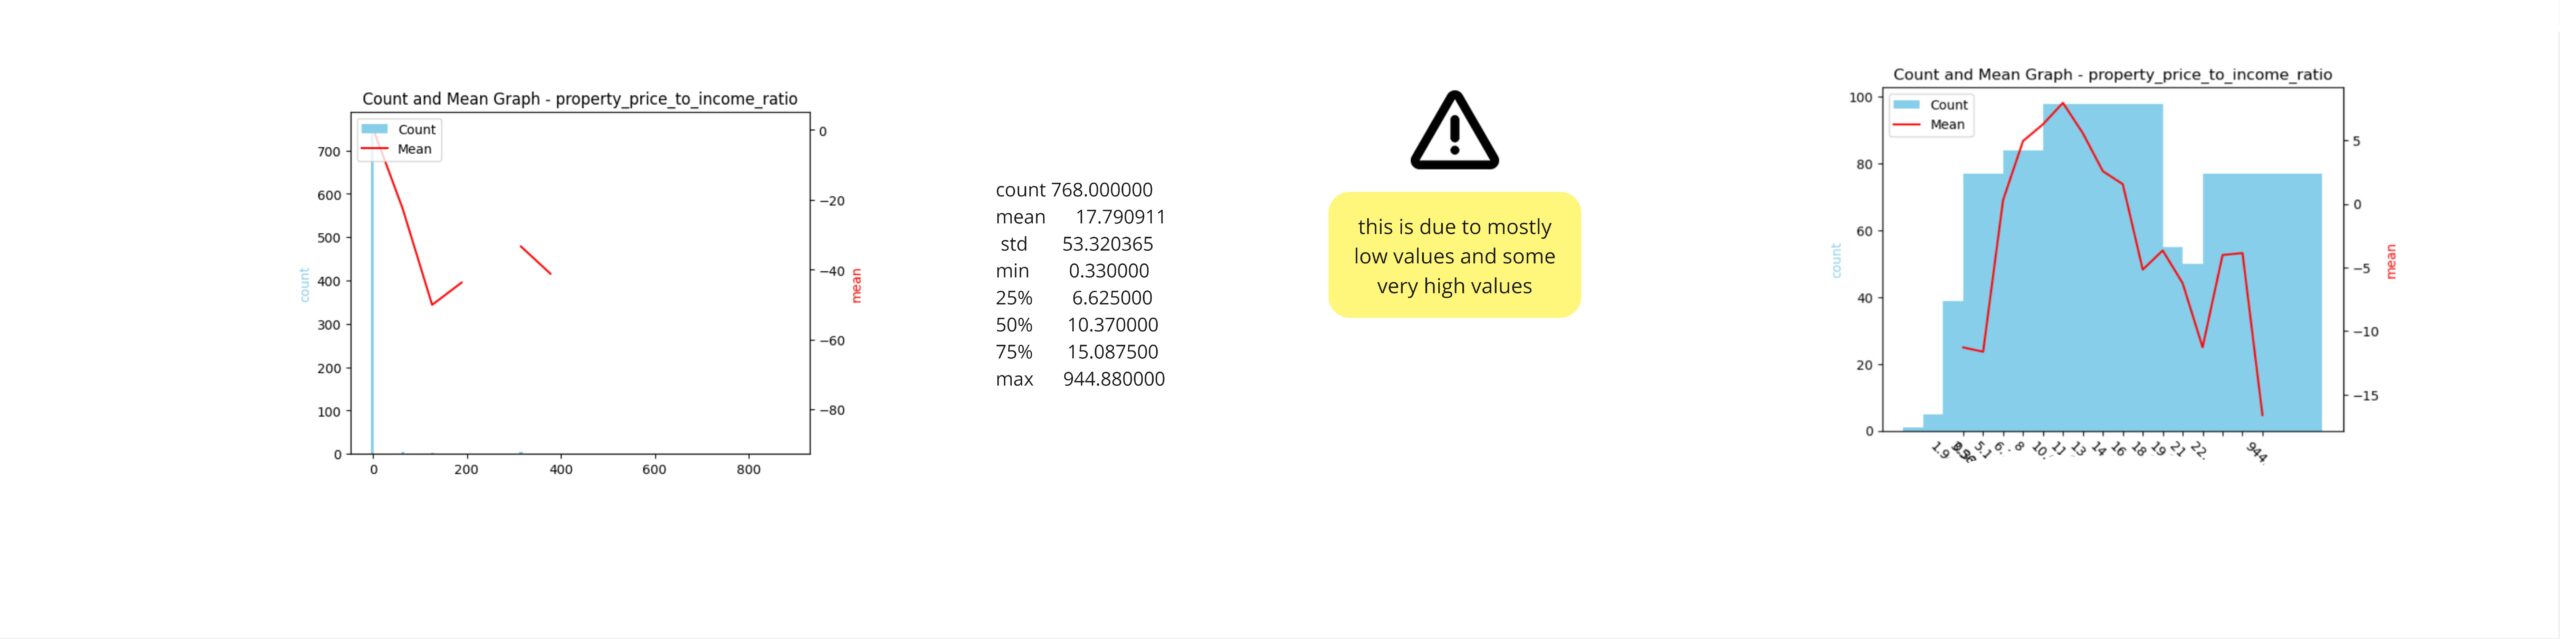
Upon studying the interactive plot, a decision was made to remove all data points exceeding the threshold value indicated in Figure A. This adjustment aimed to eliminate extreme outliers and enhance the clarity and accuracy of the analysis. The subsequent changes between Figure B and Figure C were observed, highlighting the impact of this data refinement. By excluding these high values, a more representative distribution of the property-to-income ratio variable was achieved, facilitating a more robust examination of the underlying trends and relationships within the dataset.
Observing the correlation matrix reveals that the climate index has a very low correlation with the predicted value, leading to its removal from the training features in subsequent analyses. In contrast, the safety index and quality of life index exhibit a significant influence on migration patterns. These indices will be retained for further investigation due to their strong correlation with the target variable.
Principal Components Analysis
Moving on to Principal Component Analysis (PCA), it becomes evident that all features from the dataset are crucial for creating an effective model. PCA demonstrates that the first principal component explains a substantial amount of variance within the dataset. This highlights the necessity of retaining all features to maintain the model’s ability to capture and utilize relevant information effectively for prediction purposes.
After removing the outliers from the property price to income ratio, we observe changes in the dimensionality scatter plot. Before outlier removal, the scatter plot may show scattered points with less discernible patterns between the purchasing power index and cost of living index. However, after outlier removal, the scatter plot typically exhibits a more concentrated cluster or trend line, indicating a clearer positive correlation between purchasing power and cost of living across cities.
In the PCA correlation matrix, we observe how the principal components correlate with the original features. Given that we require all features to construct our model effectively, the PCA results indicate that reducing dimensionality through PCA may not be necessary or beneficial in our case. The strong correlations between principal components and original features suggest that retaining all features will provide essential information for the model’s accuracy and comprehensiveness. Thus, PCA can be set aside in favor of using the full set of features for our modeling purposes.
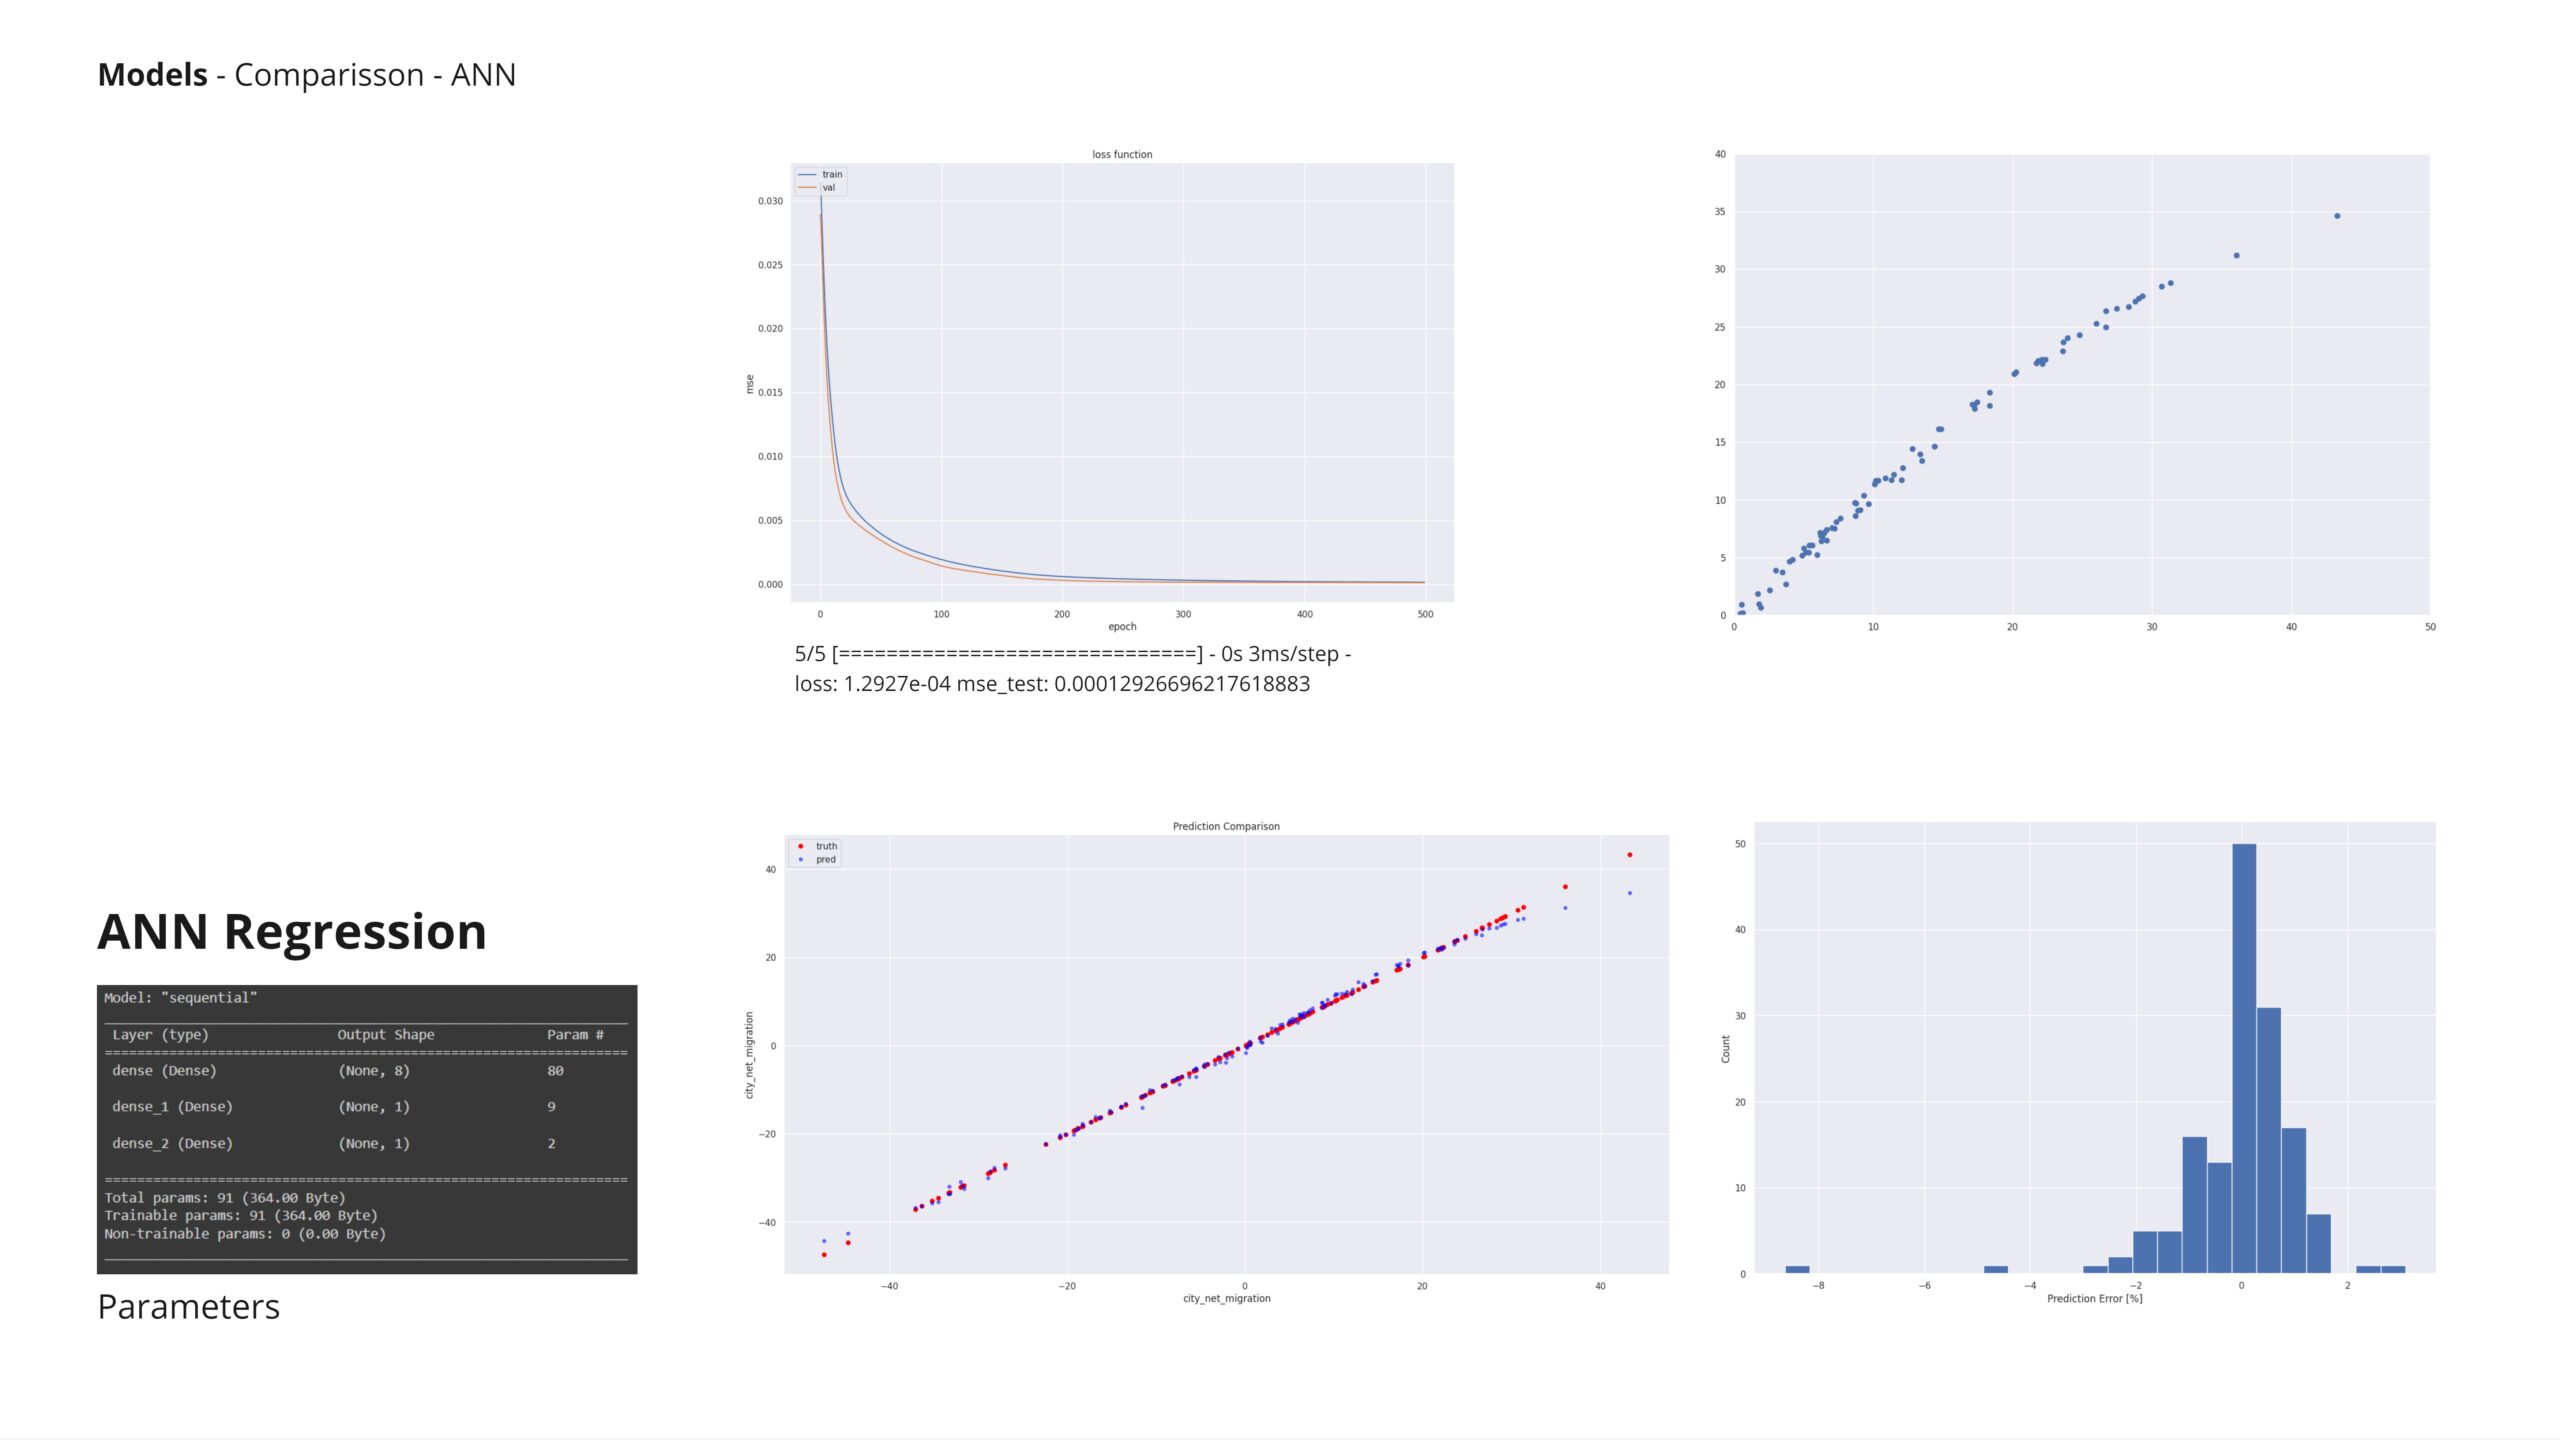
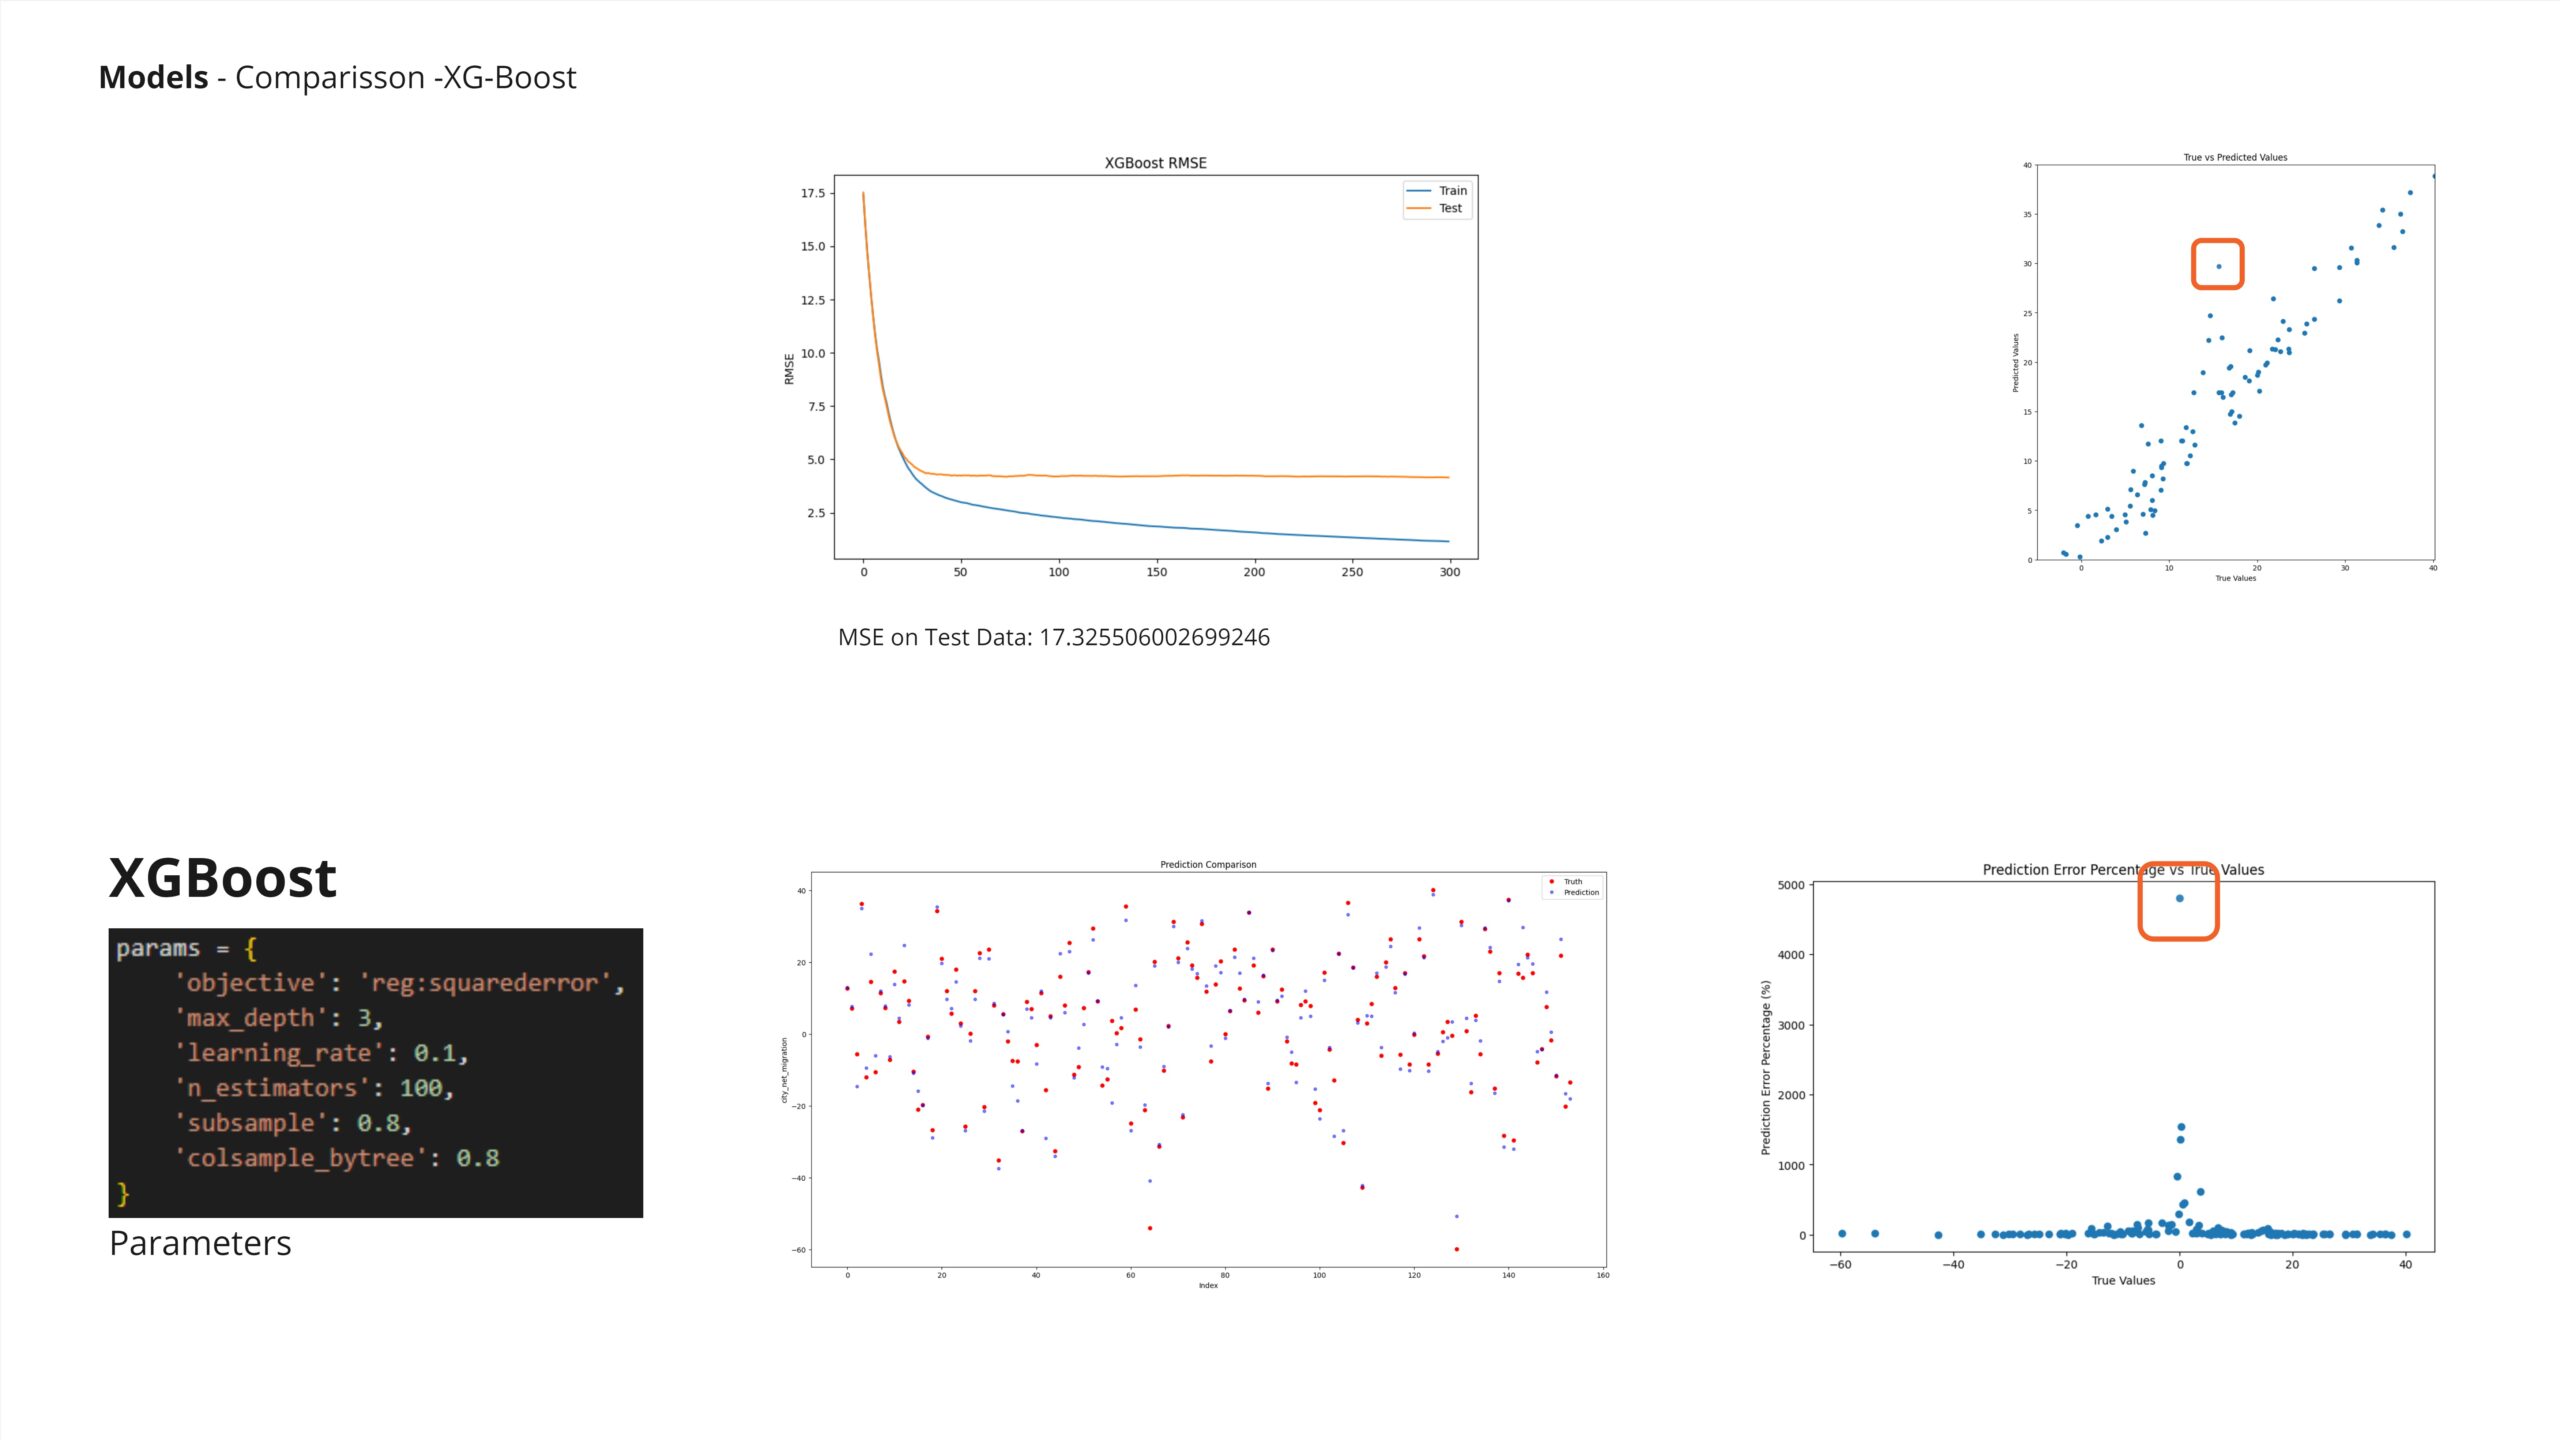
Models
After experimenting with various models on labeled data, XGBoost demonstrated the most superior performance overall.