Historical data
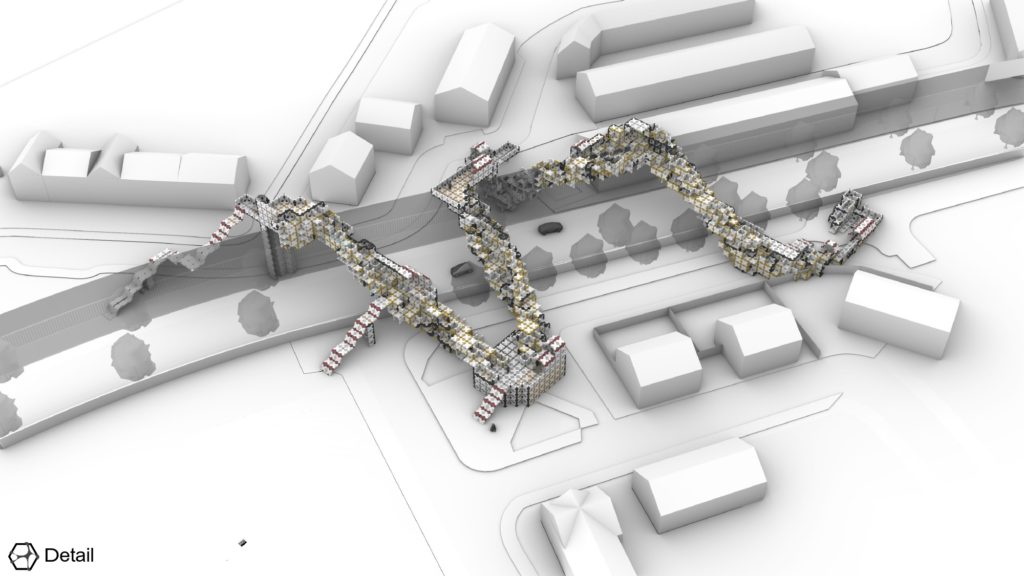
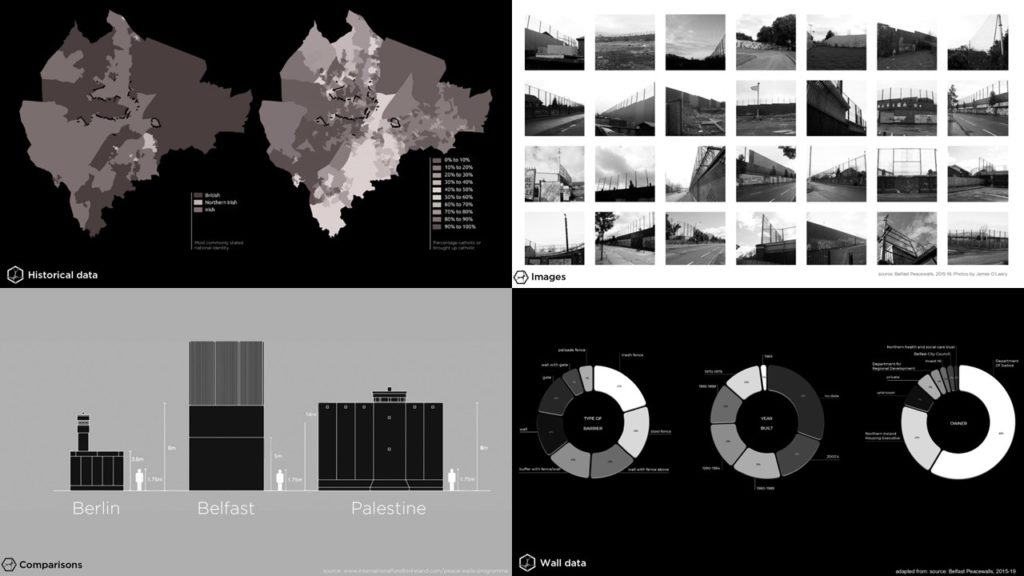
Peaceful parasites is based in Belfast, Northern Ireland and addresses the urban scars created by the recent troubles. Deep rooted segregation has generated detrimental urban divides and this project aims to solve this problem. Historically, the troubles started in 1969 and subsides to some degree in 1998 with the ¨good friday agreement¨. 2023 was the target date for dismantling the walls, but due to political tensions this was not possible and there are still remaining as much as 5km of dividing walls. In a regional level, the possition of the walls are correlated with the socially stated division of religion and stated nationality.
The walls vary in height, length and are scattered around the city. Apart from that, the first analysis show the type of barrier, where we can see that there are seven different of them. The second one shows the year they were built, showing how over 16% of them were built even after the year 2000. Finally, the ownership of them varies between public and private.
Site analysis
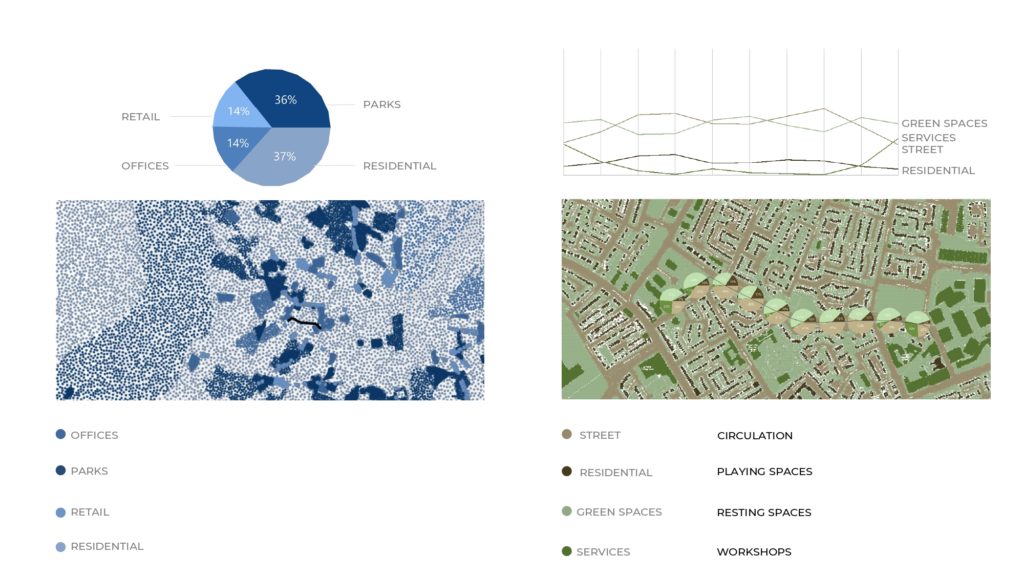
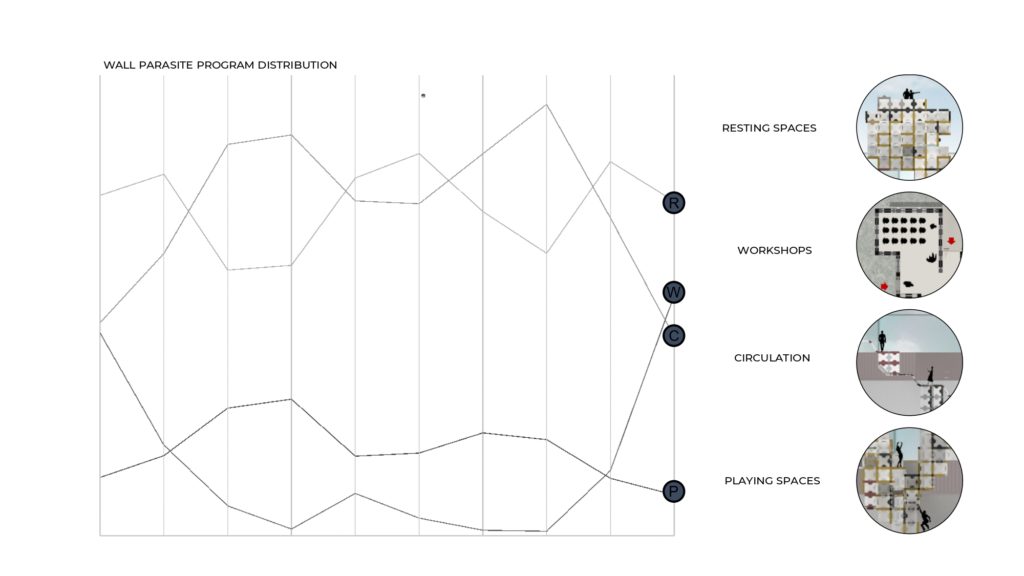
How can data driven design aid in stitching back the urban fabric? For the site analysis we used point clouds to identify in a regional scale and in a local one. The percentage of offices, parks, residential and retail zones are used in the regional scale to define the program distribution in the project. In a closer local scale, the streets, residential, green spaces and services are seen with their relative position to the wall, defining the spaces distribution along the wall.
Concept
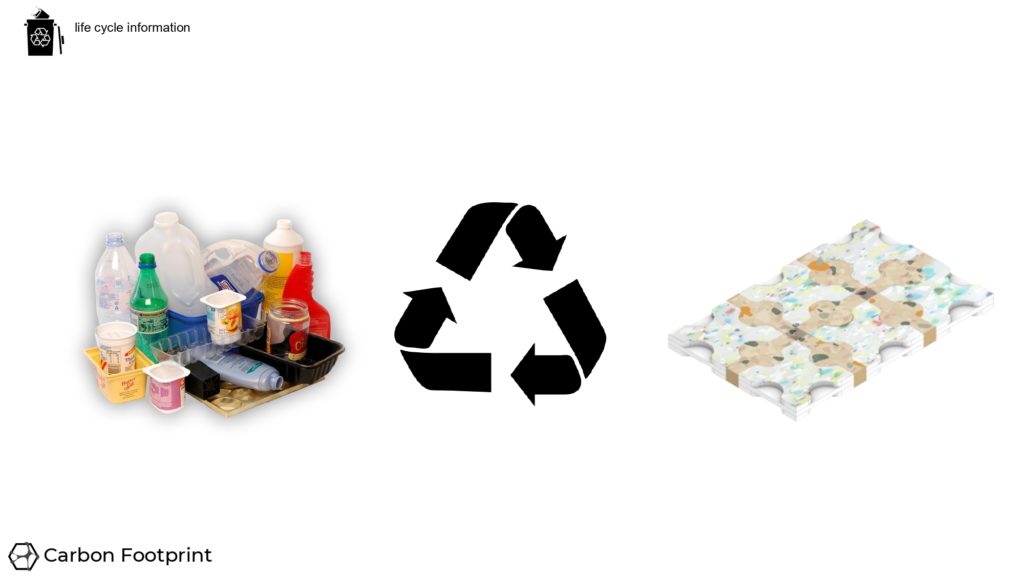
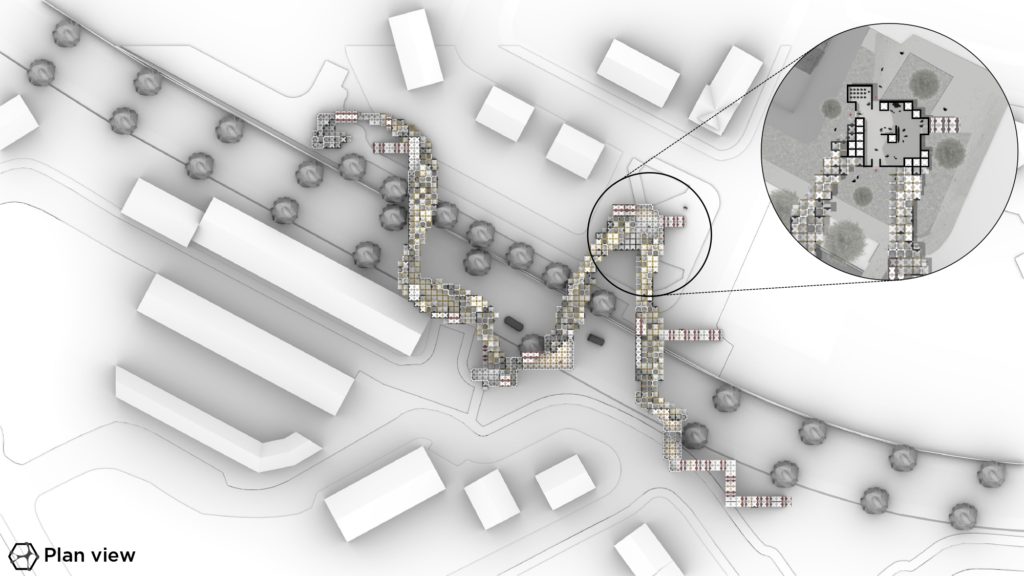
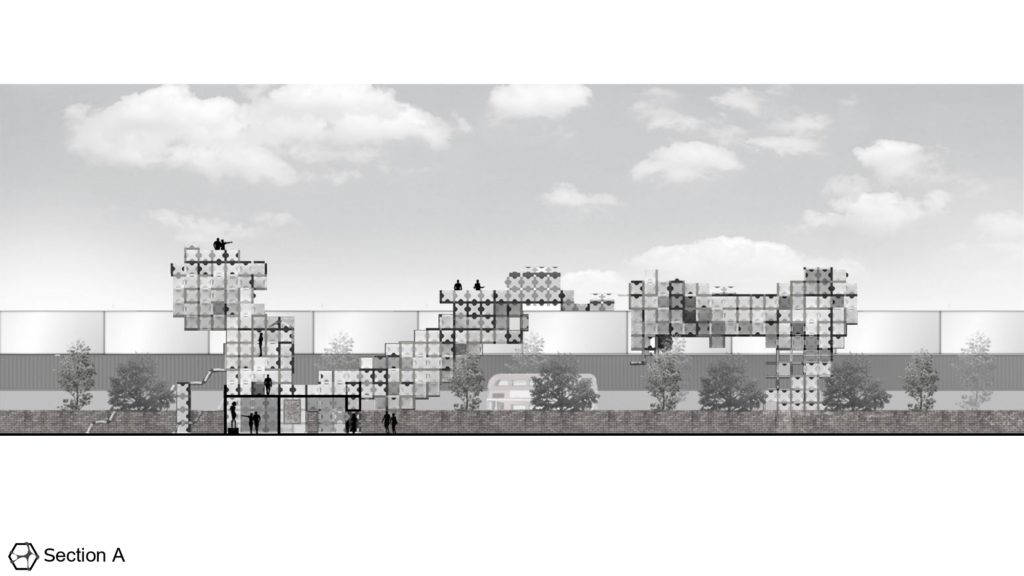
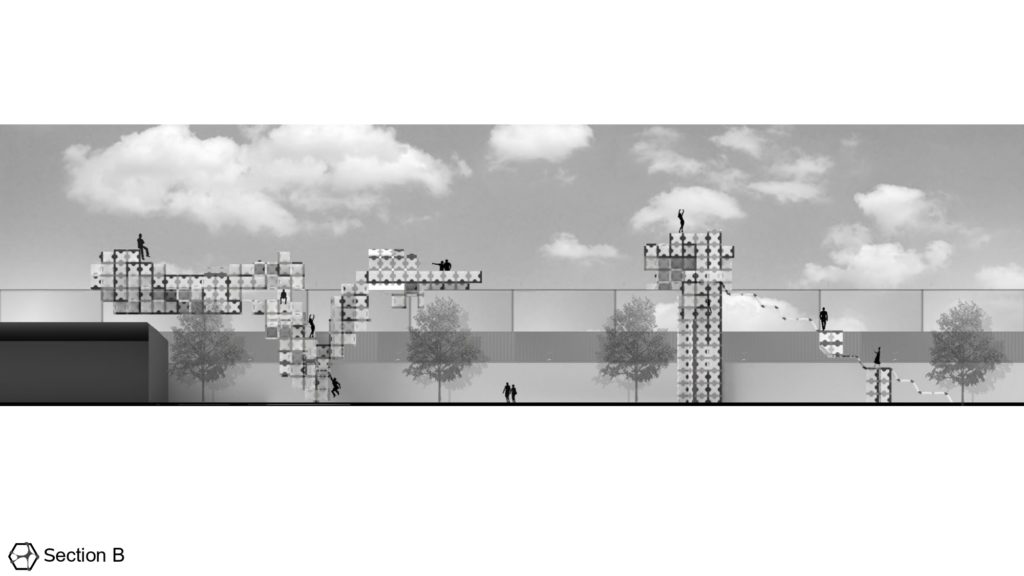
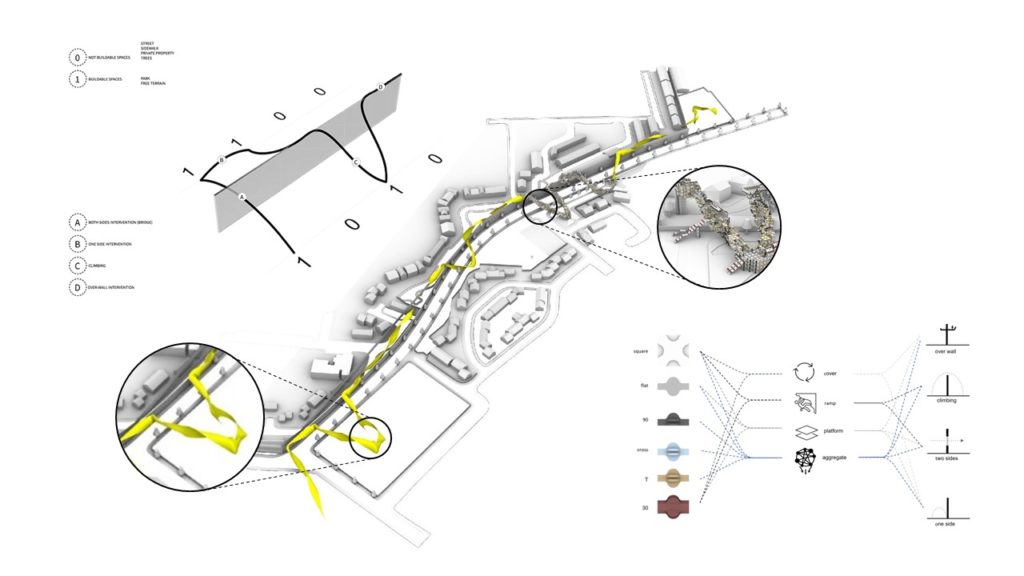
The peaceful parasite is going to evaluate the surroundings of the walls and search for free spaces where it can build its supports, with a system of ceros and ones. 0 means “non buildable” spaces, which are private properties, streets and sidewalks. 1 means “buildable”, which are parks and free terrains. These create four types of interventions: both sides intervention, one side, climbing and over wall intervention. This ribbon is aggregated with parts that work as lego.

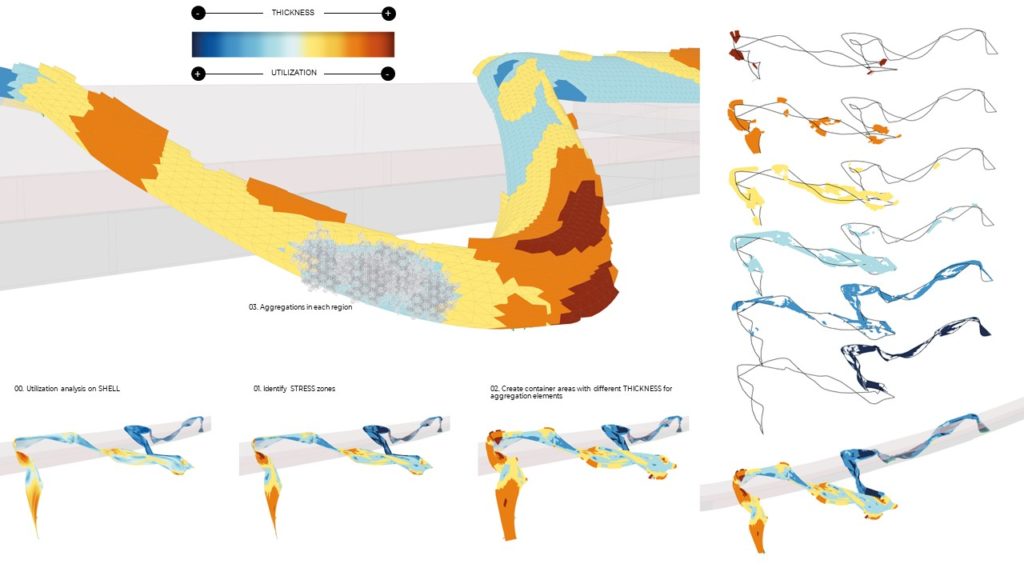
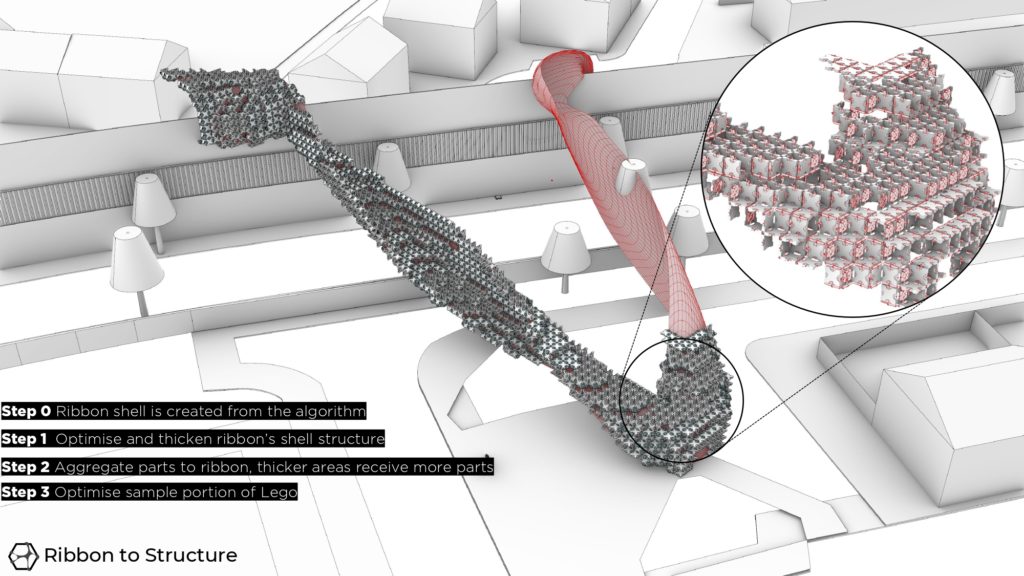
Structural optimization