Urban Context Generator
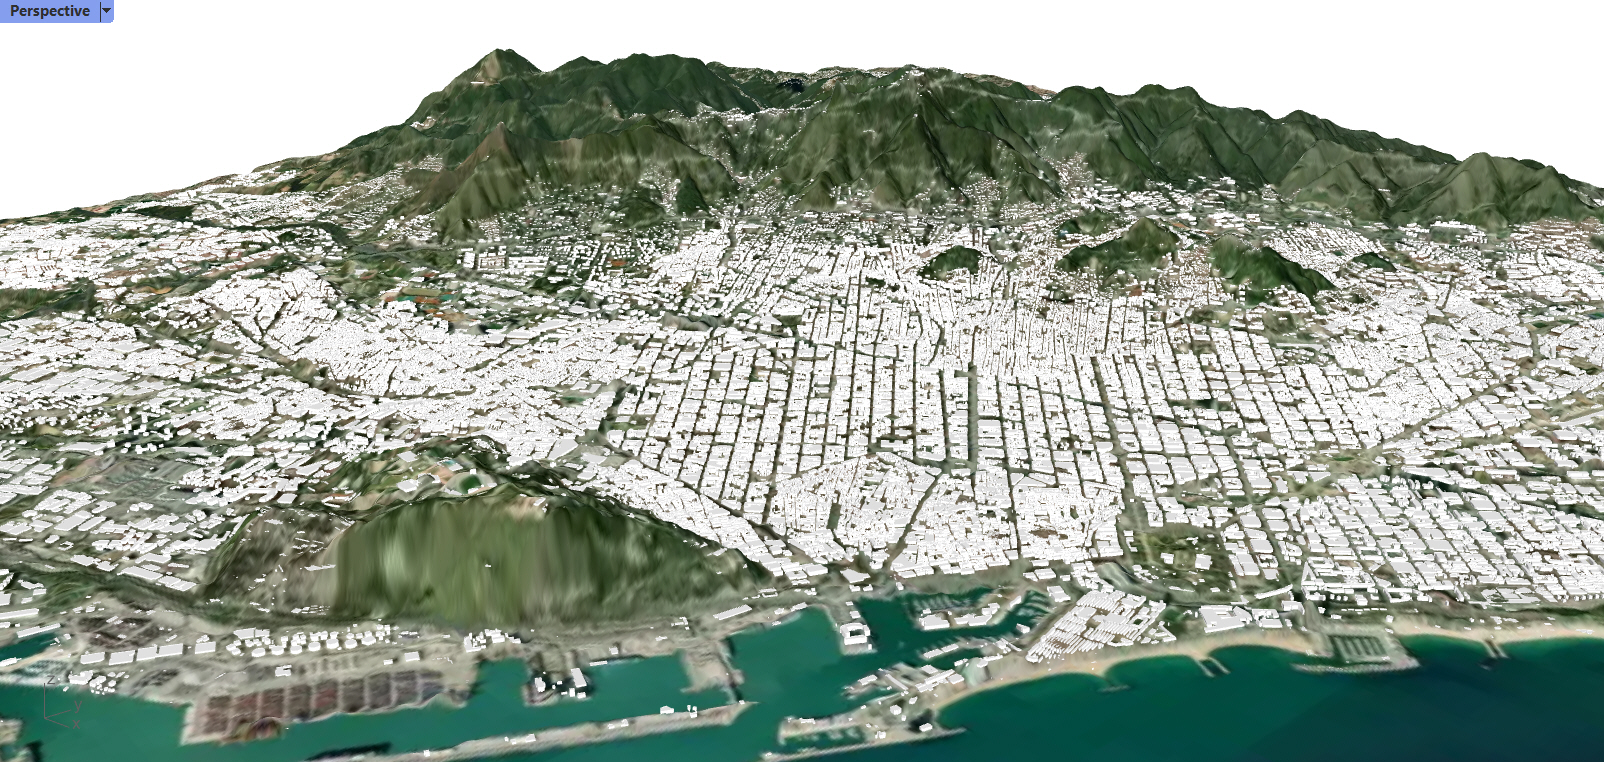
Grasshopper is an incredibly versatile tool that in recent years has expanded into fields far beyond the origins in three-dimensional parametric design. One of these fields is that of GIS analysis, which has traditionally been approached through software such as QGIS. The advantages of Grasshopper and Rhinoceros3D over QGIS include the versatility and customisability of … Read more