
IAAC’s Master in City & Technology (1 or 2-year program) is a unique program oriented towards redefining the analysis, planning, and design of twenty-first-century cities and beyond. The program offers expertise in the design of digitally enhanced, ecological and human-centered urban environments by intersecting the disciplines of urbanism and data science. Taking place in Barcelona, the capital of urbanism, the Master in City & Technology is training the professionals that city administrations, governments, industries, and communities need, to transform the urban environment in the era of big data.

The Secrets of the Blue Zones
Introduction The Netflix documentary “Live to 100: The Secrets of the Blue Zones” explores regions known for their high numbers of centenarians, focusing on lifestyle, diet, and culture over geographical aspects. Highlighting commonalities such as strong community ties, plant-based diets, and active living, it aims to inspire healthier lifestyle choices. Although it emphasizes the principles … Read more
Rethinking the Mekedatu Dam Project
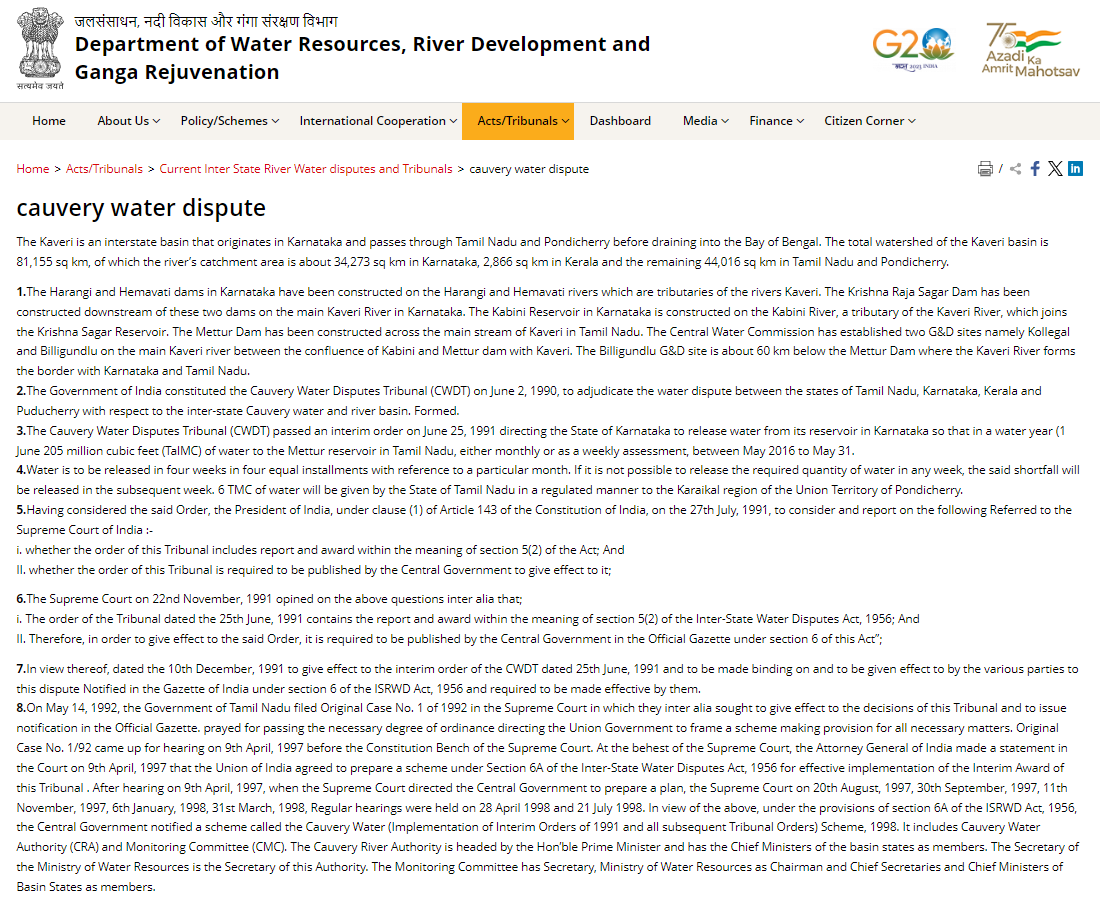
The Cauvery basin is not just a river; it’s an intricate ecosystem that supports diverse flora and fauna and sustains the livelihoods of farmers in both Karnataka and Tamil Nadu. Our hypothesis posits that the proposed Mekedatu dam, far from being a panacea, is an unnecessary venture that could further destabilize this delicate balance. The … Read more
City in Motion: Analyzing People Movement with Agent-Based Modeling

In the realm of urban design, understanding movement behaviors is paramount for creating efficient and people-centric city layouts. In this individual project, I delve into the intricacies of movement behaviors using computational tools and techniques, including agent-based modeling. By incorporating the loop evaluate field amplitude tool and employing vector display, scalar fields, heat maps, and … Read more
Visualizing Geo-Political Power dynamics through Spatial & Statistical Data

The Question: How far does the recent decline of US FDI (Foreign Direct Investment) into China, play a role in China getting more insecure and expanding its global reach of power. The World and all countries alike have been increasingly more susceptible to events and developments in the geo-political theatre. It is not surprising that … Read more
Greece’s Wildfires: Nature’s Fury or Human Ignition?

Introduction Greece’s scorching summers and dry climate create a perfect storm for wildfires. These fires cause widespread devastation, burning homes and harming ecosystems, with tragic consequences like loss of life. While the climate undoubtedly sets the stage, many in Greece believe human activity is the real culprit. Accidental fires from carelessness or deliberate acts of … Read more
Music_Mental Health

Undertaken by: Avi Sharma Hypothesis : Exposure to Music correlates with variations in Mental Health among people. We all know that listening to music can evoke various emotions, depending on the song. What I am exploring is the idea that exposure to music, in general, can play a role in shaping your overall mental health … Read more
‘Too Hot to Handle’
Miami cannot pay for its affordable housing without additional funding. Since 2020, the market has been scorching hot – with average rent rising at quadruple the pace of median income (Zillow, U.S. Census). New opportunities at the federal, state, and local levels will open budget to spend. But, conflicting federal and state geographies of interest … Read more
Gates in the Street
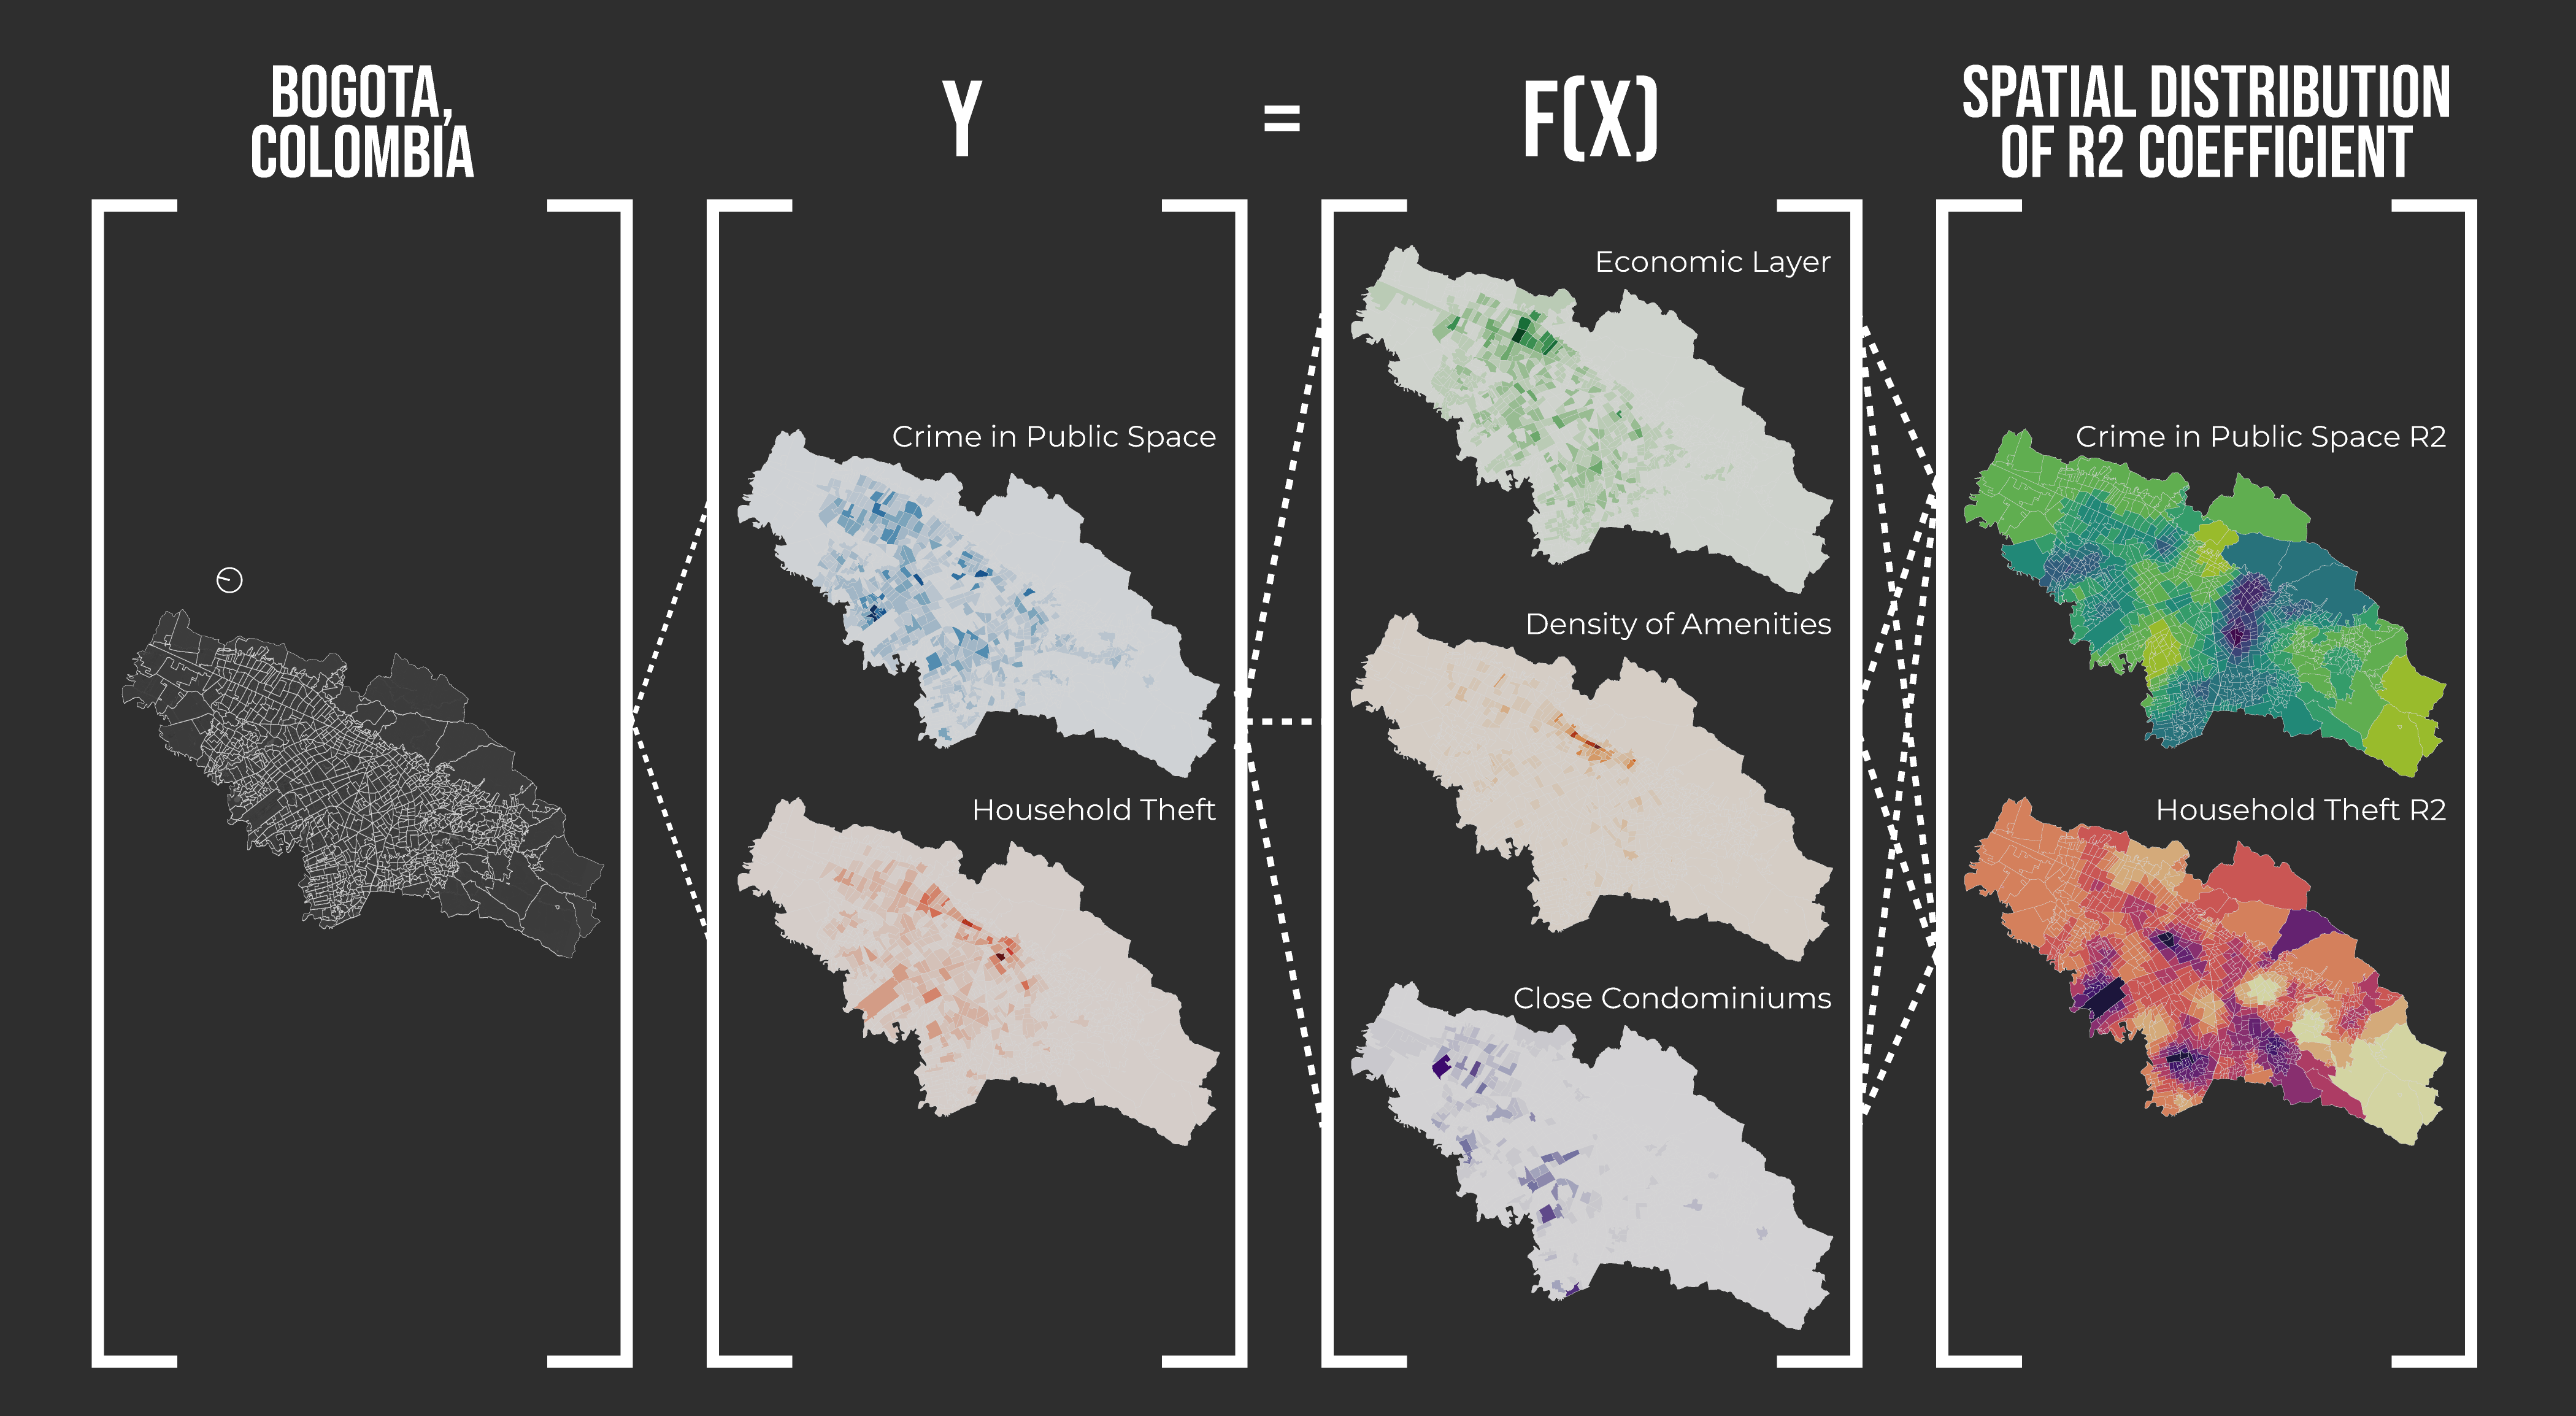
Looking for a correlation between the presence of closed condominiums in Bogota and Crime Rate “In Bogotá, one third of households live in gated communities. This phenomenon is a misleading application of the model idealized by the post-war urbanized American suburbs where an ideal, safe, happy, perfect life was idealized. A life where mobility prioritizes … Read more
Pykémon: Gotta catch ’em all!

Introduction Pokémon GO, the groundbreaking augmented reality mobile game developed by Niantic, has revolutionized the gaming industry since its launch in 2016. With millions of players worldwide, the game transcends traditional gaming boundaries by integrating virtual creatures known as Pokémon into real-world environments. As players explore their surroundings, they encounter Pokémon spawns in various locations, … Read more
Tessellation Urbanism
In the realm of urban theory, navigating through dense academic papers and theoretical frameworks can often feel like traversing uncharted territory. The intricacies of language and abstract concepts can obscure the underlying essence, leaving many grappling for clarity. However, in the age of artificial intelligence, I have embarked on a groundbreaking journey to decode the … Read more
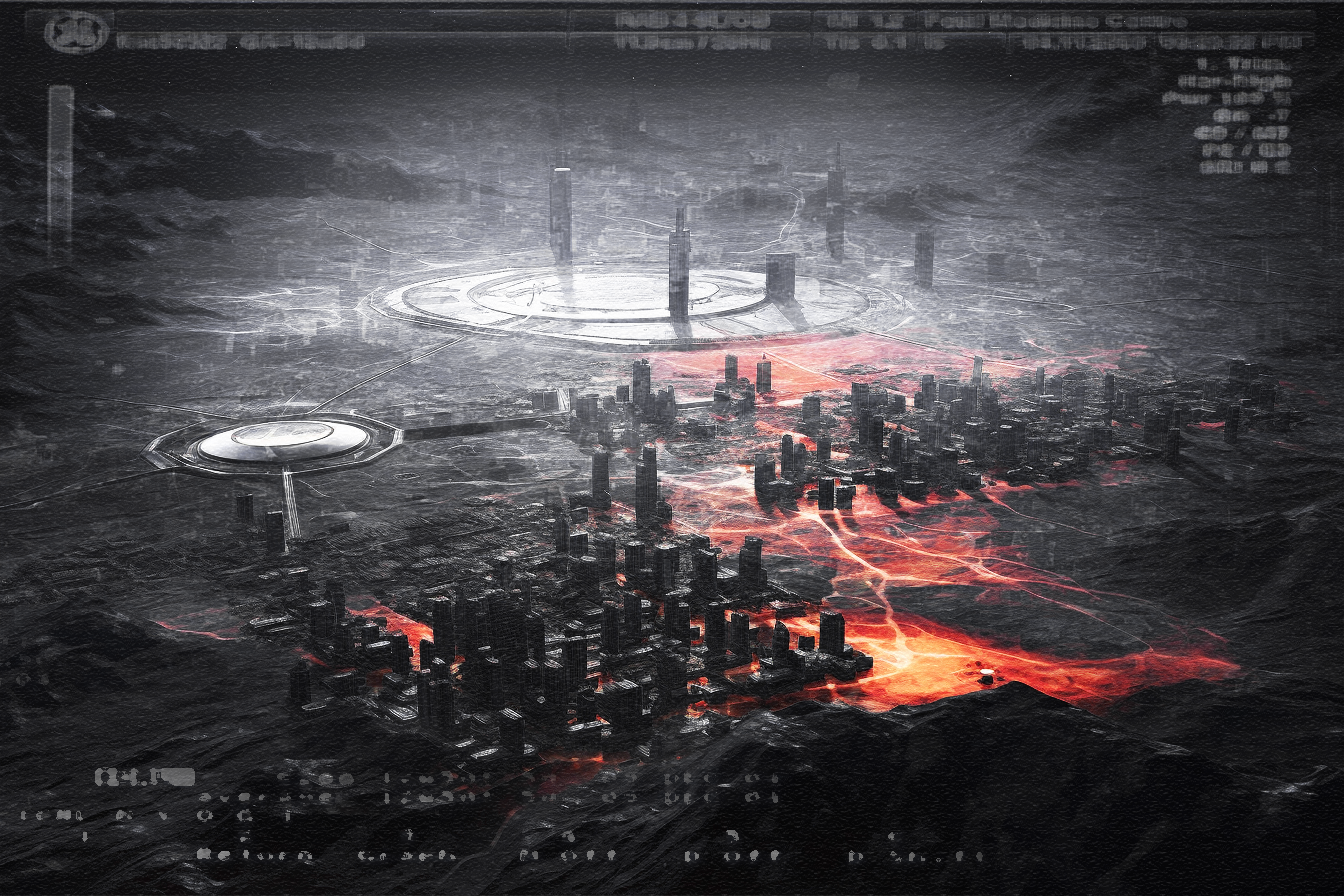
Redefining the Urban

Based on the theoretical frameworks of diverse urban theorists, this project explored multiple dynamics between the metropolis, design, and technology within the context of the Anthropocene epoch and the rise of technology. The following lexicon was developed and graphically illustrated with the assistance of Artificial Intelligence, creating images that aim to cause a cognitive effect … Read more
Solving the maze
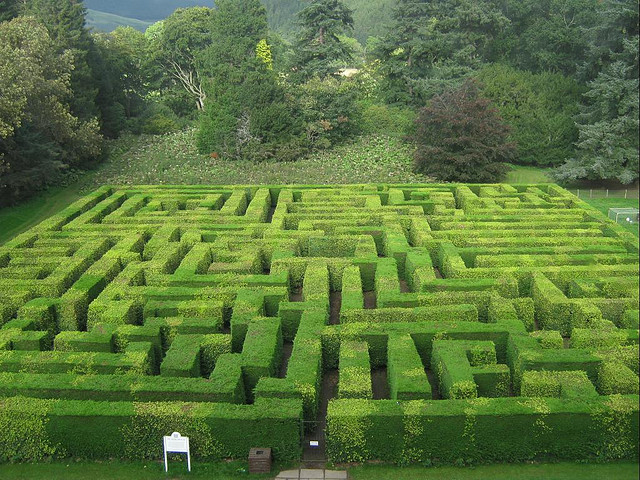
Mazes have fascinated humans for centuries. Solving them requires decision making based on limited knowledge, and the ability to remember and avoid previous mistakes. The problem of solving a maze from any given position within it, without knowing the location of the exit lends itself well to the iterative logic that is central to this … Read more
How do tourists and locals experience Barcelona differently?

Barcelona is a city that in the last decades has become one of the focal points of global mass tourism. Tourists have become part of daily life in the city. The aim of this study was to investigate how tourists and locals experience the city differently, focusing specifically on the topic of noise. The study … Read more
Unequal Blooms: Studying socioeconomic realities of Medellín’s “Eternal Spring”
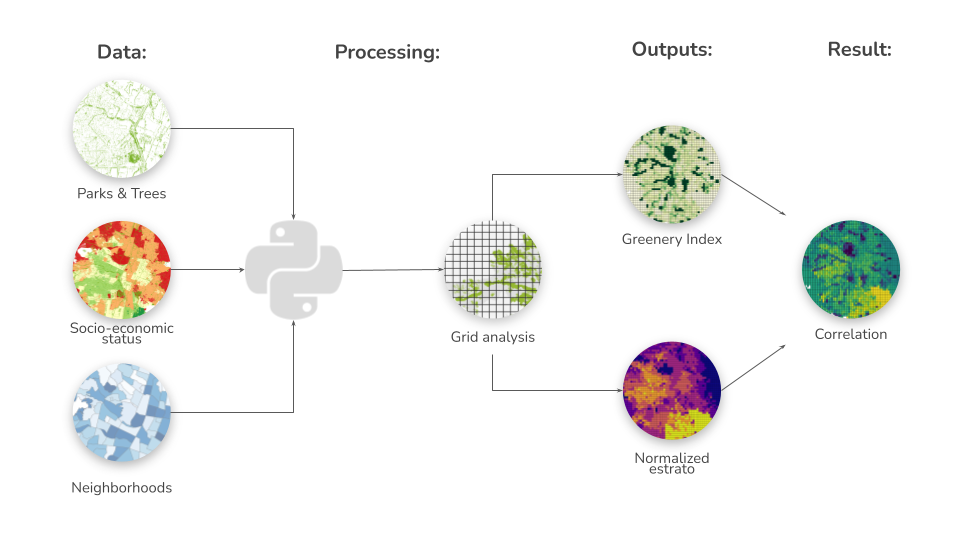
Introduction In recent decades, the importance of urban green spaces and their potential impact on various aspects of urban life has gained significant attention from policymakers, urban planners, and researchers worldwide. The creation and maintenance of green spaces within urban environments have been associated with numerous benefits, including environmental sustainability, physical and mental health improvements, … Read more
