Brief
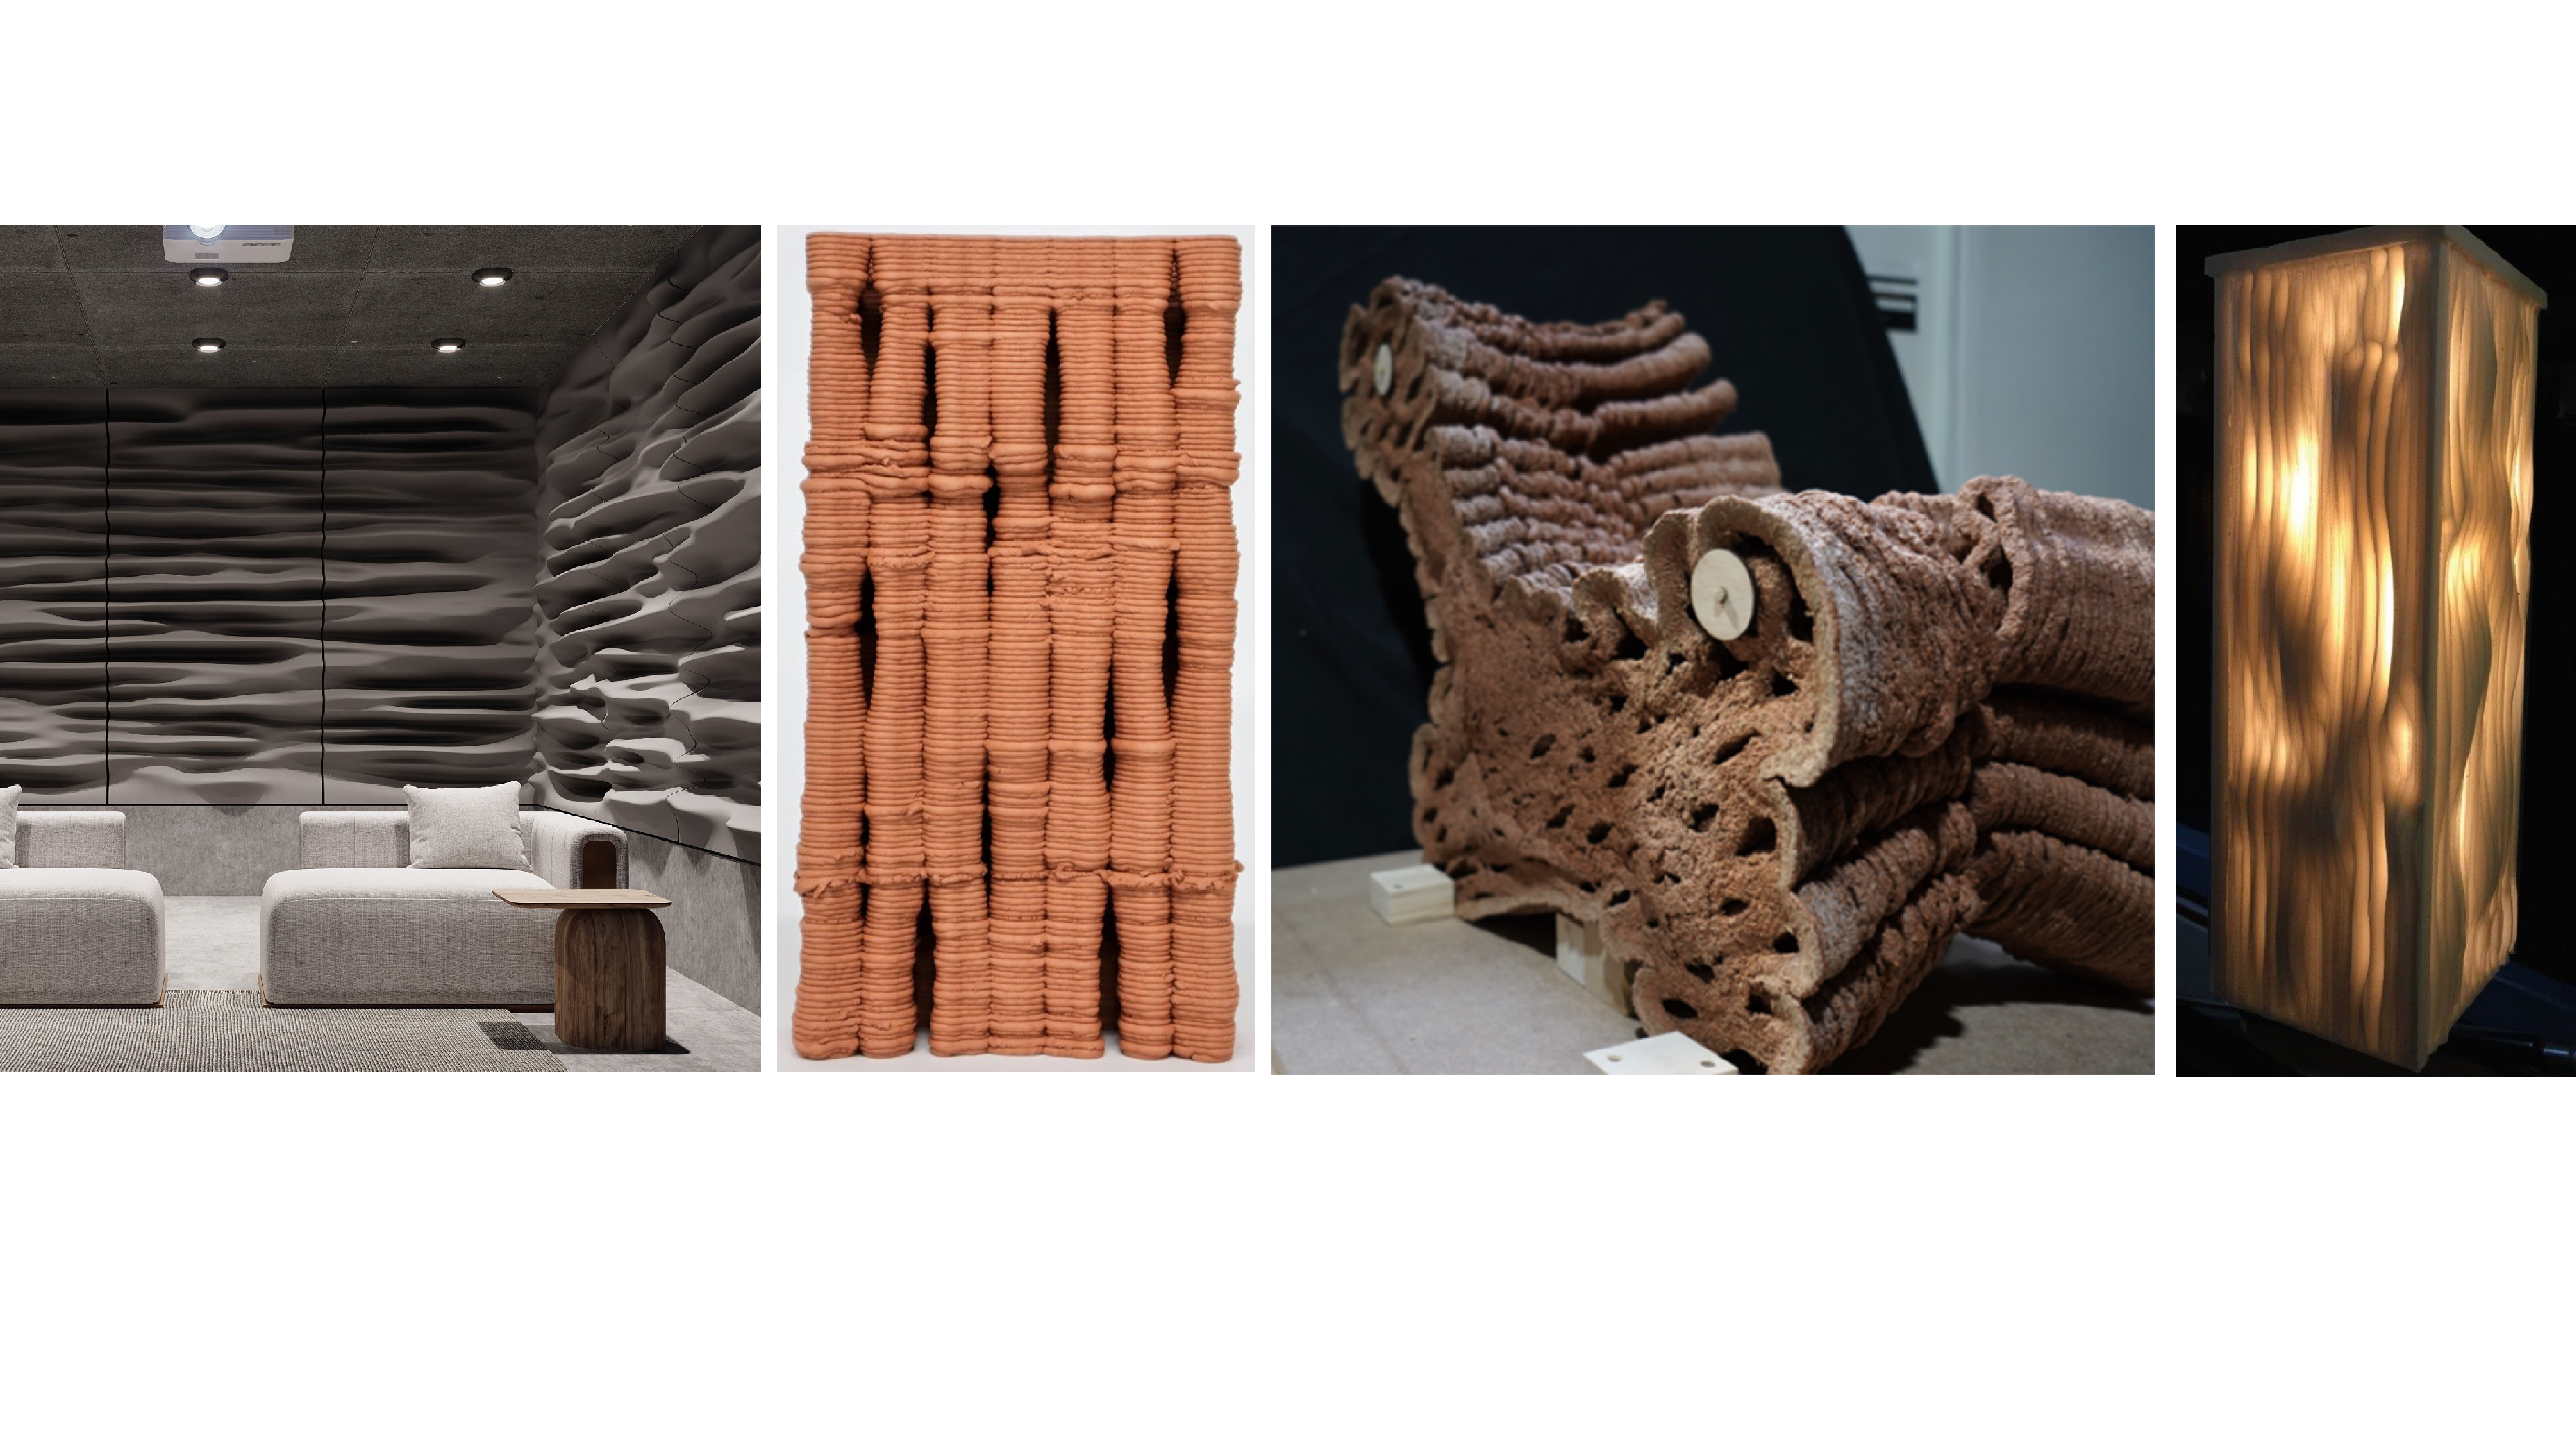
Our curiosity brought us to an intriguing investigation at the nexus of technology, craftsmanship, and acoustics in the quest to elevate spatial design. This blog shares the story of our journey, where we used a cutting-edge multi-material 3D printing technique to produce personalized sound-diffusing walls—a first for the industry. Our concept began with a straightforward yet deep idea: combining the natural beauty of cork with the tactile properties of clay to create walls that are more than just stationary constructions. Motivated by the cadence of sound waves, our aim was to convert these imperceptible patterns into observable, visually arresting shapes.
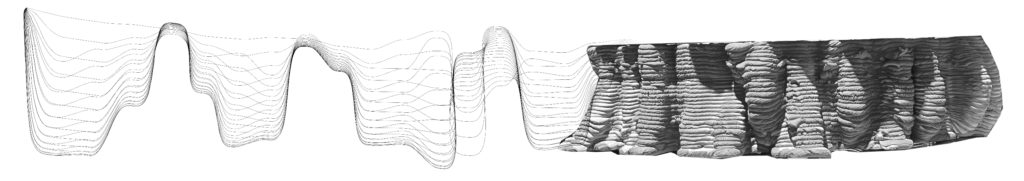
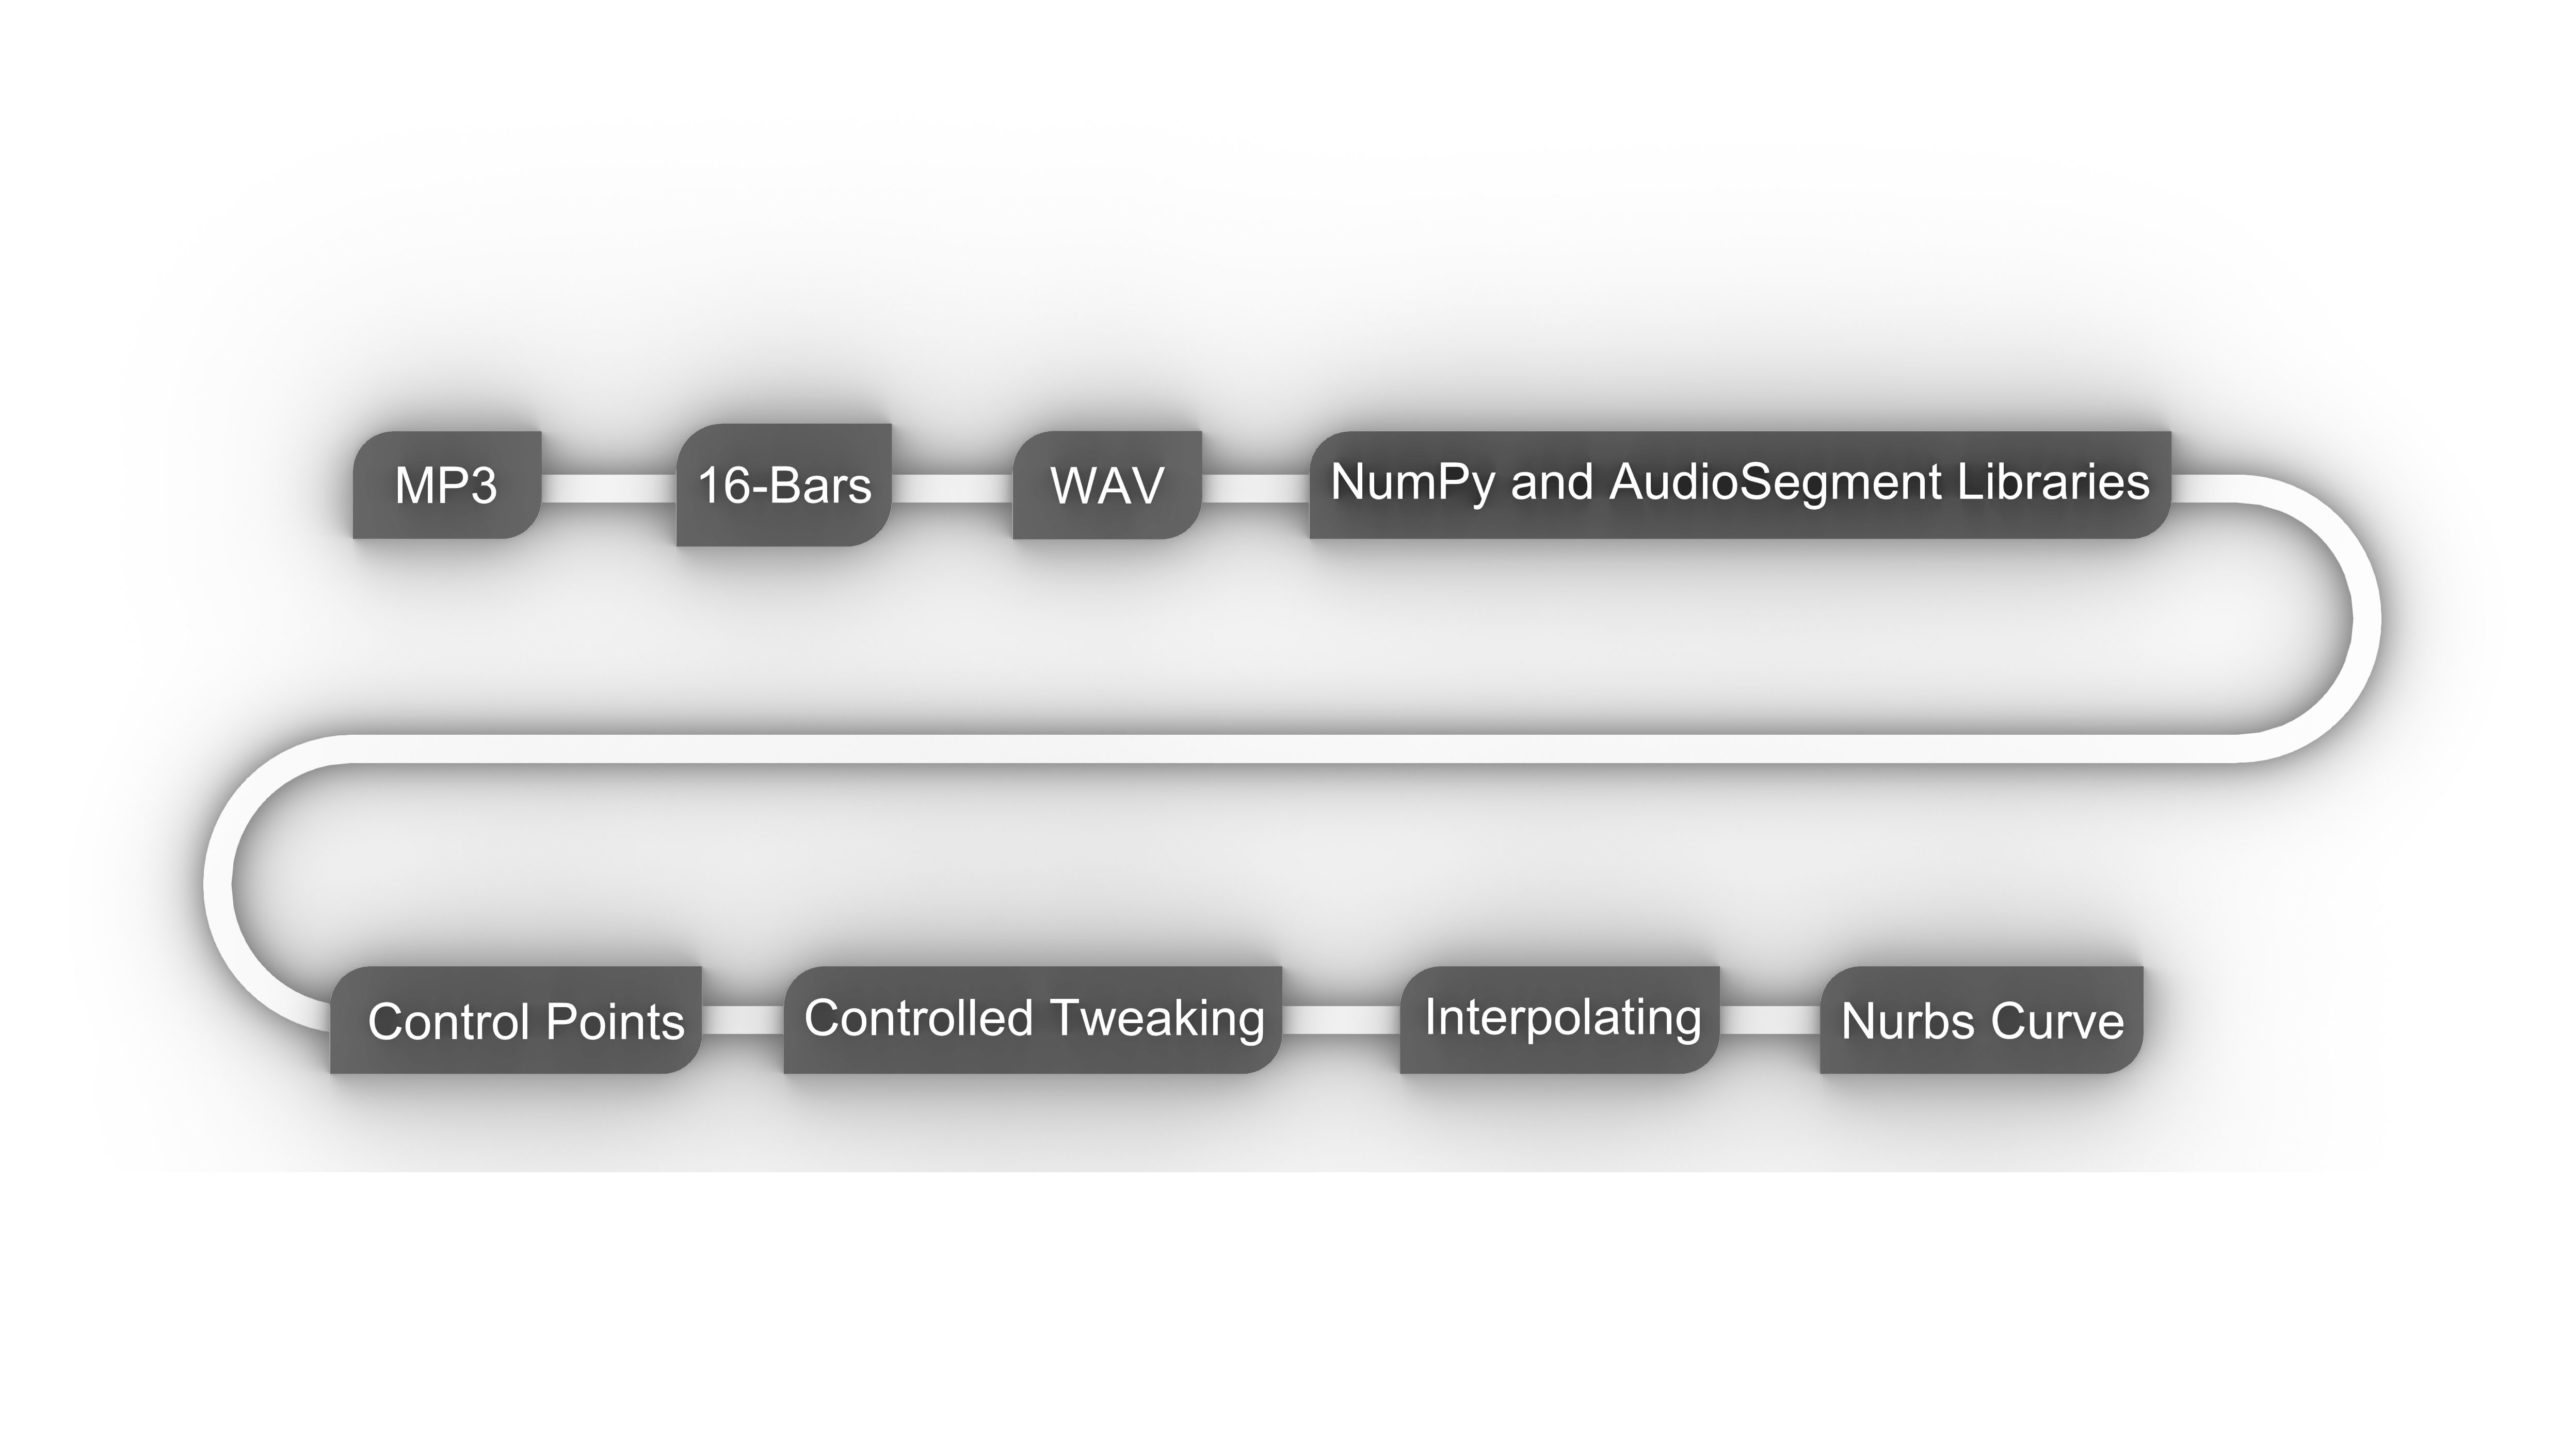
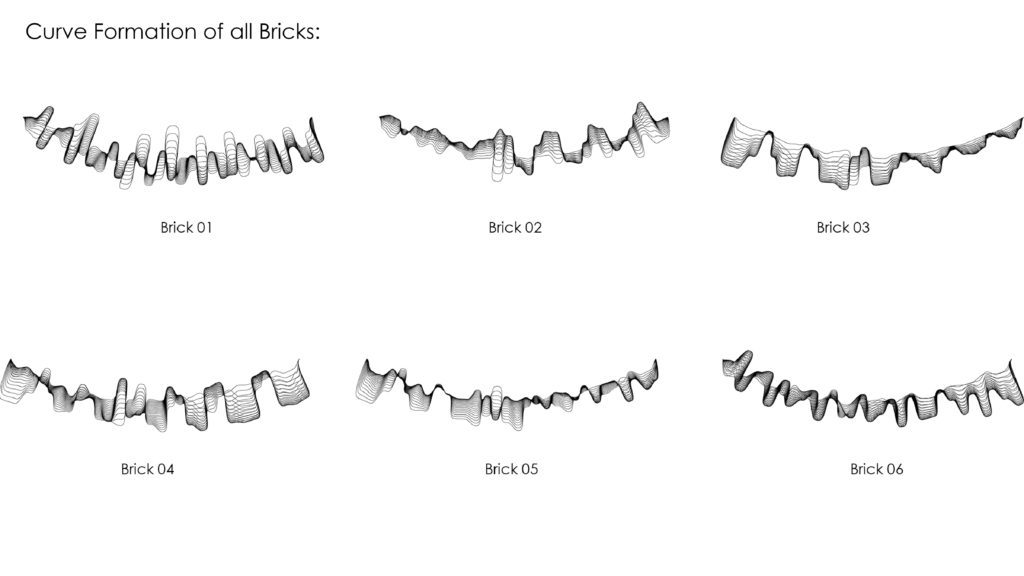
We started our experiment by turning sound into a physical blueprint. We methodically extracted 3D coordinates by dividing audio frequencies into 16 bars, which allowed us to give shape to the invisible movements of sound. These coordinates served as the foundation for a Nurb curve, which is a digital representation of the fluidity that we wanted to physically manifest.
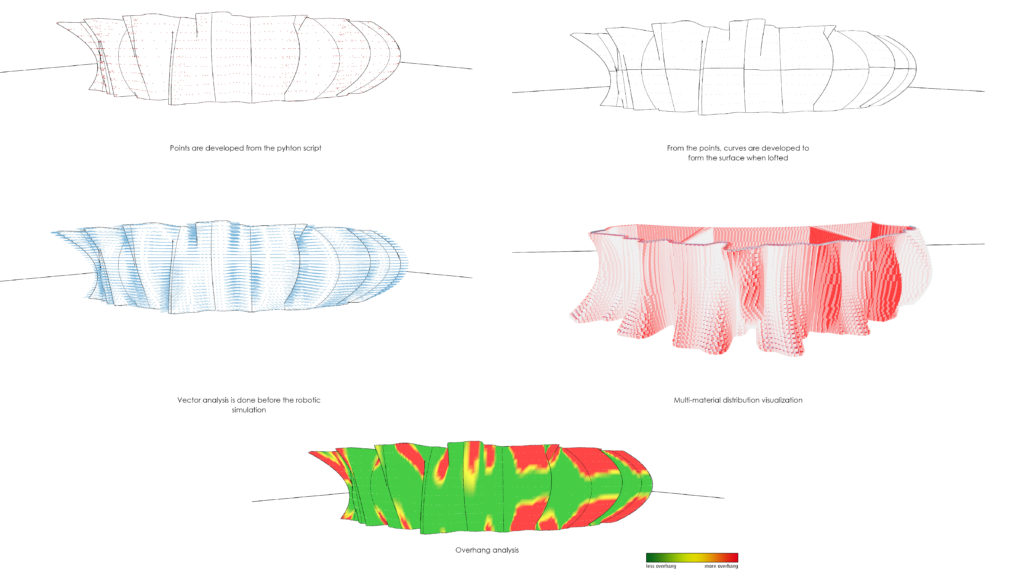
The process of turning a digital blueprint into a physical reality was creative and experimental. We used an advanced ABB 140 robot for fabrication and a process called “interpolating” to make the Nurb curve come to life. We were able to produce a dynamic, flowing surface that mimics the organic bends seen in nature by carefully modifying the curvature. As this surface served as our 3D printer’s canvas, the experiment was engaging. We used two clay cartridges[Red and White], our printer combined the special properties of red and white clays that were chosen for different applications. Because of the multi materials used, the finished product will have an improved acoustic performance in addition to being aesthetically pleasing. With the power of multi-material 3D printing. It’s an experiment that goes beyond the confines of traditional design, pushing the boundaries to create spaces that are both visually stunning and acoustically exceptional. As we unravel the layers of this curious research, we invite you to witness the birth of a new era in design, where simplicity and elegance converge to craft harmony in every space.
Inspiration
Sound Acoustics:
Sound Diffuser Vs. Absorber
A sound diffuser disperses the reflected sound waves away from the listening position while an absorber dissipates or absorbs it. As a result, sound diffusers will make a room more lively as compared to sound absorbers.
Form Finding:
Loading a plethora of mp3 files into a single directory allows ease of use when navigating around files and sorting data. With a list of initial songs, we select a song and segregate sections of it into their own respective bars. Using open libraries such as NumPy and AudioSegment, we can pivot towards more controlled use of audio files after converting mp3 to wav. Creating a mono wave from the audio file, the function of AudioSegment is utilized to control the channel. Some functions of NumPy are used for; the threshold of amplitude and the peaks are controlled with an assumption of a 4/4 arrangement, and calculating the duration of each beat. This helps create an average when controlling points within a wave of a bar. With this the start and end indices of the specified bar can be calculated along with step sizes that will be divided into a selected point of 8. Running a simple ‘for loop’ through a list of wave averages, each segment is appended into a list which is shown in data in an array as average points. To convert this data onto an {xy} axis, putting timeframes as an axis allows a physical demonstration of sound waves to be seen from point 0 onwards. The x axis would represent time, and the y axis represents average amplitudes of a section. With this data there is a level of control when it comes to writing to a file where the data can be modified by multiplying or dividing each axis to control the sound wave. Notable flexible variables will be based on the scale of a project. Controlling bar numbers from a song, the quantity of points averaged from a bar and how many bars in a section. In this project each bar takes 8 points from 2 bars in 6 section blocks to show 6 genres represented by a song from each genre respectfully.
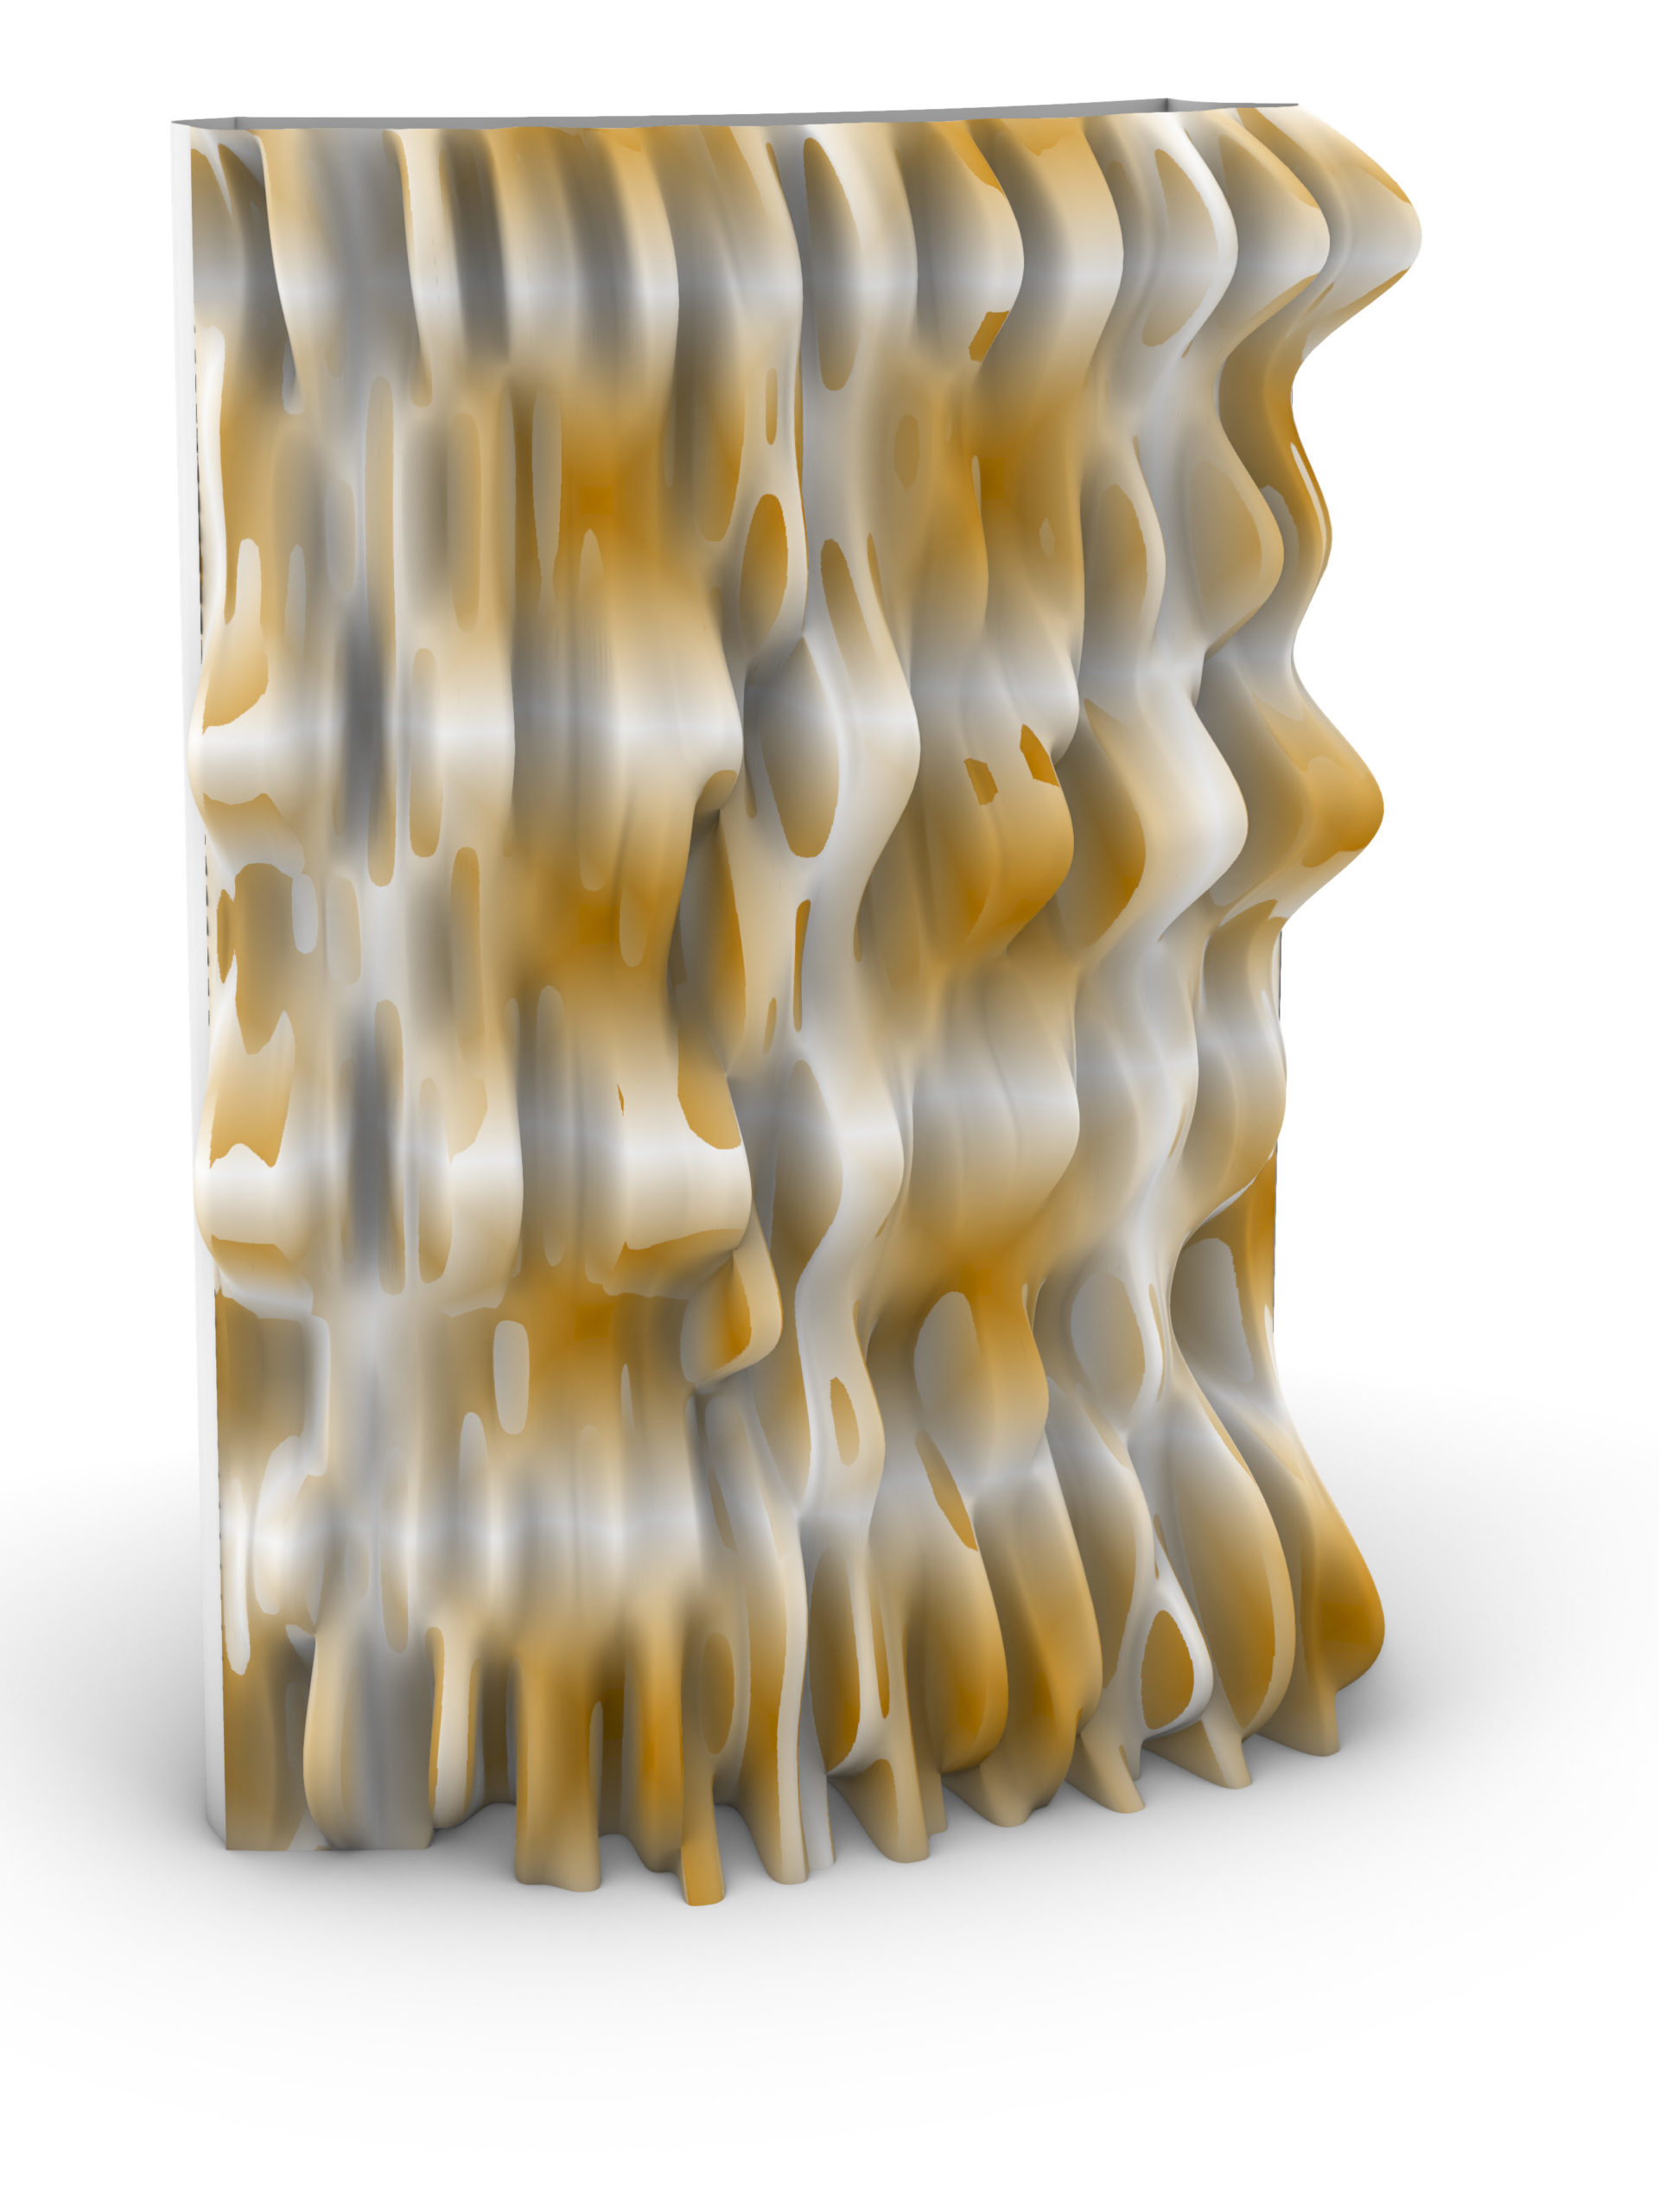
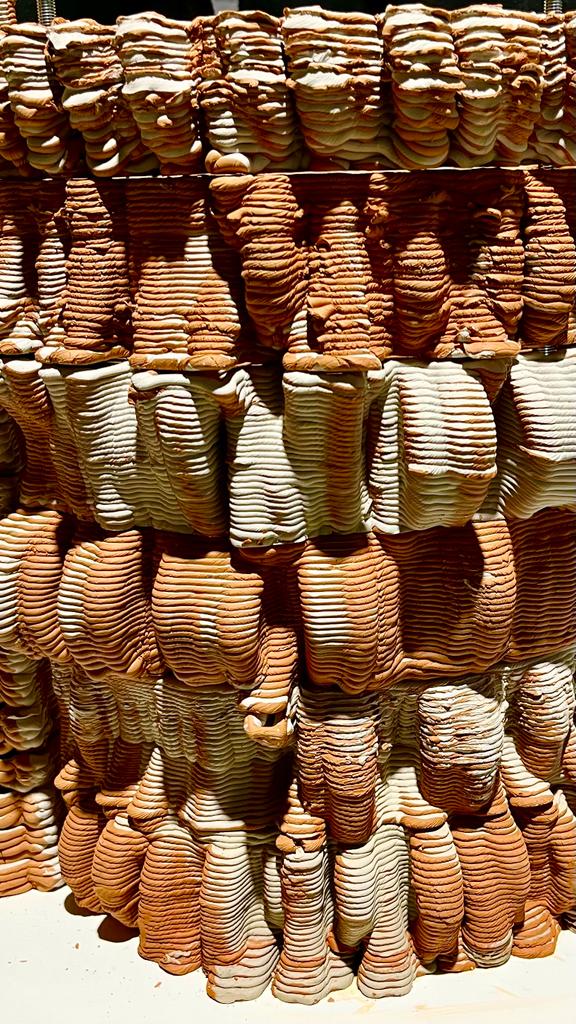
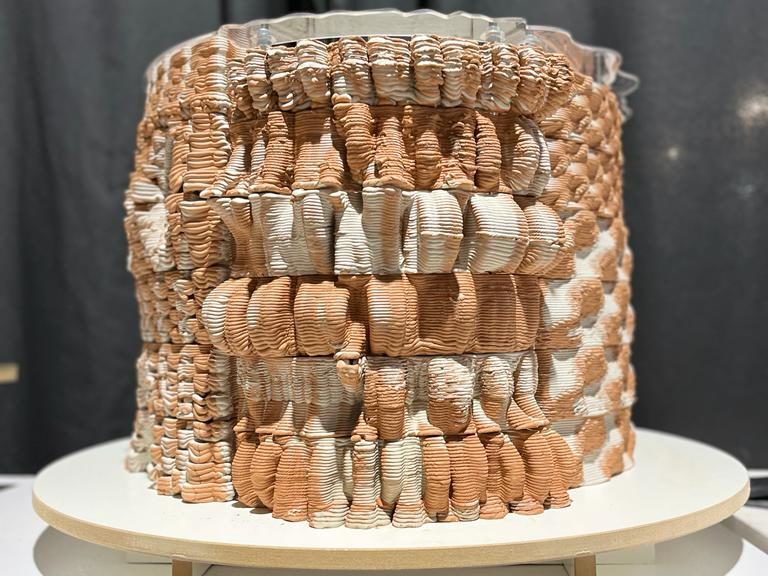
Final outputs: