The Master in City & Technology’s academic structure is based on IAAC’s innovative, learn-by-doing and design-through-research methodology which focuses on the development of interdisciplinary skills. During the Master in City & Technology students will have the opportunity to be part of a highly international group, including faculty members, researchers, and lecturers, in which they are encouraged to develop collective decision-making processes and materialize their project ideas.

The Secrets of the Blue Zones

Introduction The Netflix documentary “Live to 100: The Secrets of the Blue Zones” explores regions known for their high numbers of centenarians, focusing on lifestyle, diet, and culture over geographical aspects. Highlighting commonalities such as strong community ties, plant-based diets, and active living, it aims to inspire healthier lifestyle choices. Although it emphasizes the principles … Read more

Music_Mental Health

Undertaken by: Avi Sharma Hypothesis : Exposure to Music correlates with variations in Mental Health among people. We all know that listening to music can evoke various emotions, depending on the song. What I am exploring is the idea that exposure to music, in general, can play a role in shaping your overall mental health … Read more

Built Heritage vs Real Estate Market. The Barcelona case

python analysis BCN

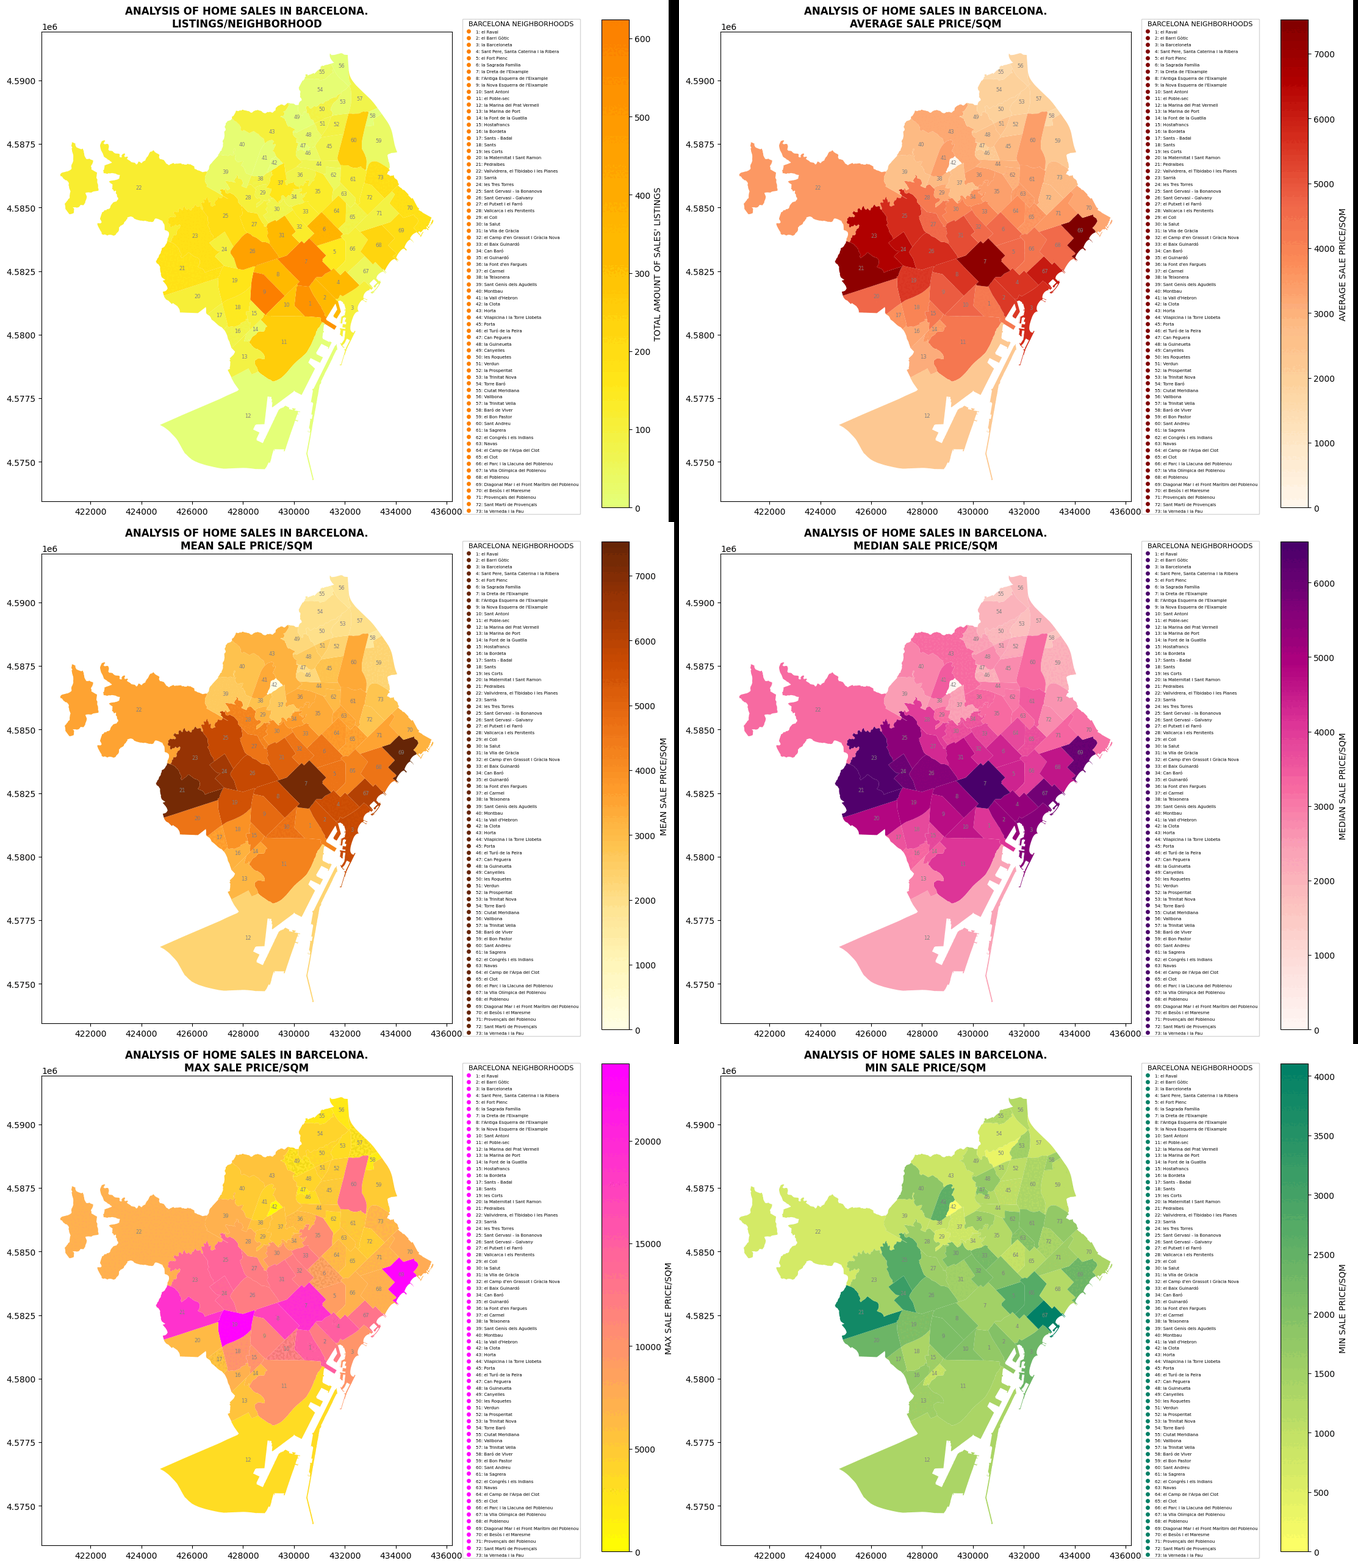
Main question. How built heritage affects real estate market in European cities? Hypothesis Let’s look at this question on the example of Barcelona. Let’s single out the city neighborhoods (barrios) where historical buildings are located, and analyze the ratio of average real estate prices to them, in particular, the sale prices of apartments and houses. … Read more

????? • Rent • Proximities

The city of Mumbai, known as the financial and entertainment capital of India, has experienced a significant surge in housing prices and rents in recent years. The demand for residential properties in Mumbai has been steadily increasing due to factors such as population growth, urbanization, and the city’s thriving job market. In the midst of … Read more

Identifying formal housing projects, New Delhi

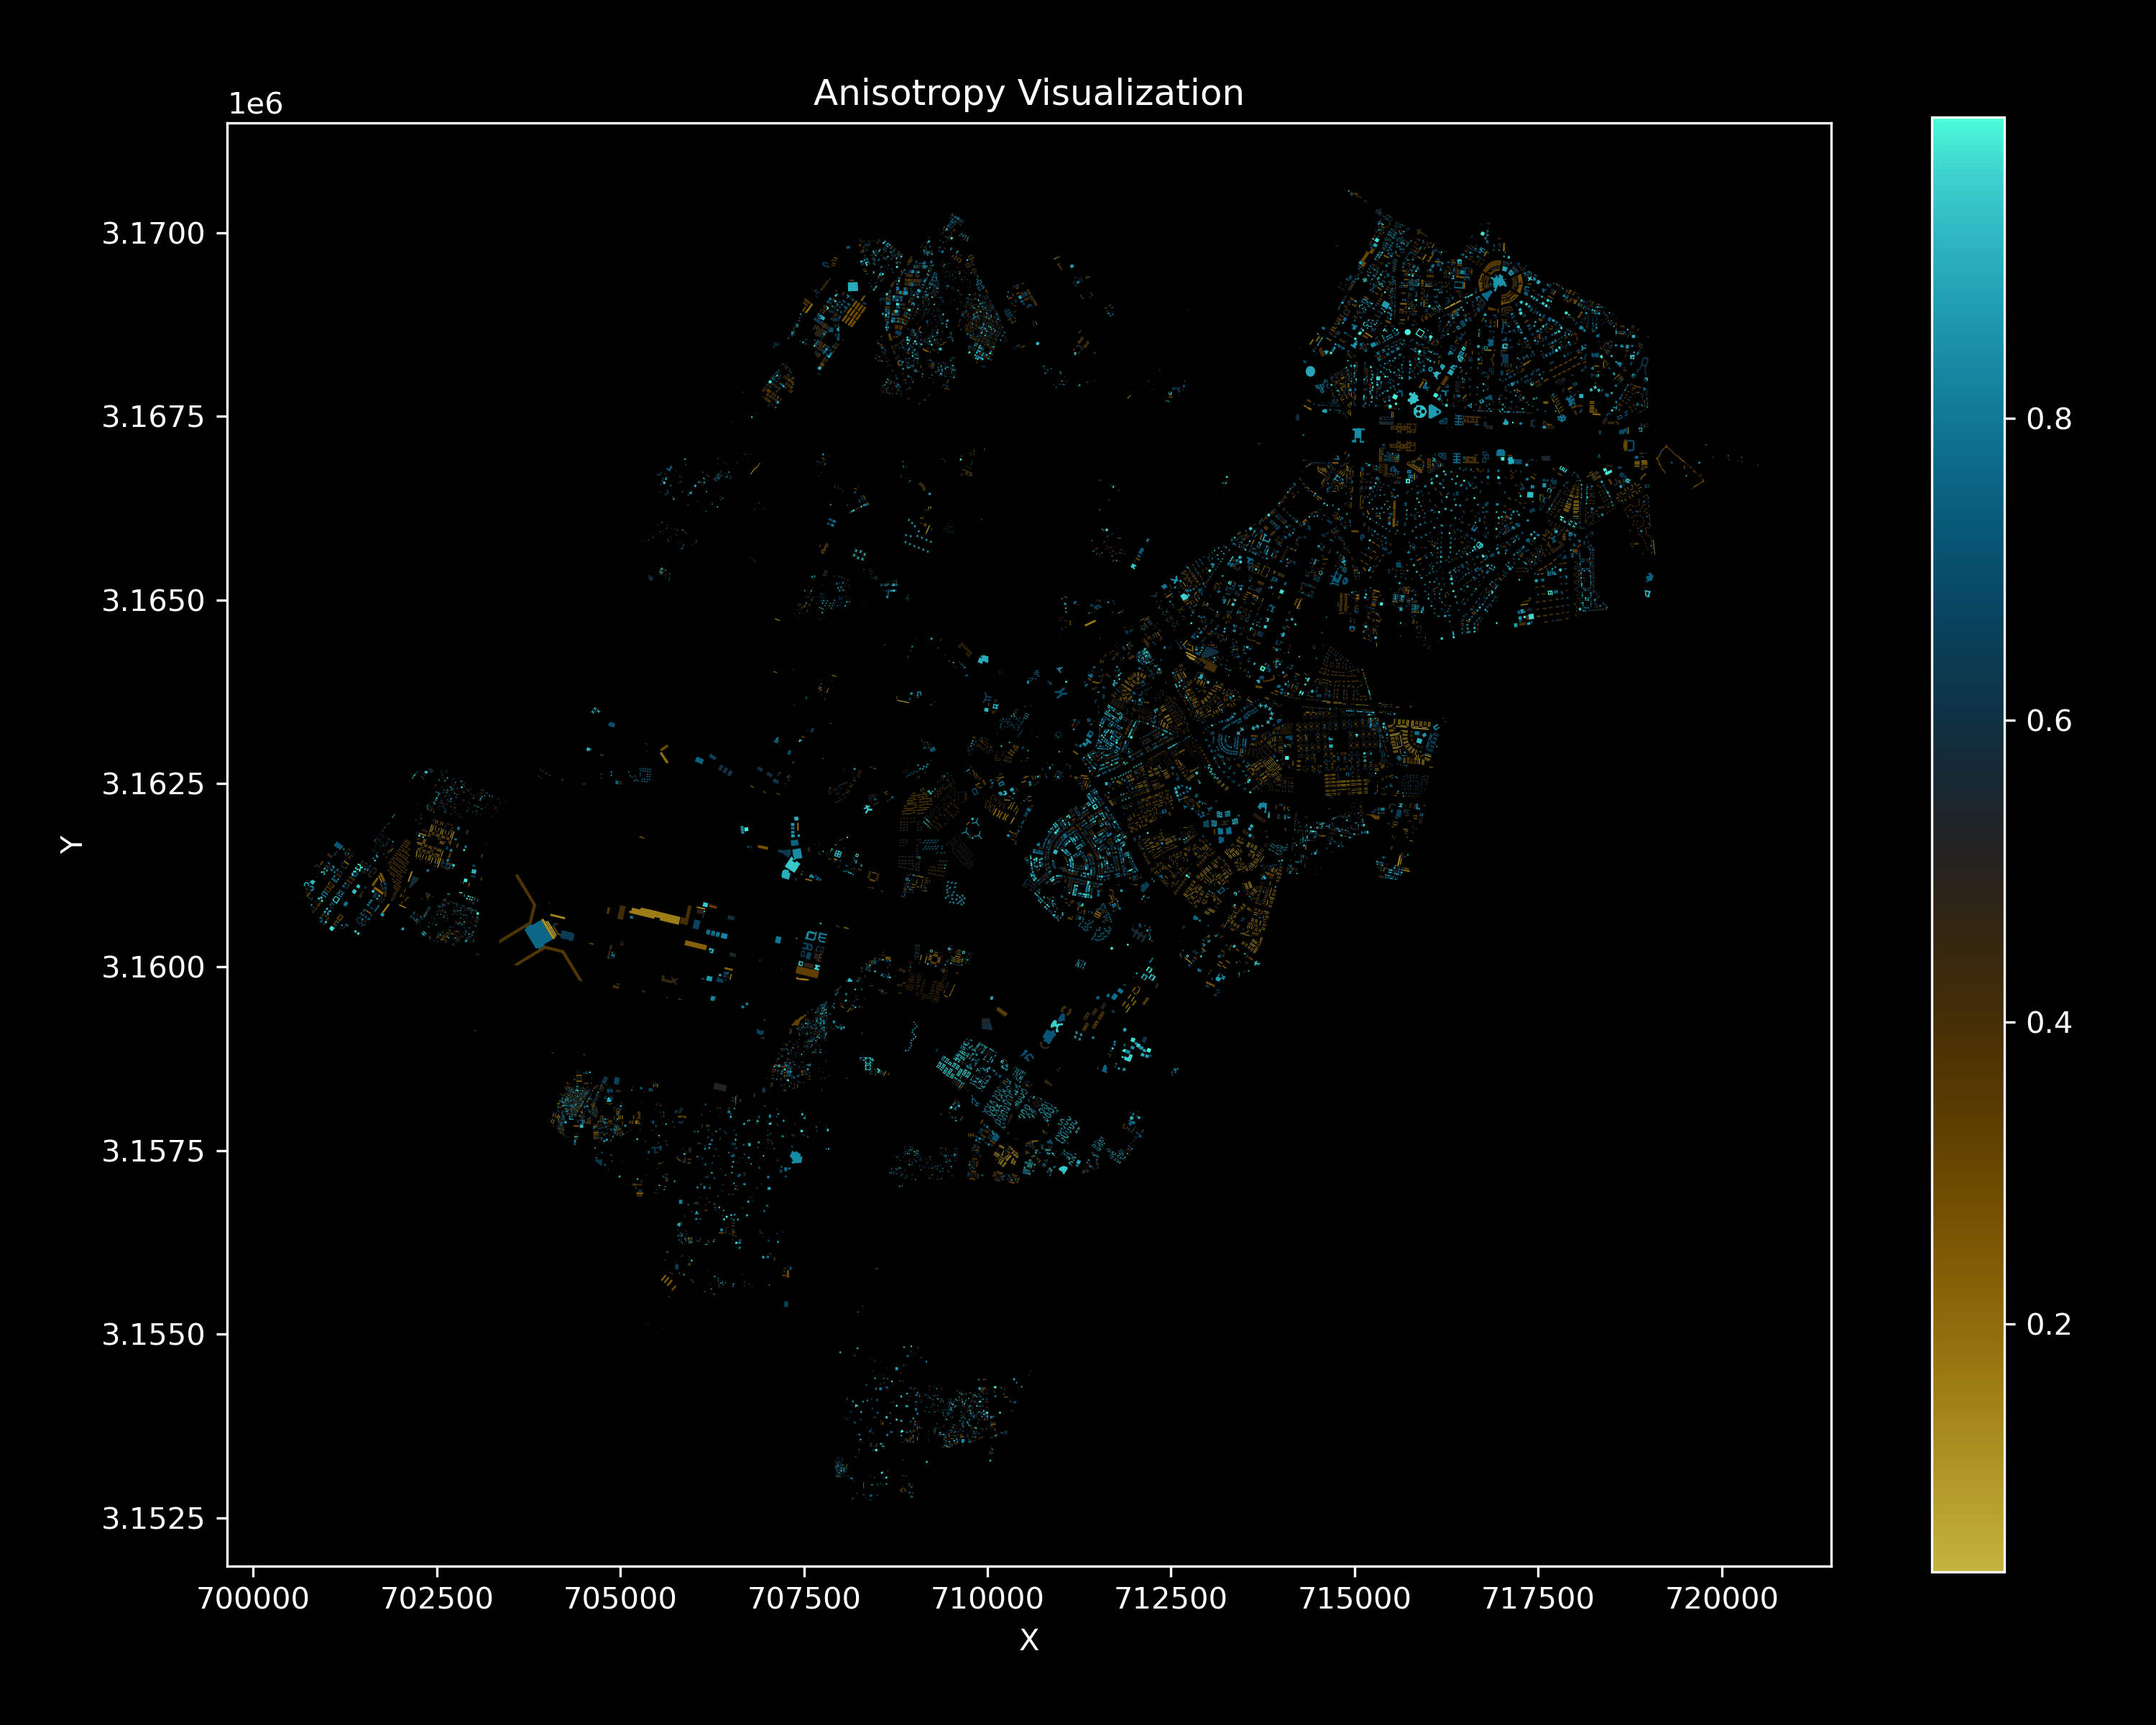
During the Internet of Building studio we developed a strategy of predicting the typologies of buildings in New Delhi, India by data, using algorithmic approaches as KMEANS, DBSCAN and PCA aswell a a heuristig rule-set. The objective of this project is to predict if a building in New Delhi is part of a formal settlement … Read more

New York Taxi Analysis

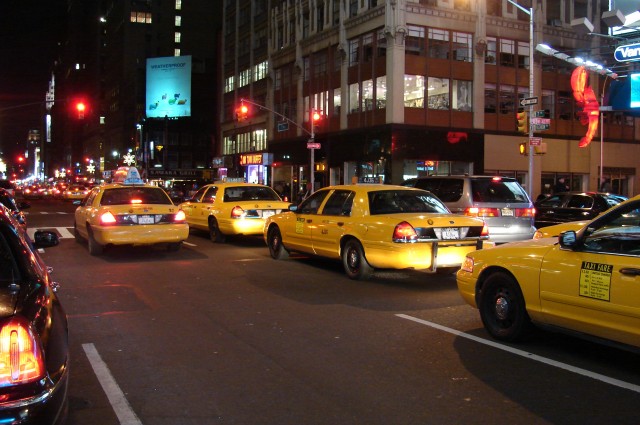
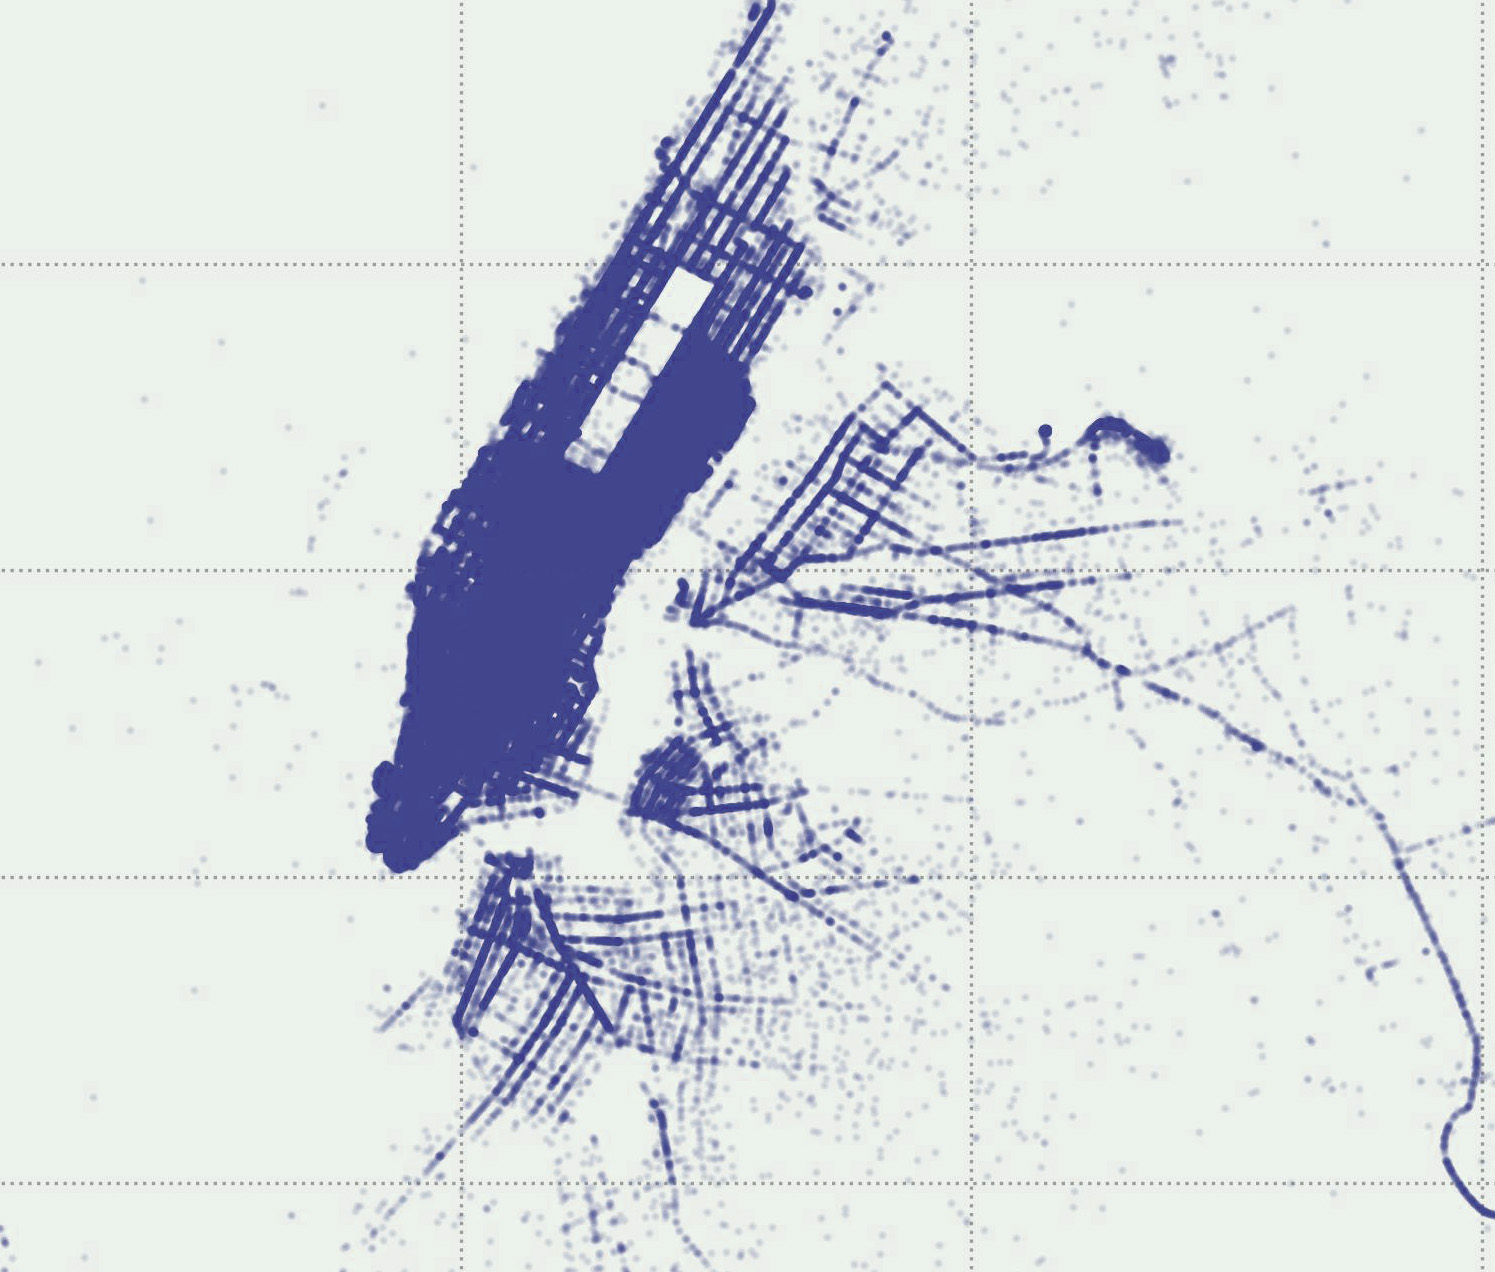
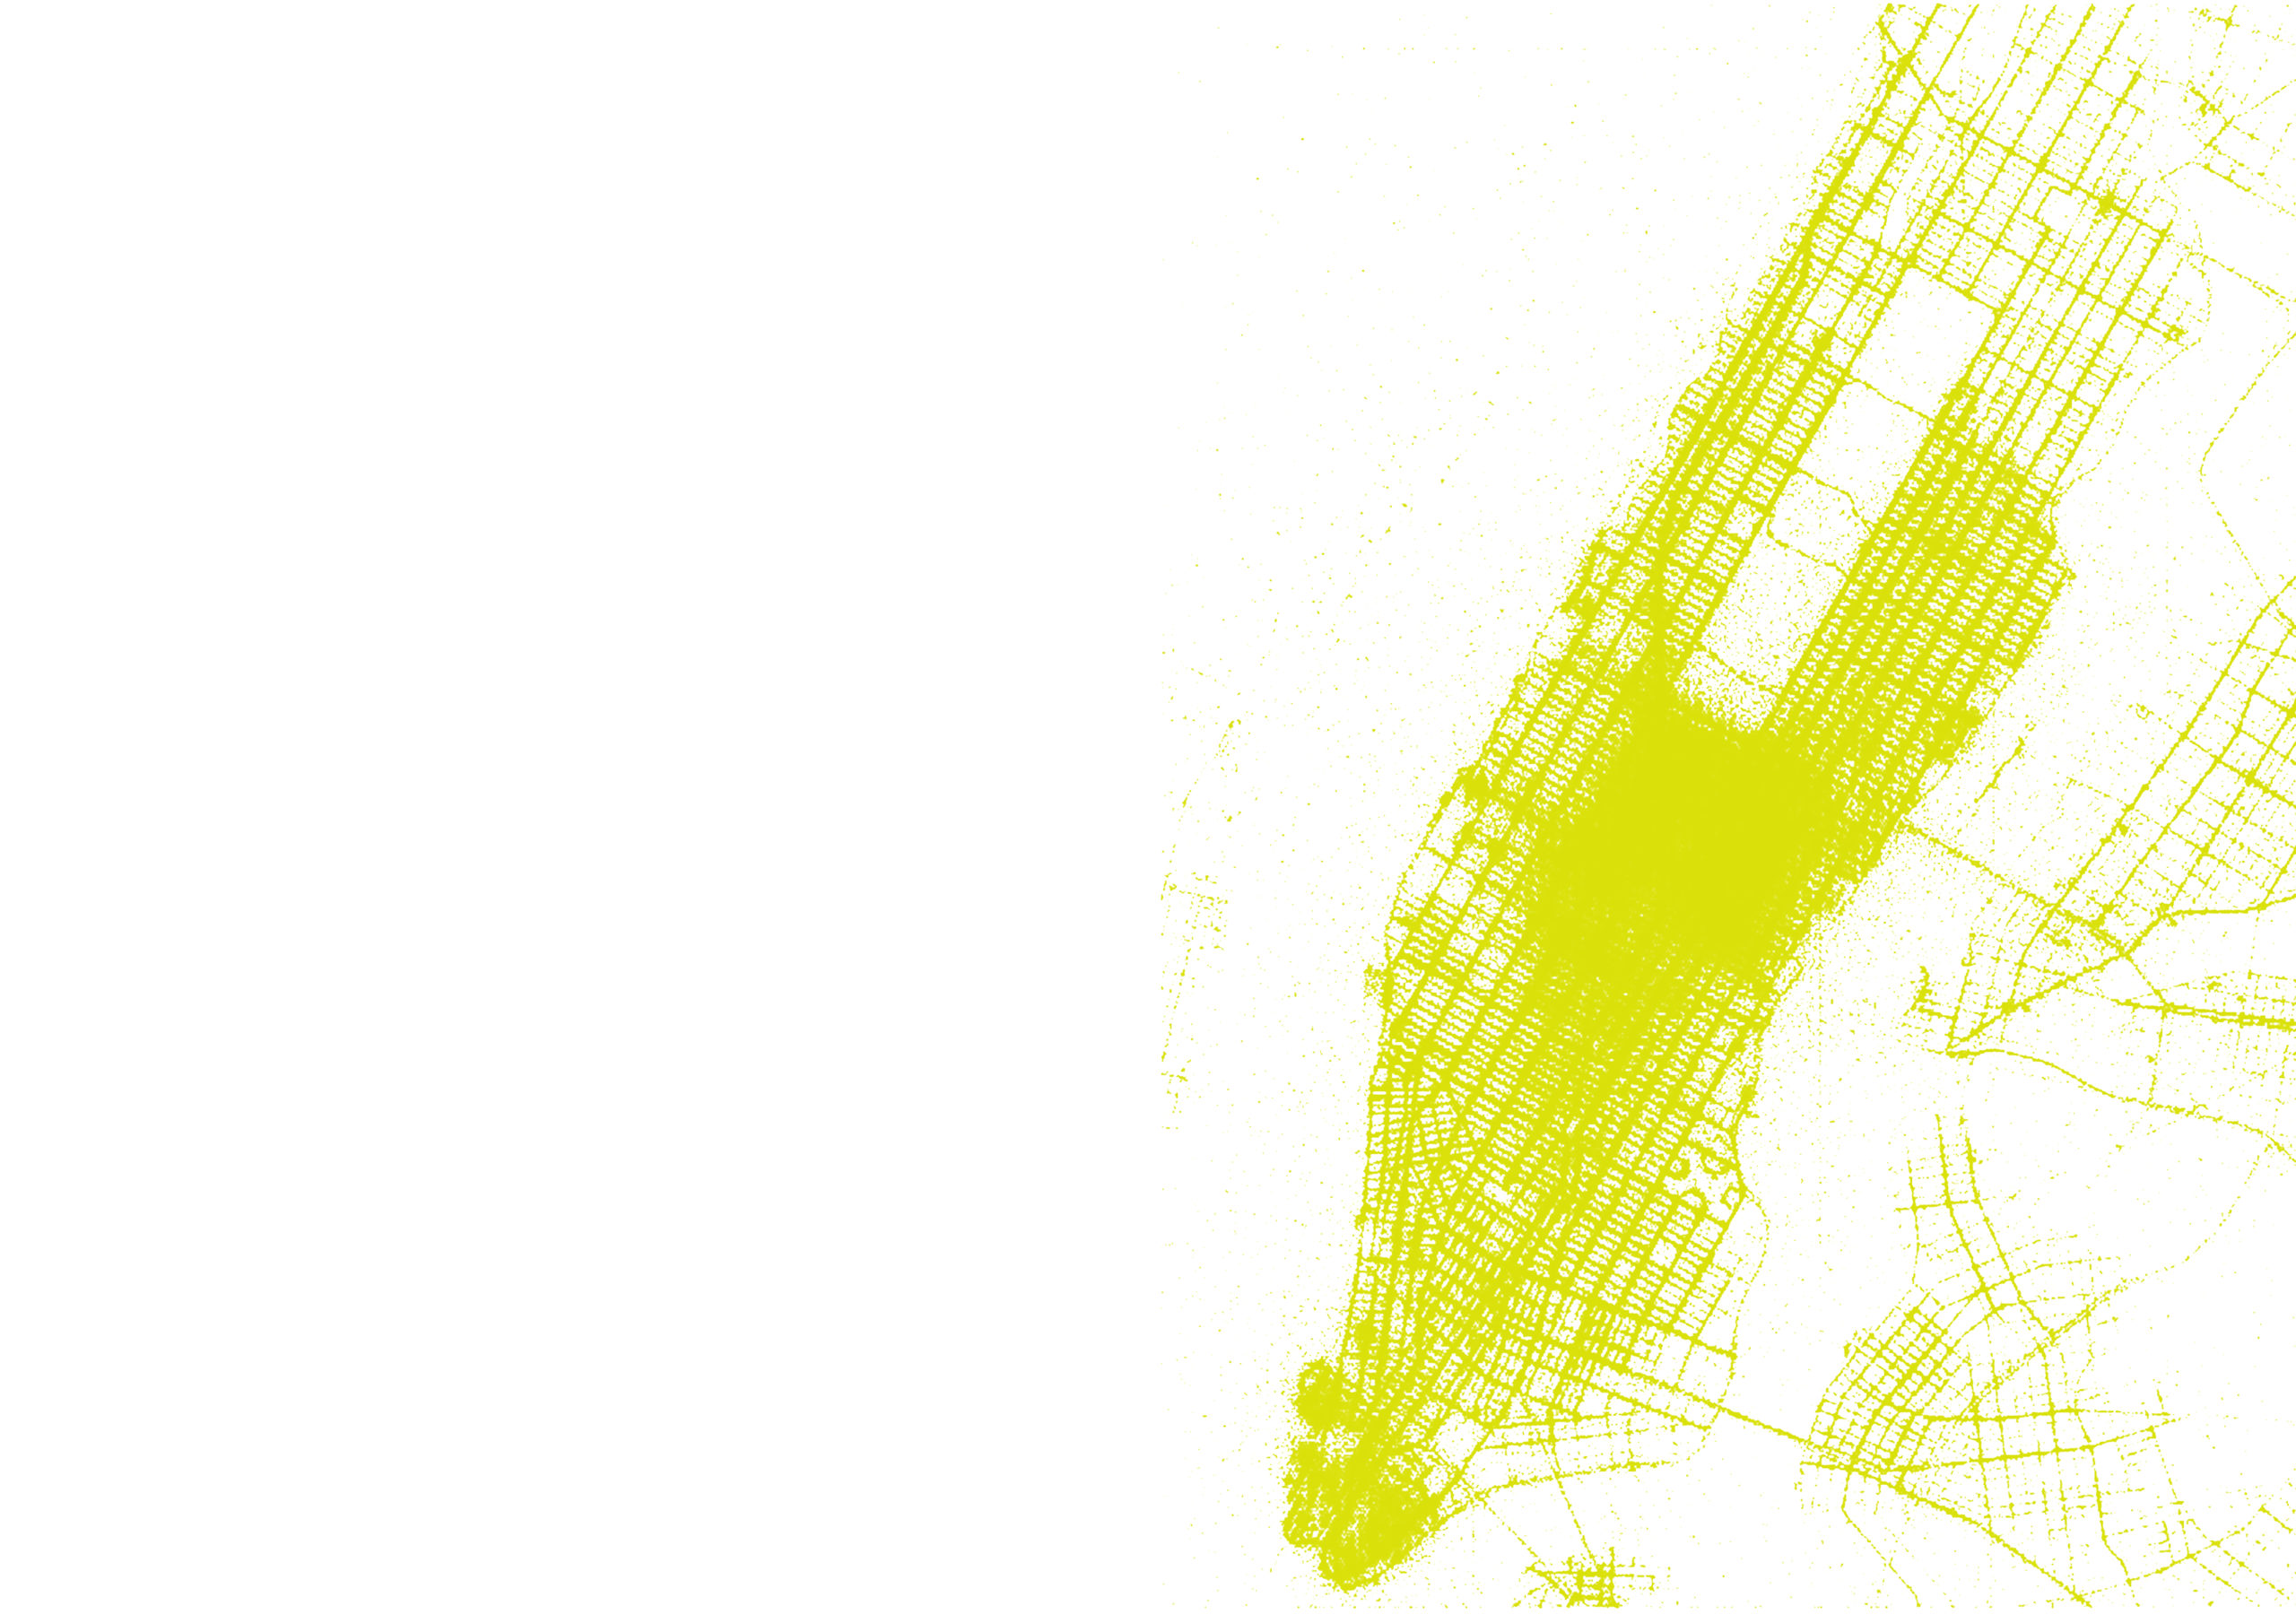
As the Submission about Data Digital Tools & Big Data II, we analyzed the new york taxi data. We were given the data about Taxi Infomation in New York, in 2016.In this data, there is information, from the data, I made new information, Erased some columns, and fix the data. Reading the data the data … Read more

NYC Taxi Time Traveler

The New York City Taxi Trip Duration competition is a challenge to develop a model that predicts the total ride time of taxi trips in New York City. Yellow medallion taxicabs, which number 12,779 in New York City, generate a substantial revenue of $1.8 billion per year by providing transportation services to around 240 million … Read more

Machine learning model to predict NYC cabs’ trip duration

Goal: to predict trip duration of NYC cabs using machine learning models. Tools: Python + Nympy + Pandas + Datetime + Plotly.express + Matplotlib + Math + Seaborn + Bokeh + Sklearn Stages of project: data cleaning, data analysis, data preparation, data testing, evaluating prediction accuracy. Data cleaning The first dataset visualization with splitting datasets … Read more

Data-Driven Rides

Machine Learning-based Analysis of NYC Cab Trip Duration “Data-Driven Rides” is an entry for the first MaCT Machine Learning Competition that hosted on Kaggle which involves predicting the duration of taxi rides in New York City. The dataset provided for this competition is based on the 2016 NYC Yellow Cab trip record dataset and the … Read more

NYC Taxi Trip Duration Predictive Modeling

The objective of this exercise is to build a machine learning model that will predict taxicab trip durations based on 2016 NYC Yellow Cab trip record data. Data Fields Based on this, this project will develop a machine learning regression algorithm capable of predicting the duration of a trip based on the variables provided by … Read more

Predicting NYC Cab Ride Duration using ML

The MaCT01 students were tasked with training a model that would be used to predict NYC yellow taxi ride durations using machine learning. The dataset included pickup and drop-off datetimes, location coordinates and passenger count. Visualizing the data helped to understand the correlation between the columns and remove the highly correlated values Understanding the distribution … Read more

NYC taxi trip duration prediction

The data used to prediction is the New York City taxi data from January, 2016 to June, 2016 and New York City weather data from the same time duration. The taxi data has features about pickup time detailed to seconds. Considering the traffic condition could be affected by weekday and hour, so I deconstructed the … Read more

New York City Taxi Trip Duration

INTRODUCTION The competition is based on the 2016 NYC Yellow Cab trip record dataset. The challenge is to build a model that predicts trip duration for New York City taxis using machine learning. The dataset includes pickup time, geo-coordinates, number of passengers, and several other variables. Based on individual trip attributes, a code was written … Read more

1st Traditional IAAC MaCT ML Competition

#Objective #A Kaggle Competition to MaCT01 students to show their knowledge, designing an end-to-end machine learning project to predict the “Trip Duration” of NYC Taxi trips. #Workflow #First of all a workflow hast do be developed, which represents a classic approach for training machine learning models, analysing the provided training data provided by the submission, … Read more

NYC Cab Trip Duration Prediction

The aim of the project is to predict trip duration, using 2016 NYC YELLOW CAB TRIP DATA. Structuring the dataset The analysis begins with outlier identification. The passenger_count variable has two outliers: 0 and 9, which compared to the amount of people allowed by the NY Limousine law, is impossible. Also, there were some pickup … Read more