Coding Nature

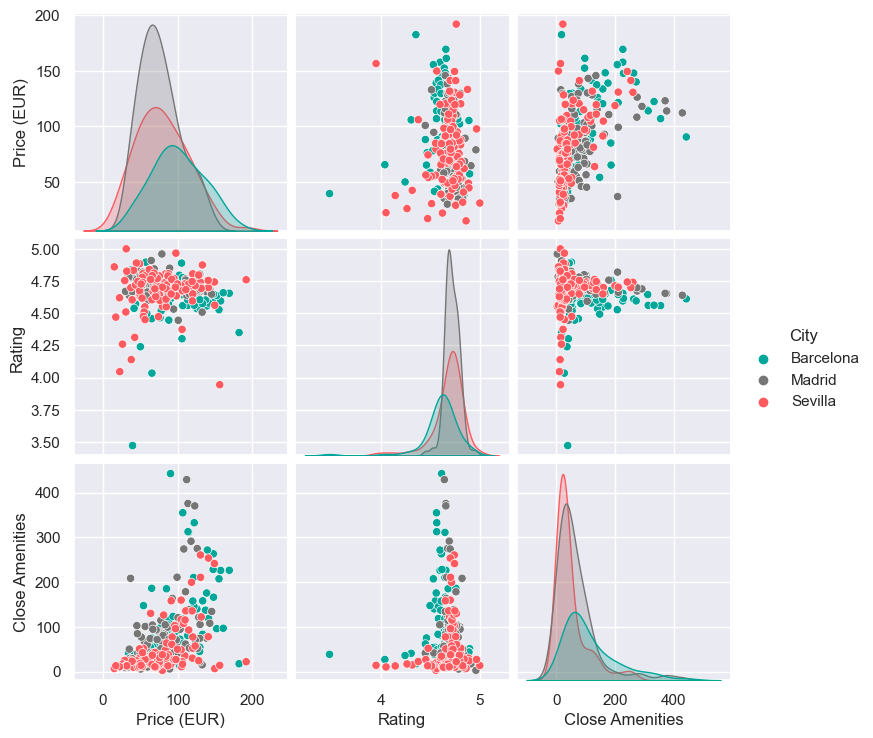
Investigating the Impact of Open Green Spaces on Airbnb Rates with Python 1. Introduction The industry of tourism in Barcelona has seen a major hike in the past couple years. Post-covid Barcelona has also become an educational hub for students from across the globe. The increase in Inflow of people has also made platform urbanism … Read more
The CourtForge

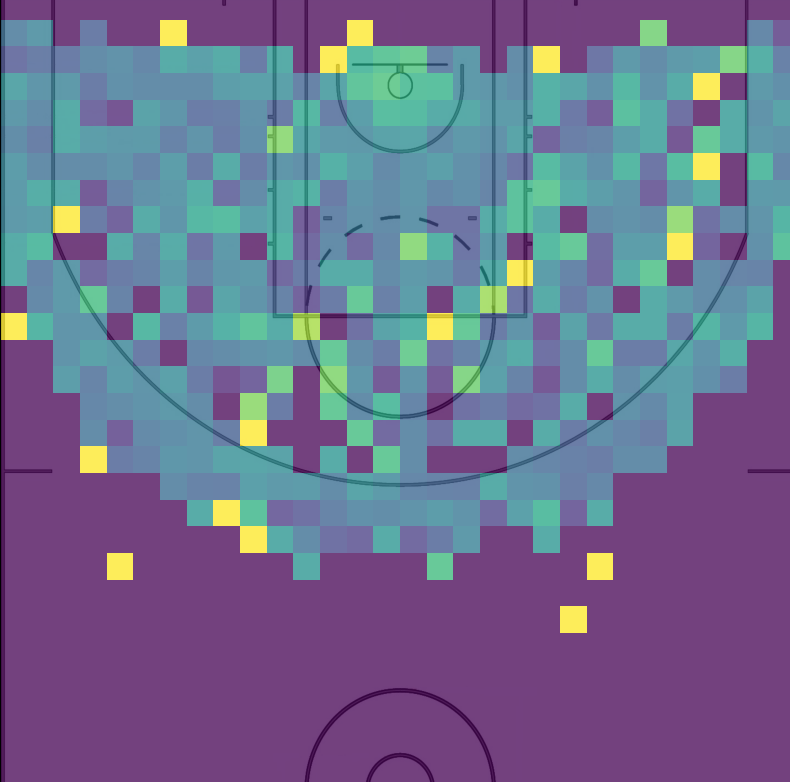
Enlarging the great… Emanuel Ginobili is one of the most -if not the most- accomplished Argentinian basketball players. During his 16 season basketball career in the NBA, that went on from 2002 to 2018, he won 4 championships as one of the San Antonio Spurs “Big Three”, was named an All-Star twice, was selected for … Read more

Python Serpentine : Unraveling Insights in Barcelona’s Airbnb Data

In this blog post, we will walk through a comprehensive data analysis exercise using two datasets related to Barcelona – Airbnb listings and real estate prices. This exercise shows how the data was cleaned, transformed, explored, and visualized using Python alongside popular data science libraries such as Pandas and Plotly. Step 1: Download and Load … Read more

Visualizing GeoSpatial Data in Python – Going from Csv to Graph

Visualizing dataframes using Geopandas and Plotly in Python introduction Python is a versatile and easy-to-learn programming language. GeoPandas extends the data manipulation capabilities of pandas to spatial data, providing a familiar and convenient environment for working with both tabular and geographical data. GeoPandas makes it easy to load, explore, and analyze geographical data. You can … Read more

Data Visualisation using Python

Introduction In today’s data-driven world, the ability to visualize data effectively is a key skill. This blog post introduces the fundamentals of data visualization using Python, a powerhouse in the data science toolkit. We’ll explore essential libraries like GeoPandas, Plotly and Contextily, guiding you through the process of transforming raw data into insightful, visually appealing … Read more

Comparing the land value estimation of Airbnb and the housing market

In this exercise, I visualised the relationship between the price of Airbnb accommodations compared to the price that the regular housing market puts. The visualisation consists of two datasets in csv format as well as a shapefile. The process started by cleaning the data so that equivalent columns in the csv’s could be matched. After … Read more

Note Palette

Music is visualized everyday – but is there any accuracy to its representation? Can sound be accurately represented? If so, what does it look like? How is accuracy measured? While not fully satisfied with the answers found to these questions, Python’s mido package shed light on the how sound and color may be linked through … Read more

Data Visualization Using GeoPandas in Python

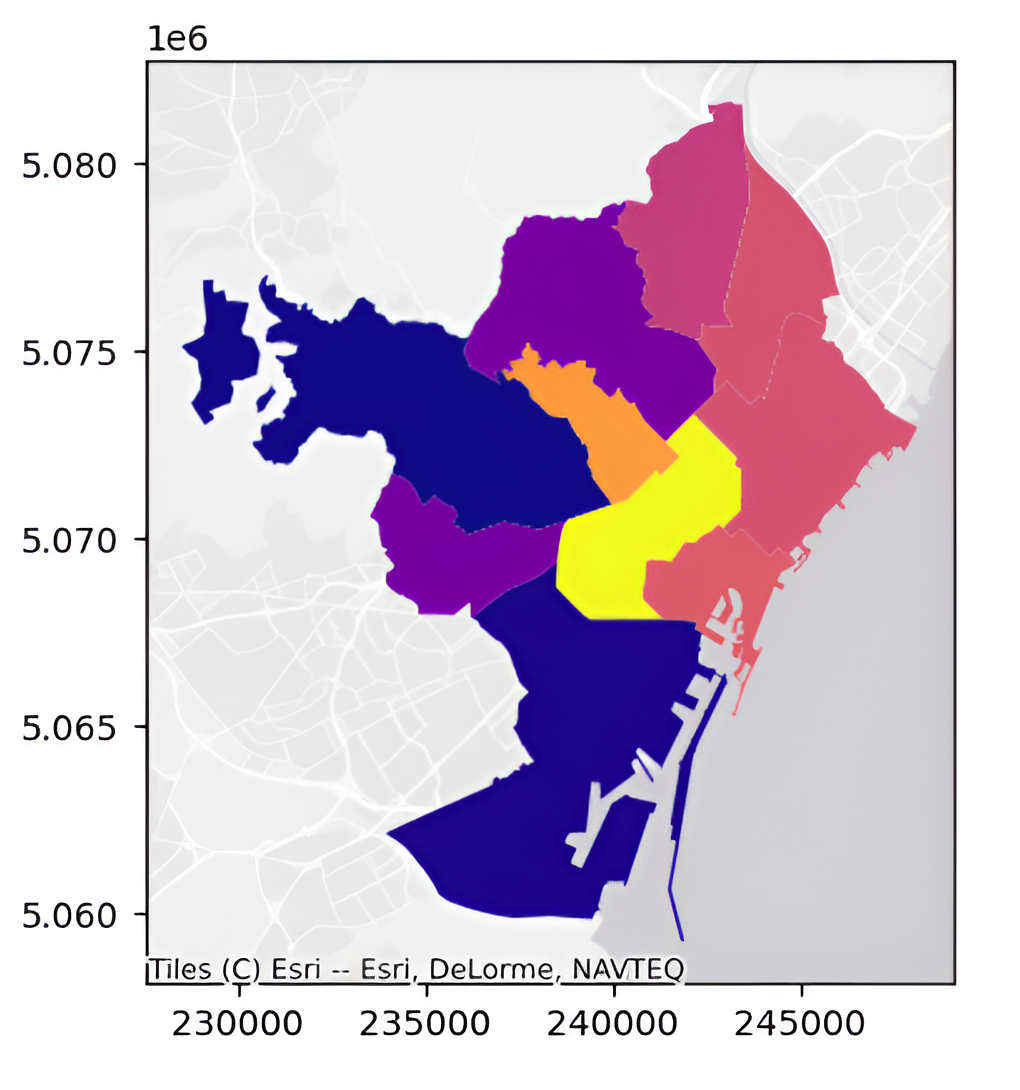
1.Geospatial Mapping using GeoPandas in Python In Python, GeoPandas plays a crucial role in facilitating geospatial analysis through its powerful functions. I will illustrate the concise process of leveraging GeoPandas to create maps of Barcelona. This involves a systematic application of GeoPandas’ functions for effective geospatial data synthesis and mapping. Step 1: Loading GeoDataFrame from … Read more

LA CREMADA

The second year students of Master in Advanced Architecture (MAA) and Master in Robotics and Advanced Construction (MRAC) participate in Llum BCN 2024 with LA CREMADA / THE BURN, an immersive interactive installation that delves deep into the world of wildfires, their origins, impacts, and the critical need for understanding and prevention. The installation, located at Plaça Les Arts, C/ … Read more

Promised Land

Mesh representation of MIDI

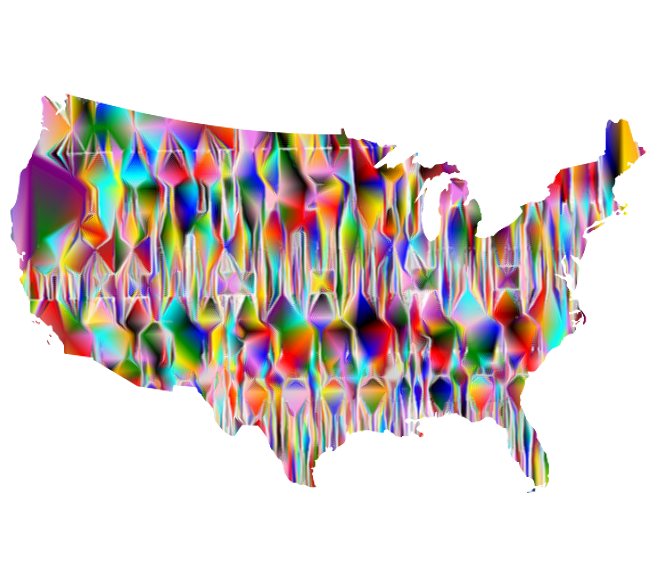
Mapping America’s Genrescape Promised Land, Chuck Berry’s early representation of modern rock and roll, blurs racialized difference in genre origin, fueling the hybridization of genre categorizes, resulting in America’s current rich music tapestry. MIDI data correlated to synaesthetic representations of color is crystalized and in a dense three-dimensional mesh and place qualities are correlated to … Read more

Visualization of Complex Innovation Data using Python

Innovation is a buzzword these days, and everyone seems to be talking about it. However, truly understanding it is a different ball game. Take the Global Innovation Index by the World Intellectual Property Organization (WIPO), for example. It’s a massive framework that pulls data from top-tier organizations worldwide, scoring countries on 100+ indicators. It’s a … Read more

Shining Rebirth

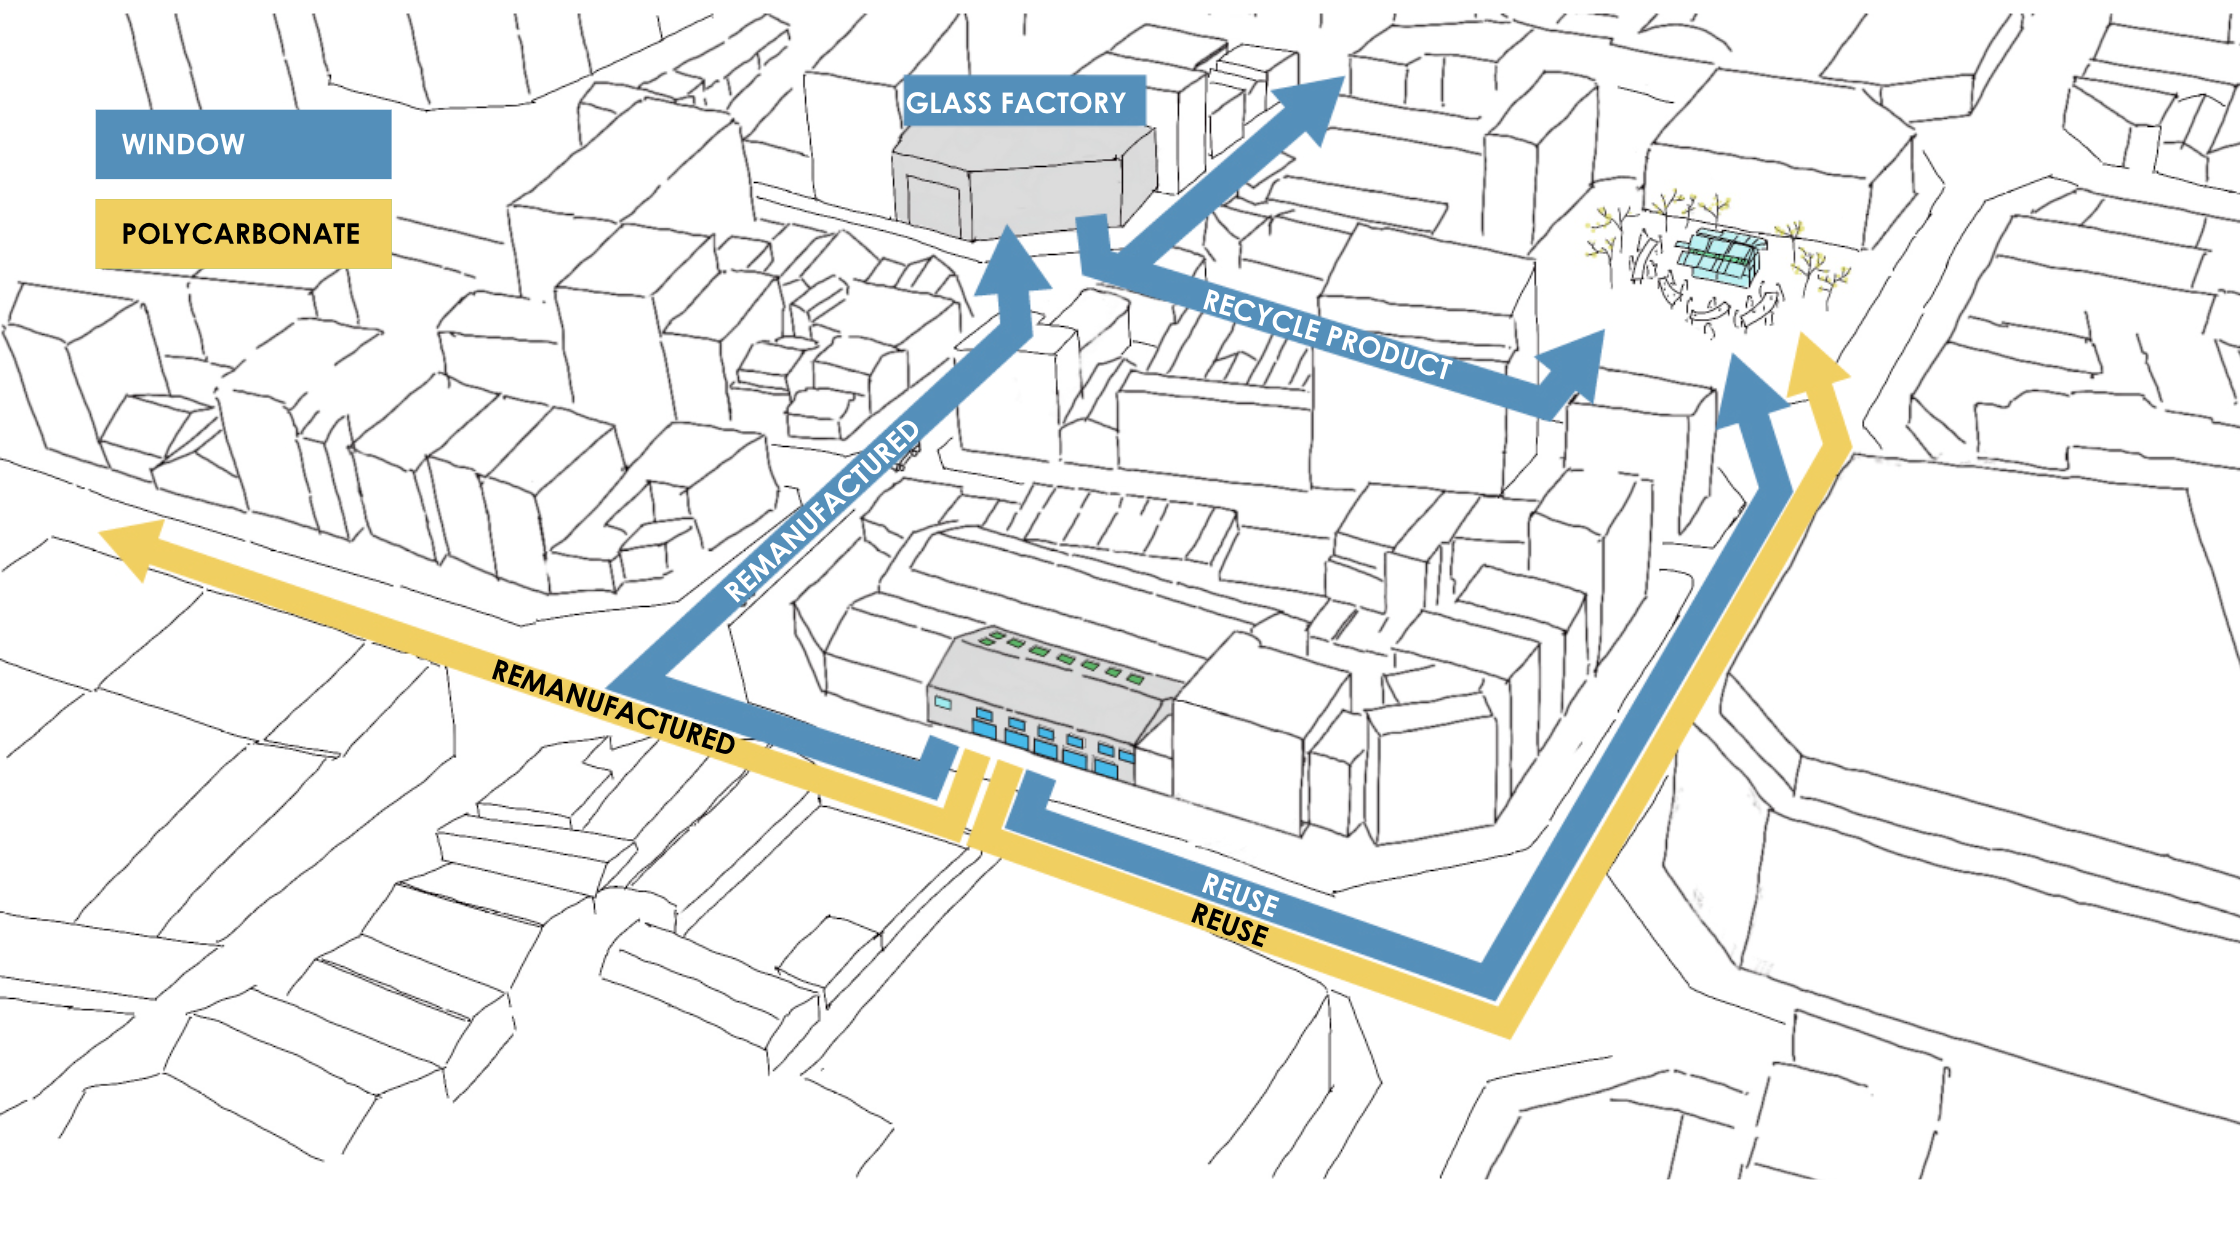
Shining Rebirth is a project about the circular lives of float glass, aluminium frame and polycarbonate roofing. Related materials are taken from IAAC atelier, with numbers, dimensions and conditions properly analysed. Carbon footprint as each stage of life is calculated, with deconstruction steps properly considered. In order to propose a new life for these materials, … Read more

Visualising Genres: Investigating the Combination of Acoustics and Art in Multi-Material 3D Printed Walls

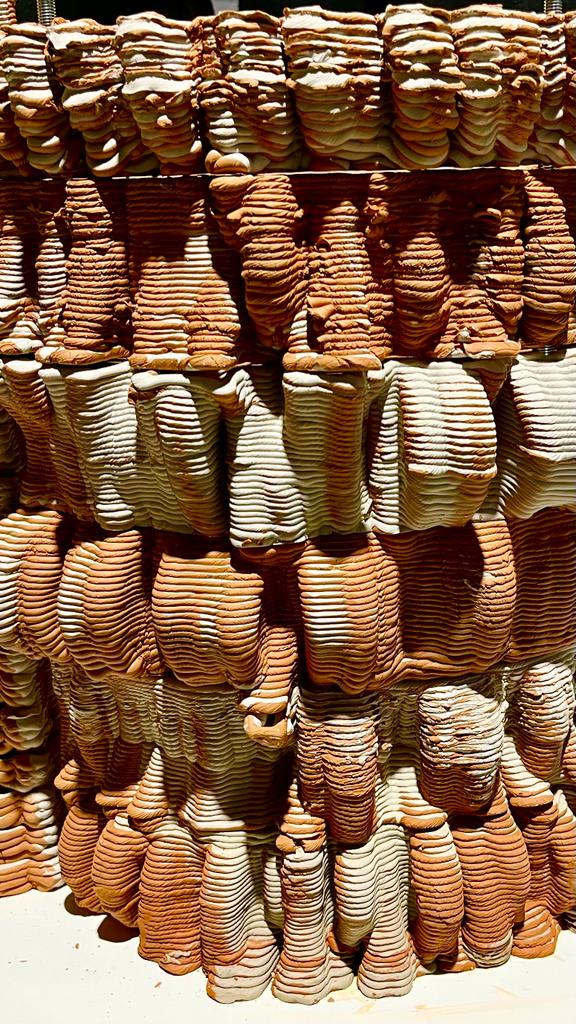
Brief Our curiosity brought us to an intriguing investigation at the nexus of technology, craftsmanship, and acoustics in the quest to elevate spatial design. This blog shares the story of our journey, where we used a cutting-edge multi-material 3D printing technique to produce personalized sound-diffusing walls—a first for the industry. Our concept began with a … Read more