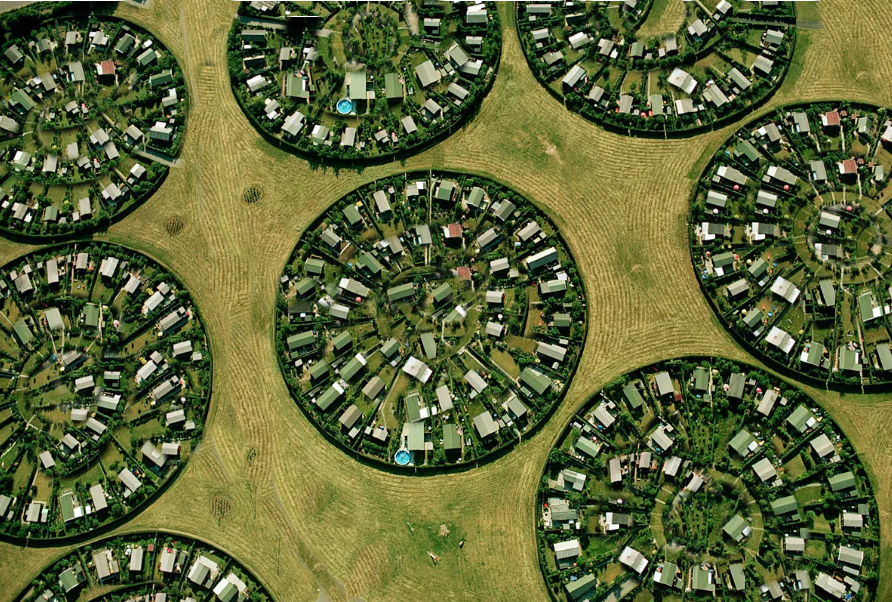
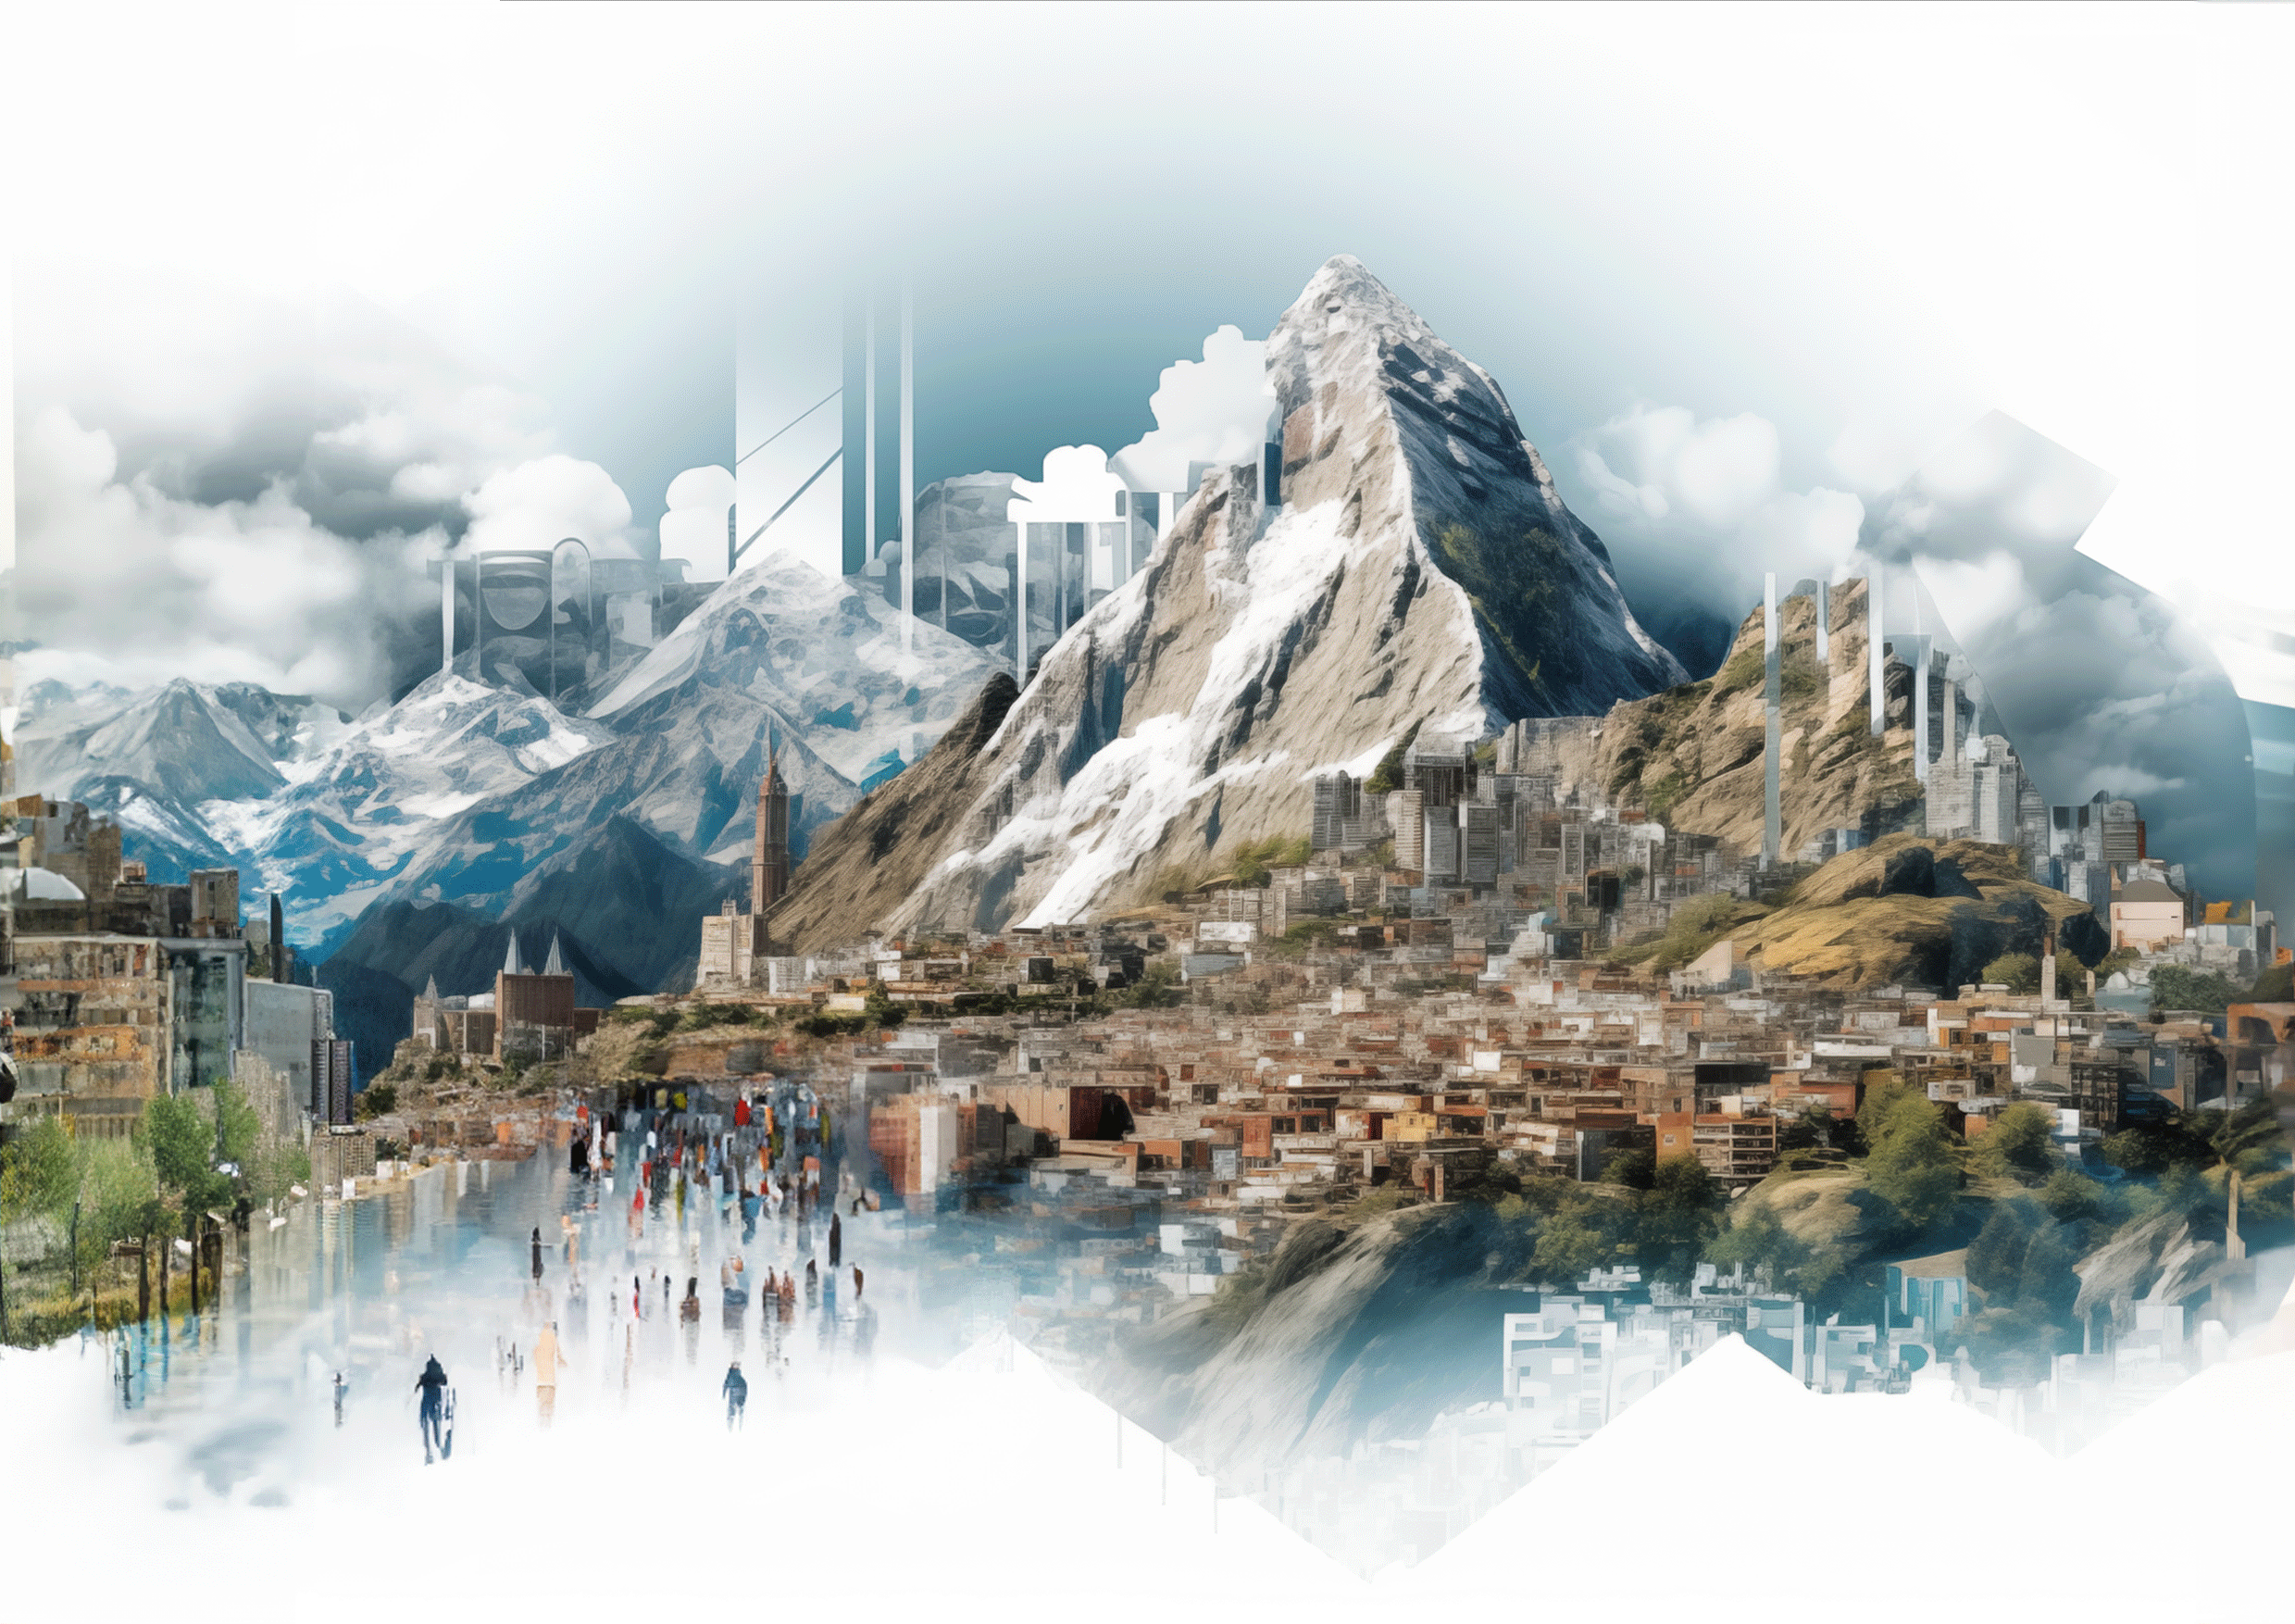
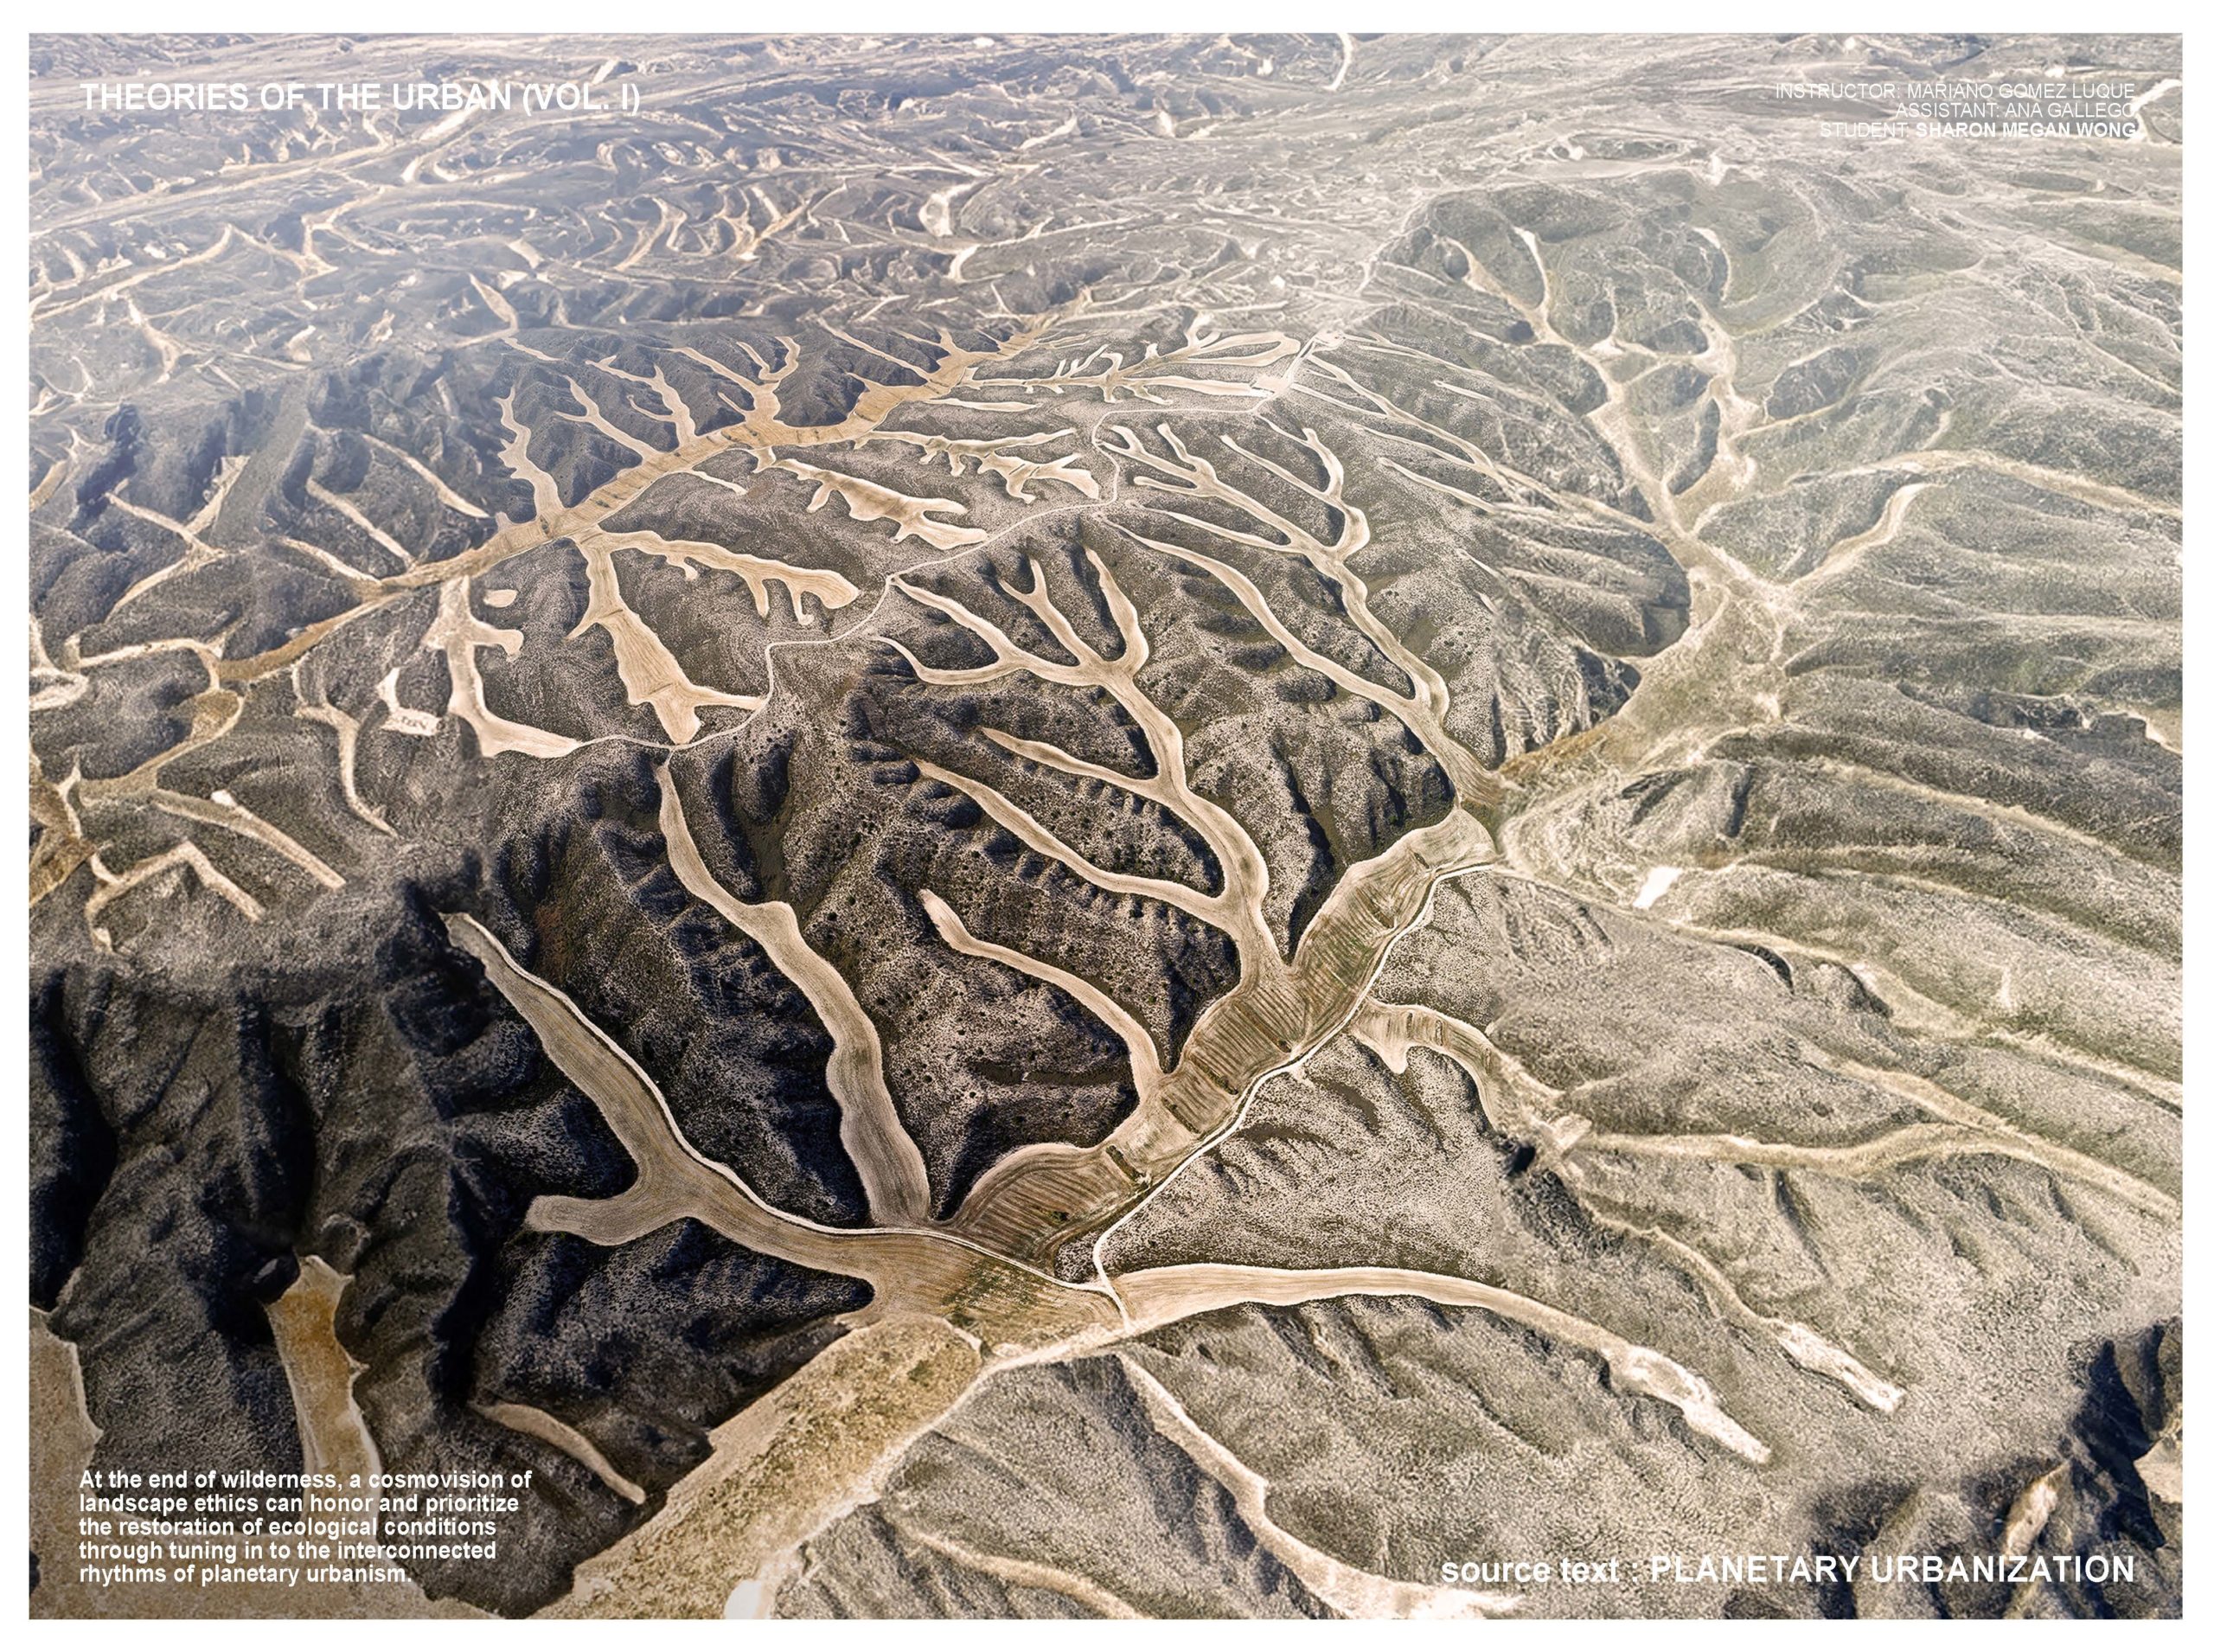
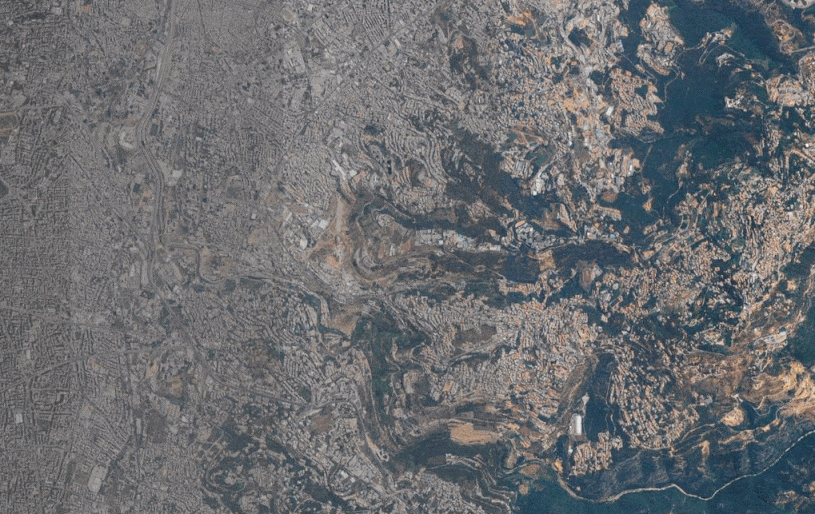
Cities or Urbanisation ?
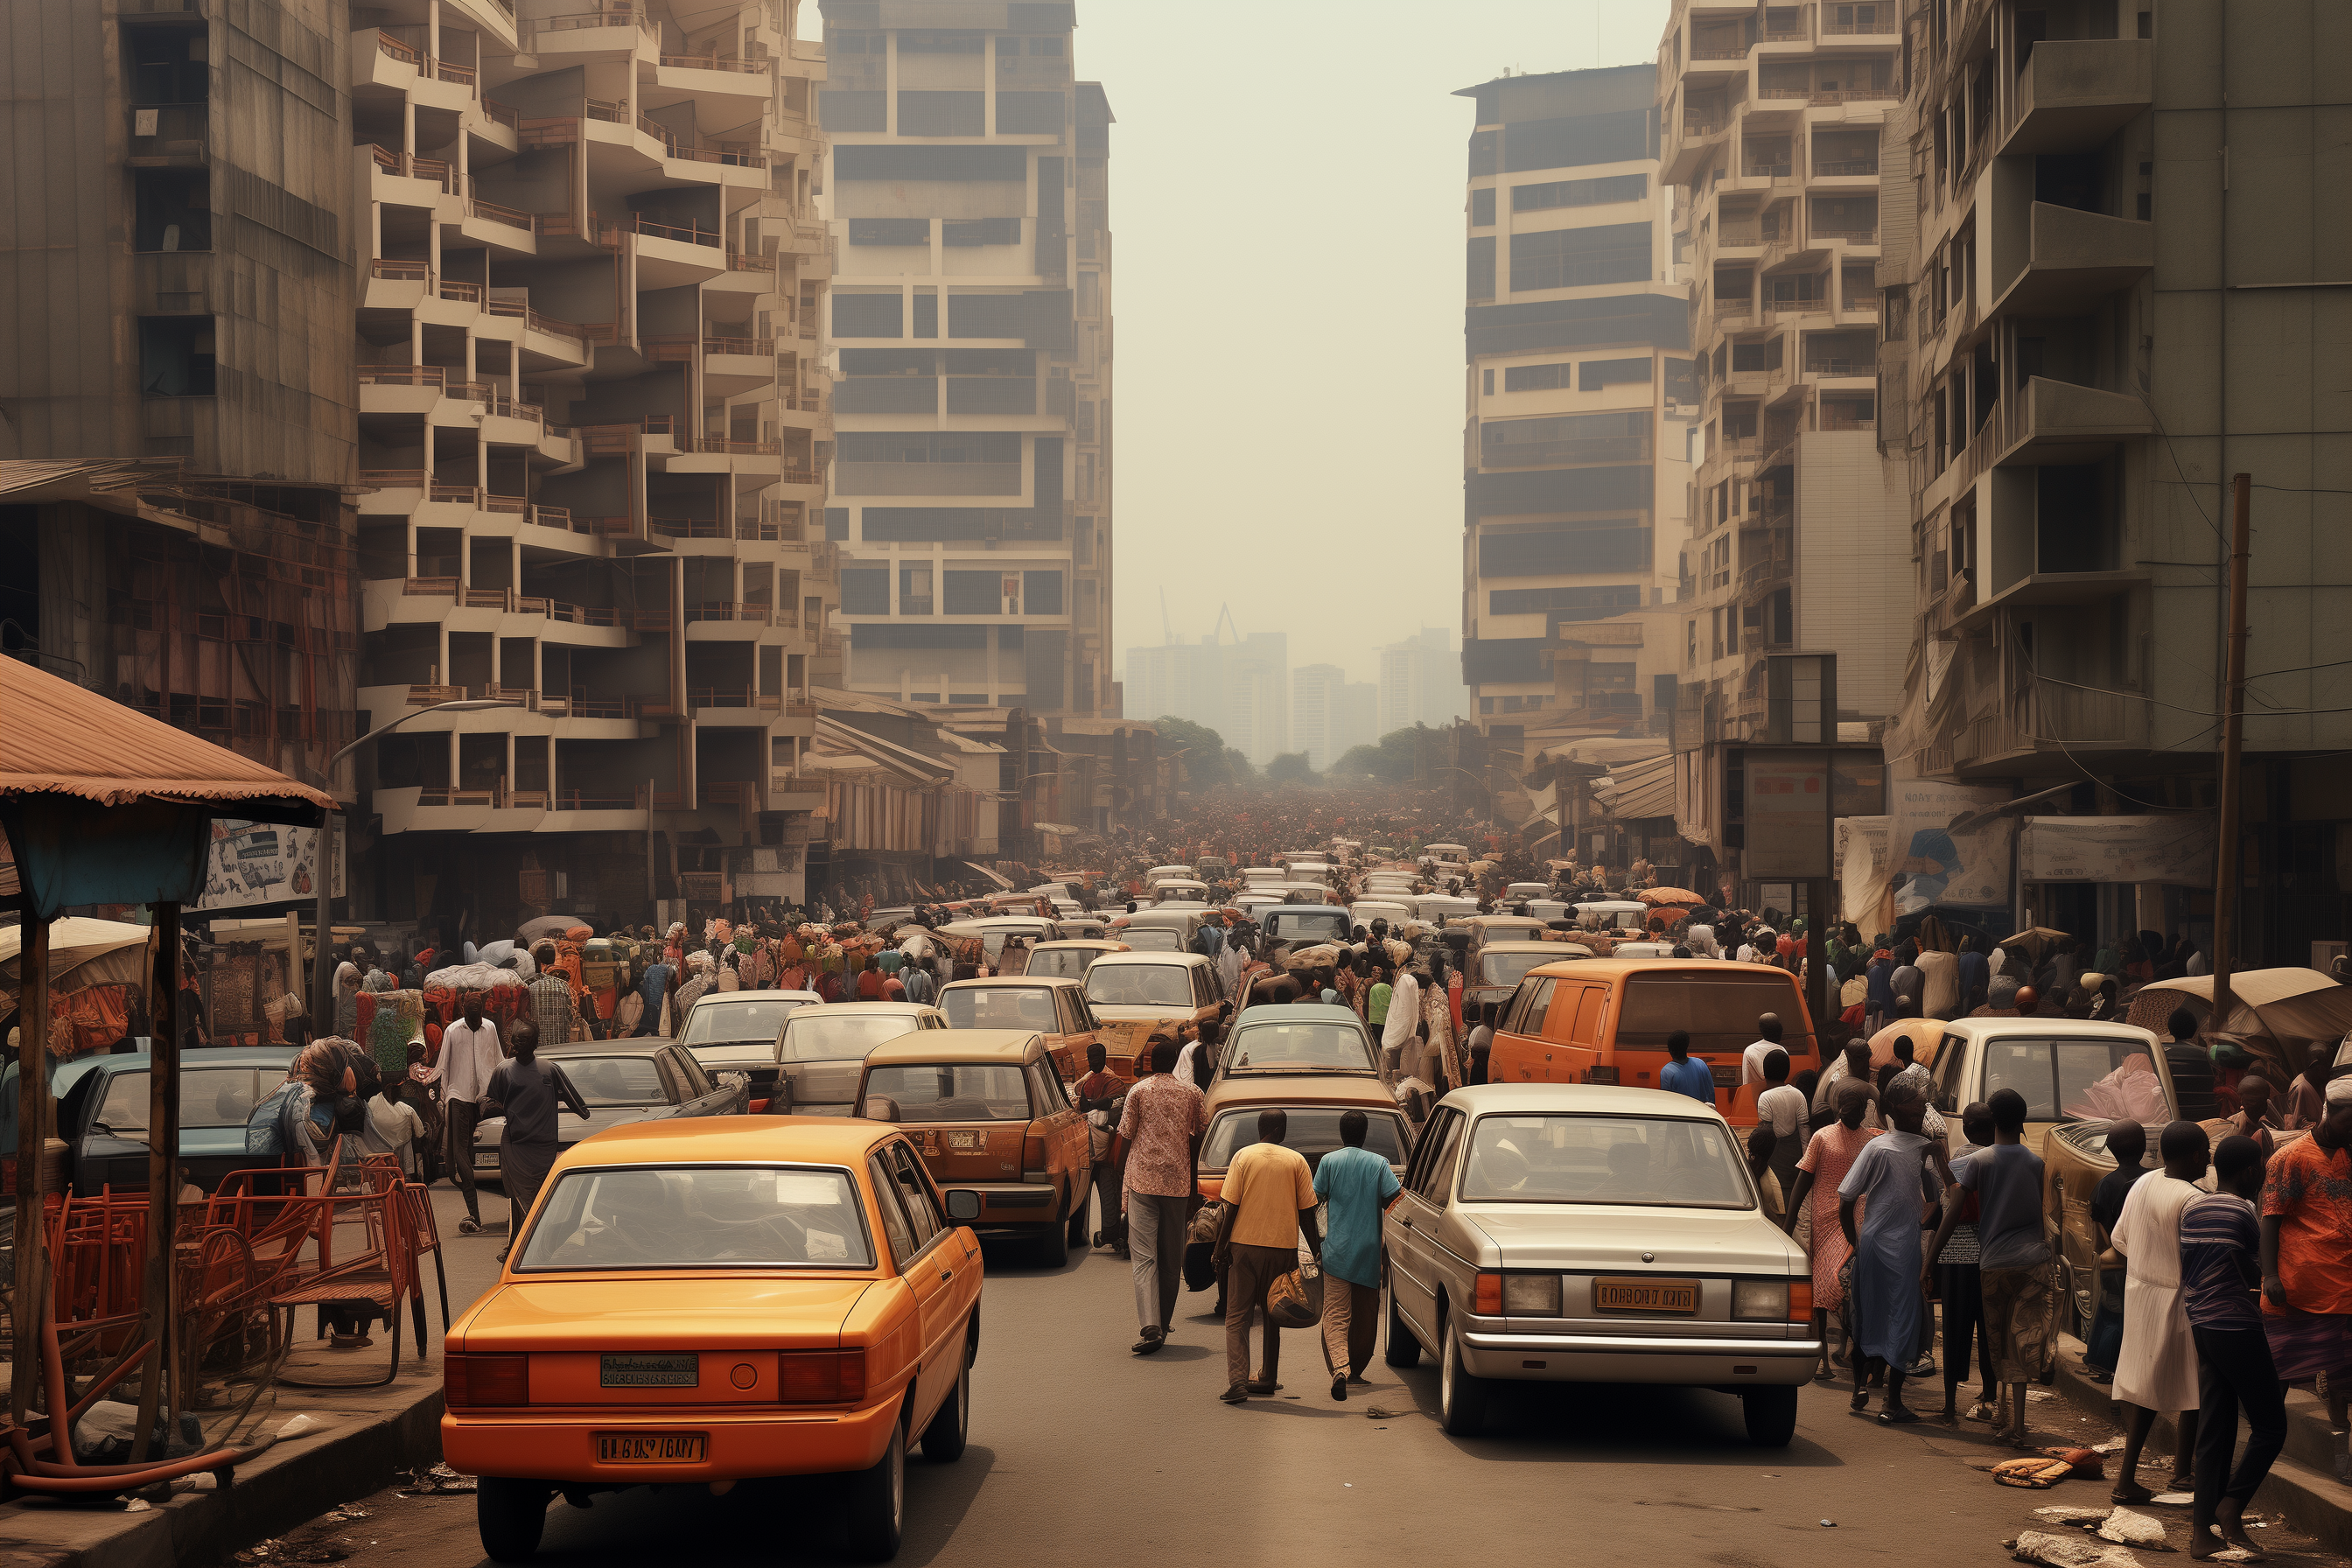
The image was created to depict an exaggeration of a Lagos market scene. In Lagos Nigeria, there is an obsession by the state to build “ultra-modern“ shopping facilities to house commercial activities. However, due to the high cost of rent of these facilities as well as the culture of traditional markets in Nigeria, traders and … Read more